Cool Inflation Print Overshadowed by Rising Yields as Stocks Stumble Into Quarter-End


Quick Summary
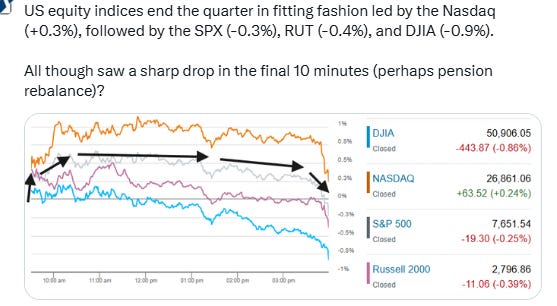
- Stocks started the day higher as a cooler-than-expected PCE prices print saw bond yields ease back lifting equities. However yields would rebound putting renewed pressure on shares exacerbated by a sharp end-of-day selloff (a possible quarter-end pension rebalance), leaving just the Nasdaq with a slim gain while the other major indices fell into the red.
- The S&P 500 was up as much as ~0.7% intraday before closing -0.3%. The Russell 2000 was -0.4% and the Dow Jones Industrial Average -0.9%; only the Nasdaq held on to a gain, +0.3%.
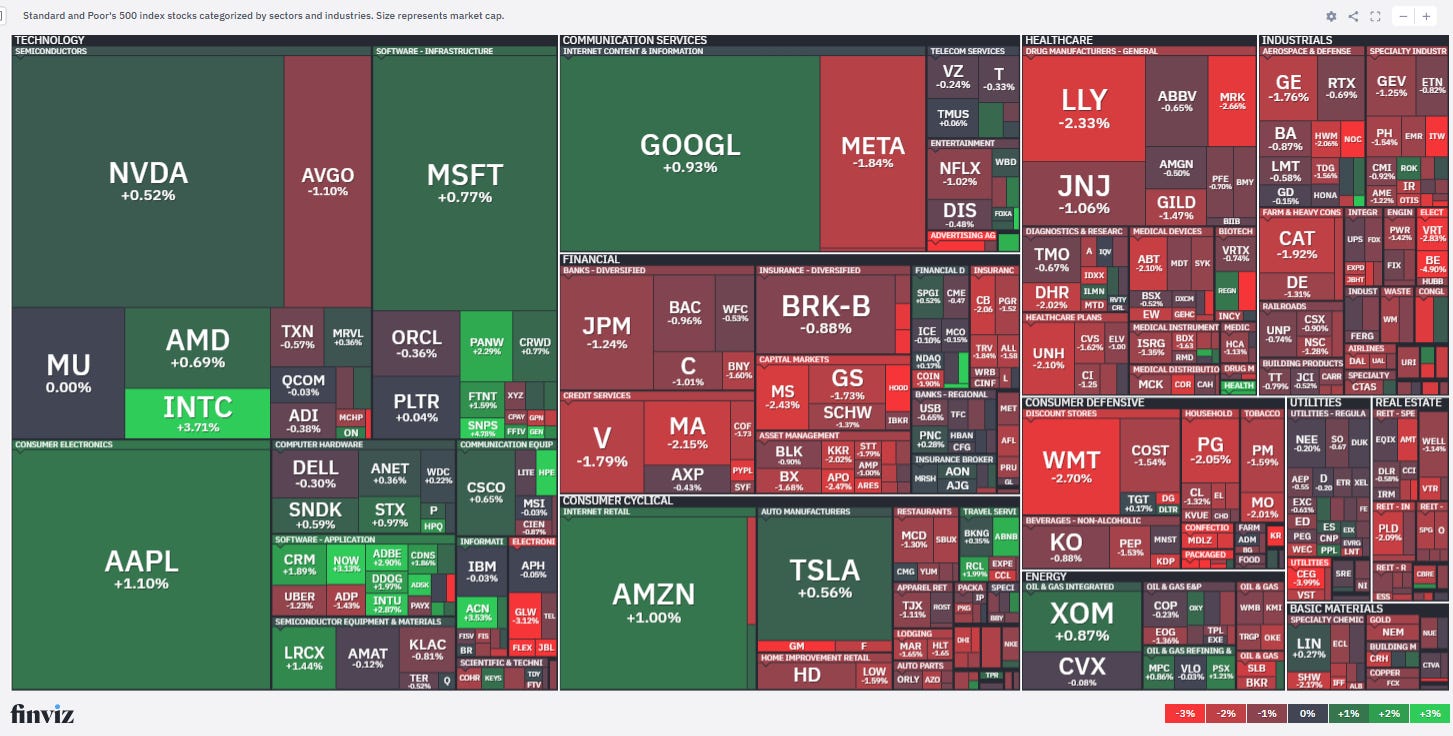
- After the drop, breadth was thin with just 2 of 11 sectors higher led though by super-heavyweight Tech (+0.6%, ~40% of market cap) which kept losses in the S&P 500 in check even as five sectors fell more than 1% (Staples worst at -1.7%).
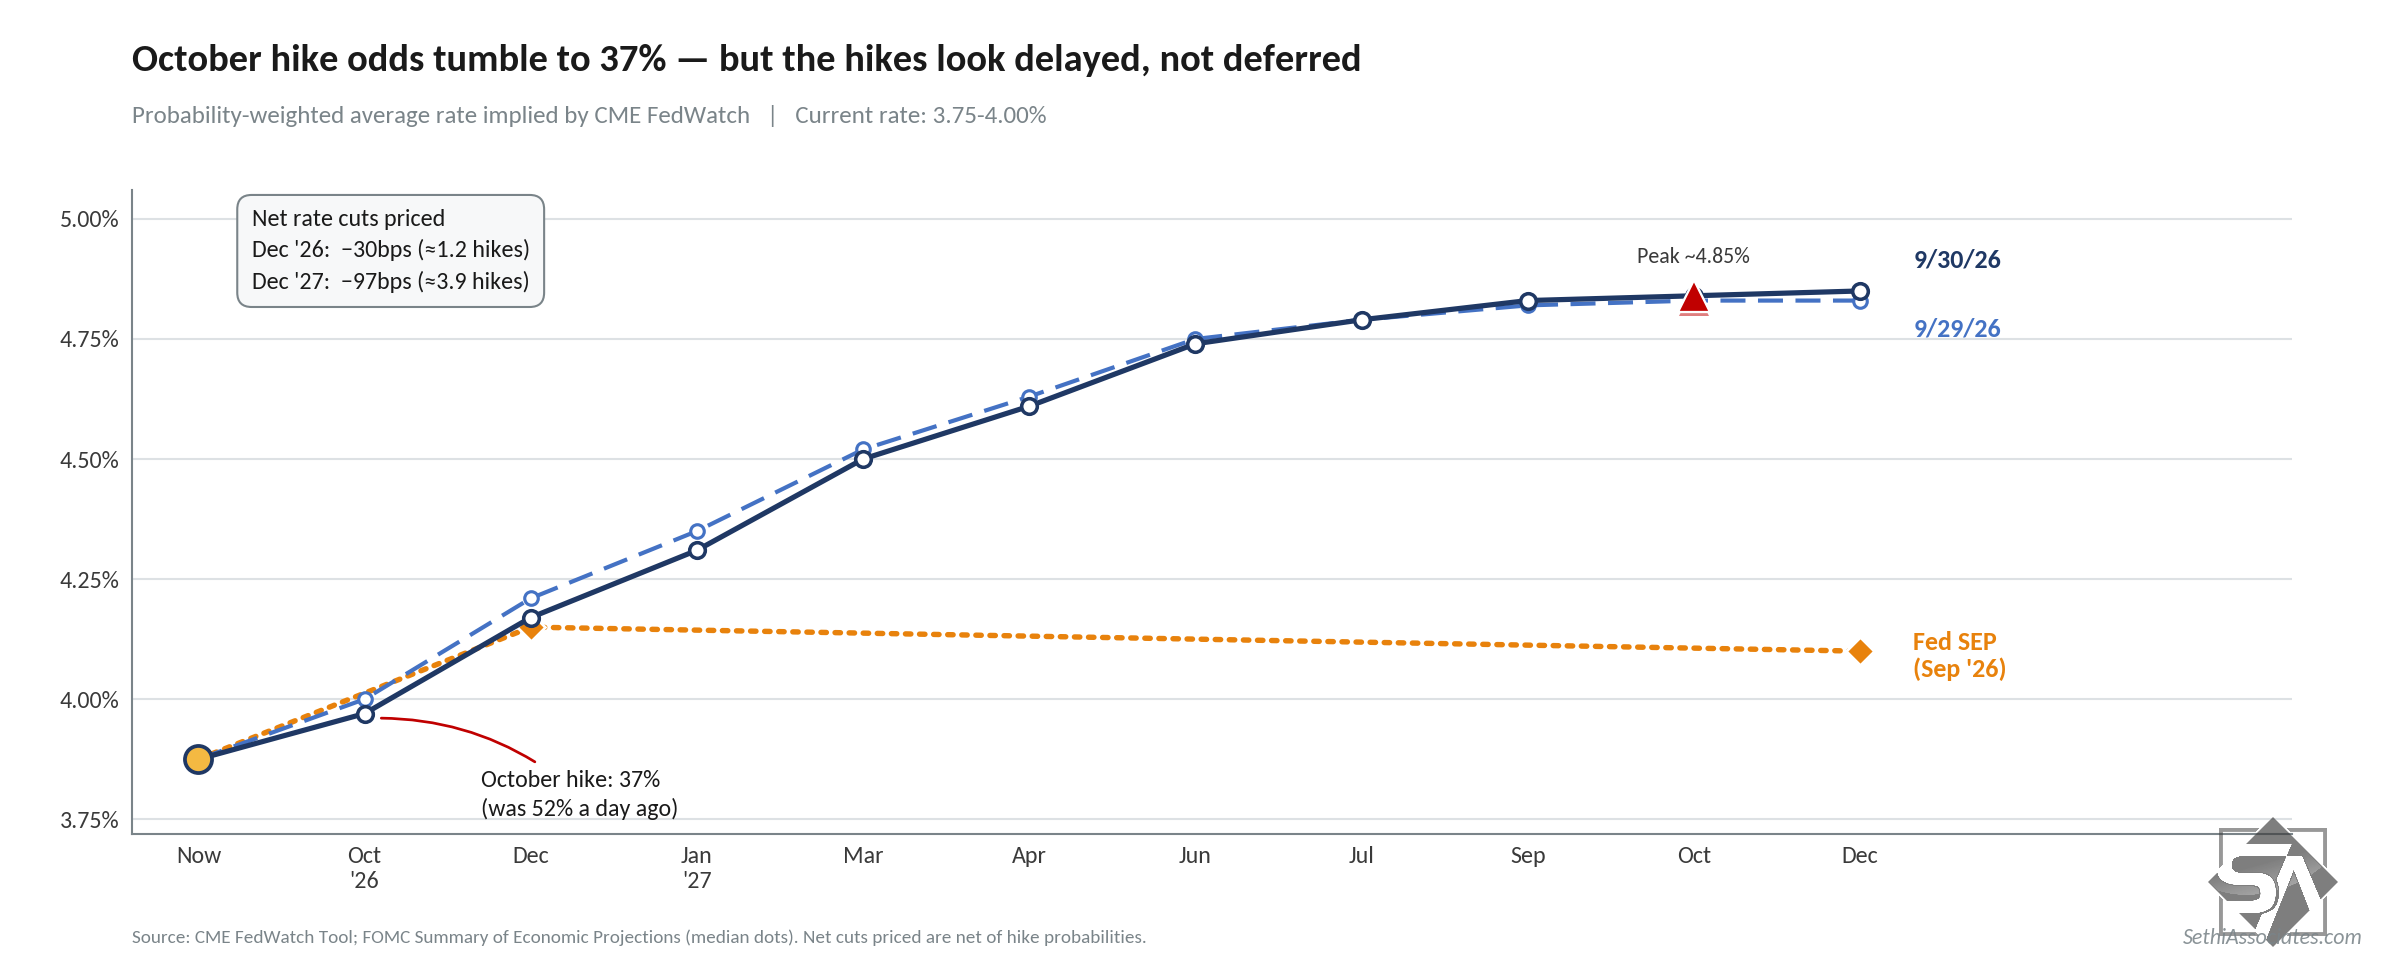
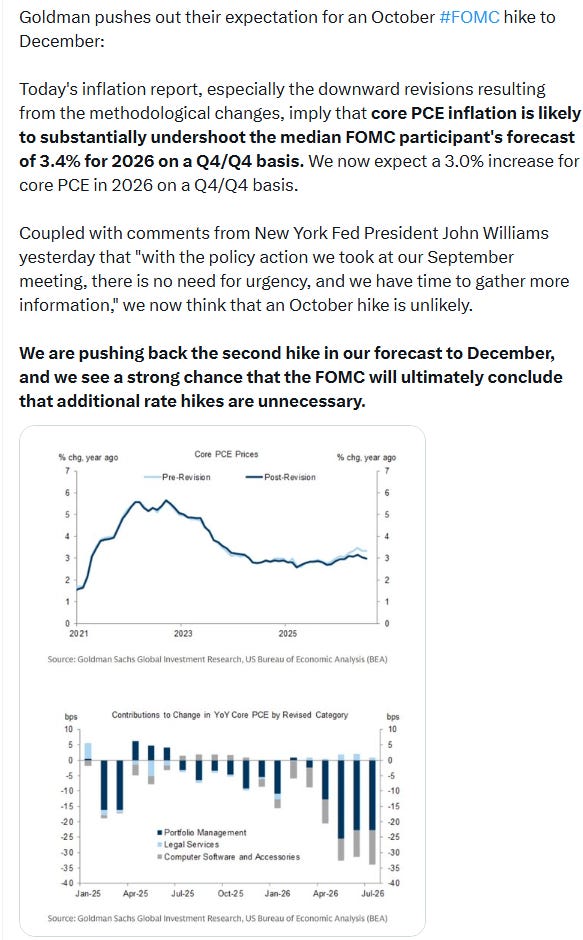
- After the August core PCE came in a tenth soft at +0.2% from a month earlier and three tenths light at 3.0% from a year earlier, October hike odds eased to ~37% from ~51% a day earlier (CME FedWatch tool), although hikes were not removed, just pushed into 2027, with still nearly four hikes priced through the end of next year.
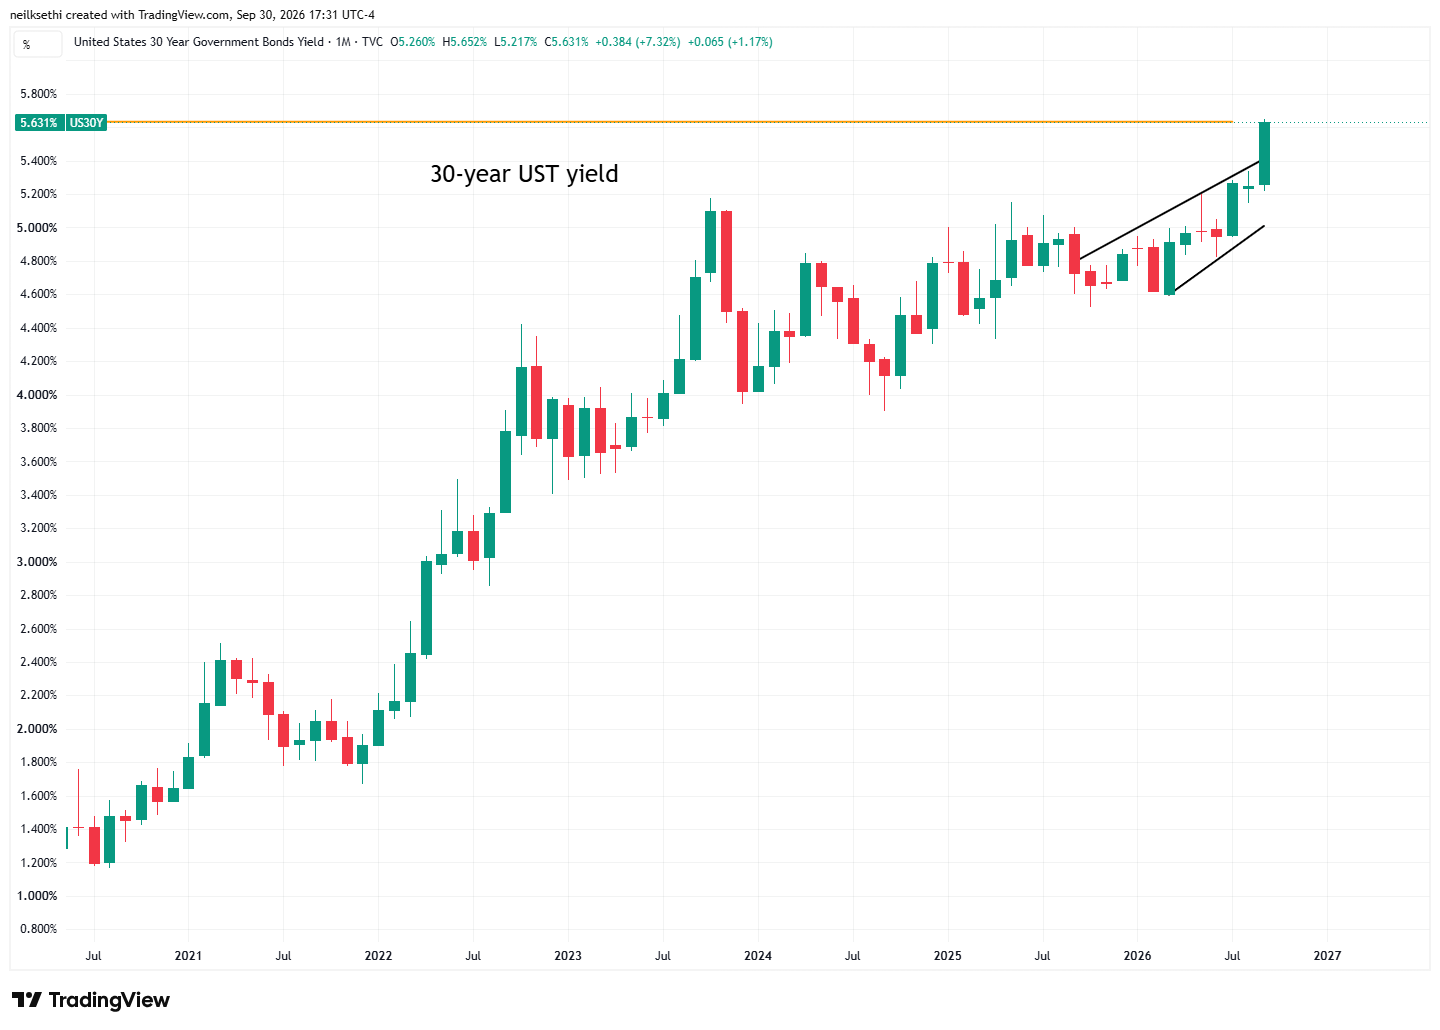
- That kept yields supported. The 30-year Treasury yield held its highest since 2002 and the 10-year matched it rising ~4bp to ~5.30%, while oil held near $90.
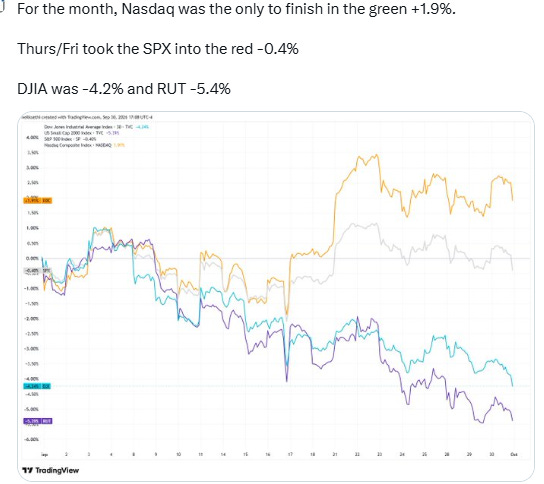
- For the month as well the Nasdaq (+1.9%) was the only major index to finish in the green. The declines this week tipped the S&P 500 to -0.4%, while the Dow fell -4.2% and the Russell 2000 -5.4%. Just two of the 11 S&P sectors gained on the month: Tech and Communications.
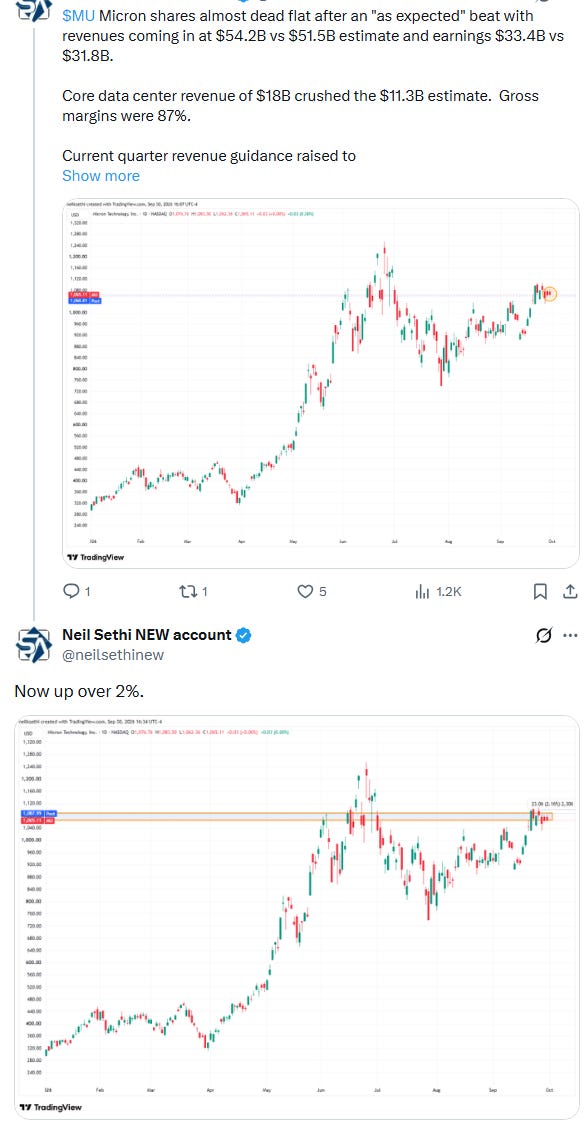
- After the bell, Micron ($MU) beat and raised guidance but traded roughly flat. Tomorrow brings another heavy slate of economic reports and a slew of Fed speakers.
The next chart should say “Losses this week” not “Thurs/Fri”.
Market Commentary
Equities:
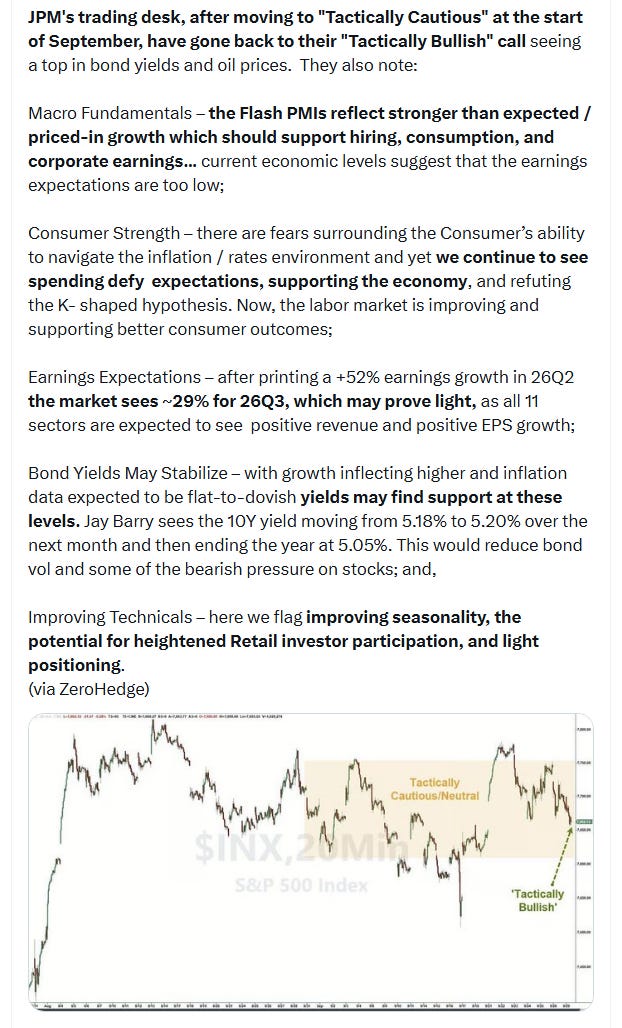
- Her team is “holding on to our risk positioning” and continues to be “constructive on risk assets,” Jasmine Yu, chief investment officer at Bryn Mawr Trust Advisors said Wednesday, adding that the artificial-intelligence build-out driving U.S. stocks higher still looks to be in its early stages.
- Adam Parker of Trivariate Research is still constructive on U.S. stocks, just not as much as he was before. “We remain sanguine about US equities, but have to say, marked-to-market, we are a shade more negative on the US equity market and risk-taking on a week-over-week basis,” he said to clients. “Perhaps it is the two investor dinners we attended last week with more macro types who are worried about policy. Perhaps it is the importance of getting regulation and policy right to the next leg higher in growth. Perhaps it is the emerging concerns about Datacenters.” He also noted that Micron, which reports after the bell Wednesday “likely needs a huge print to be at least modestly rewarded.”
Bonds:
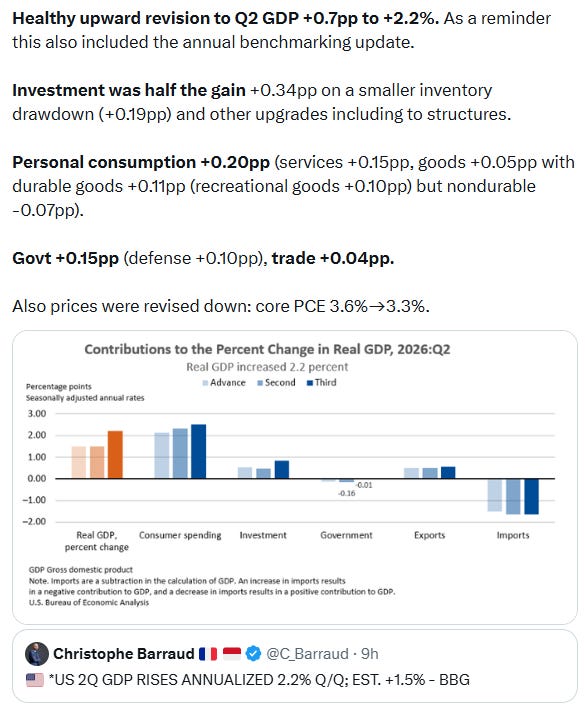
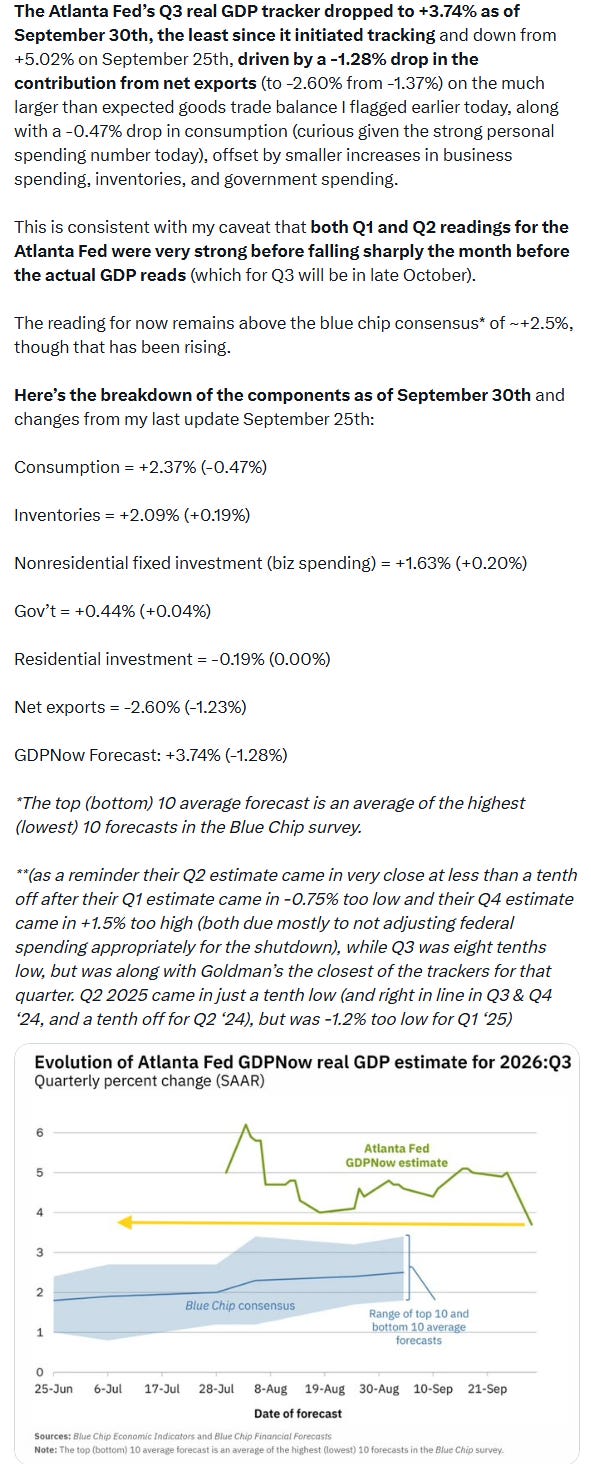
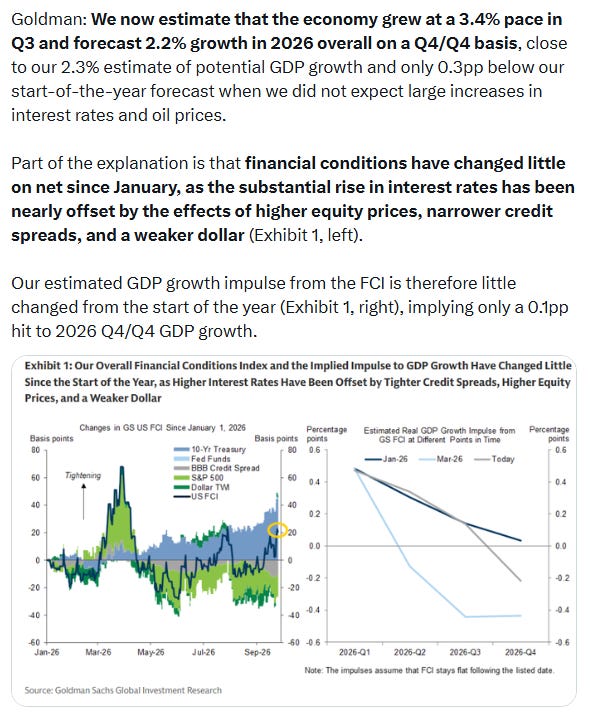
- “I’m not seeing that inflation expectations are really blowing out, so I think it’s really the growth number [that traders are eyeing]…you’ve got a fairly hot Q3 Atlanta Fed GDP expectation [and] we got a hotter Q2 GDP expectation, and so that’s probably pushing out longer-term real rate opportunities,” Rob Haworth, senior investment strategist at U.S. Bank Asset Management Group, told CNBC.
- “Going into Thanksgiving, the combination of renewed Treasury supply, heavy credit issuance and relentless AI capex demand suggests competition for capital remains intense, keeping the risk of further Treasury volatility elevated,” said Masahiko Loo, senior fixed-income strategist at State Street Investment Management.
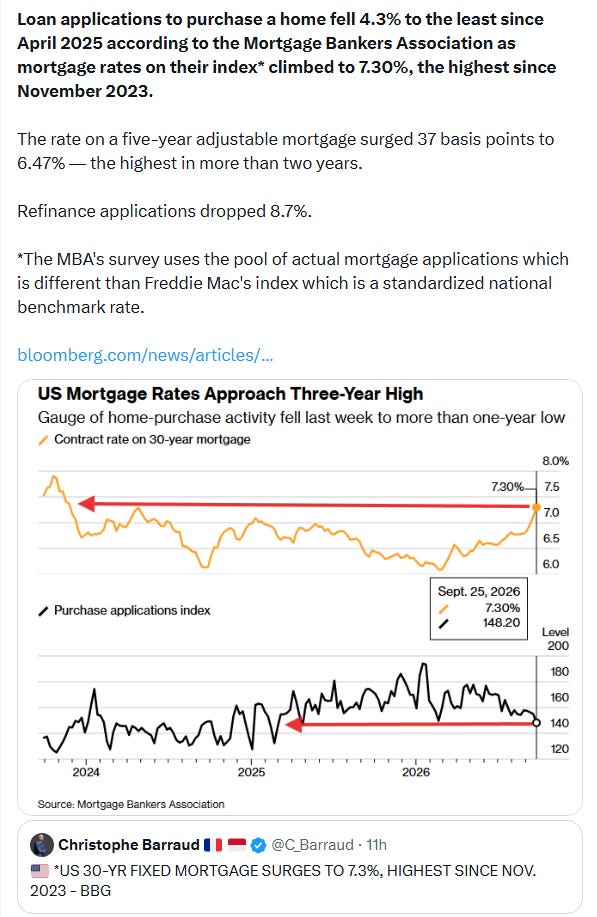
- “The high-volatility surge in Treasury yields that has pushed mortgage rates to the highest since January 2025 threatens to spark hedging activity that will ultimately deepen the bond selloff.”- Alyce Andres, Markets Live strategist
Fed:
- “Given the mixed nature of the data, it shows that the Fed was probably correct in raising rates this month, but if the inflation data improves they might be able to skip a meeting or at least raise rates less than the three times in a row that many were worried about,” said Chris Zaccarelli at Northlight Asset Management.
- “This is good news for investors worried about the recent surge in bond yields, and it bolsters the case for not hiking in October,” said David Russell at TradeStation. “We might have seen peak hawkishness from the Fed given the recent jump in rates.”
- The latest inflation revisions will buy the Fed “some breathing room,” making an October hike unlikely, according to Krishna Guha at Evercore. Still, strong growth data keeps open the debate as to how far the central bank might ultimately have to go, he noted.
- “The inflation battle is hardly over, but today’s numbers are a step in the right direction,” said Bret Kenwell at eToro. “A meaningful retreat in oil prices would help ease inflationary pressure, but the immediate focus is on Treasury yields. This report may finally take some air out of that move.”
“Friday’s jobs report and next month’s earnings season should offer more insight into whether that resilience is holding up,” said Kenwell.- “While today’s inflation data is somewhat better than expected, strong labor and GDP data suggest the print is unlikely to derail consensus expectations for another rate hike before the end of the year,” Adam Hetts, Global Head of Multi-Asset and Portfolio Manager at Janus Henderson Investors, said Wednesday in a statement shared with CNBC.
Stock and Sector Breakdown:
With the sharp end-of-session drop sector breadth fell to just 2 of 11 sectors higher Wednesday (after 4 Tuesday, 3 Monday) although led by super-heavyweight Tech (~40% of market cap) +0.6% keeping losses in check despite five sectors finishing down more than 1%.
Tech also led all sectors for the month, finishing +4.8%, helped by megacaps, with the Vanguard Mega Cap Growth ETF ($MGK) rising 0.4% Wednesday and finishing September up 3.2%,
Software stocks were particularly strong Wednesday, with the iShares Expanded Tech-Software Sector ETF ($IGV) gaining 1.2%. Semiconductor stocks though were little changed, leaving the PHLX Semiconductor Index ($SOX) flat, but the group was one of September’s standouts with a 9.5% monthly gain. Micron ($MU) +0.00% also closed flat ahead of its earnings report after the bell, which, as expected, was a solid beat along with a raise to current quarter guidance (see post below). Shares are up ~2% in the after-hours.
There were several pronounced moves elsewhere in the technology landscape. Hewlett Packard Enterprise ($HPE) +3.90% rose after lifting its Networking outlook and increasing its expected Juniper cost synergies ahead of its Networking Investor Day. Jabil ($JBL) -10.1% meanwhile, was the worst performing stock in the S&P 500 despite better-than-expected results and an upbeat outlook, as the results didn’t meet the Street’s high expectations.
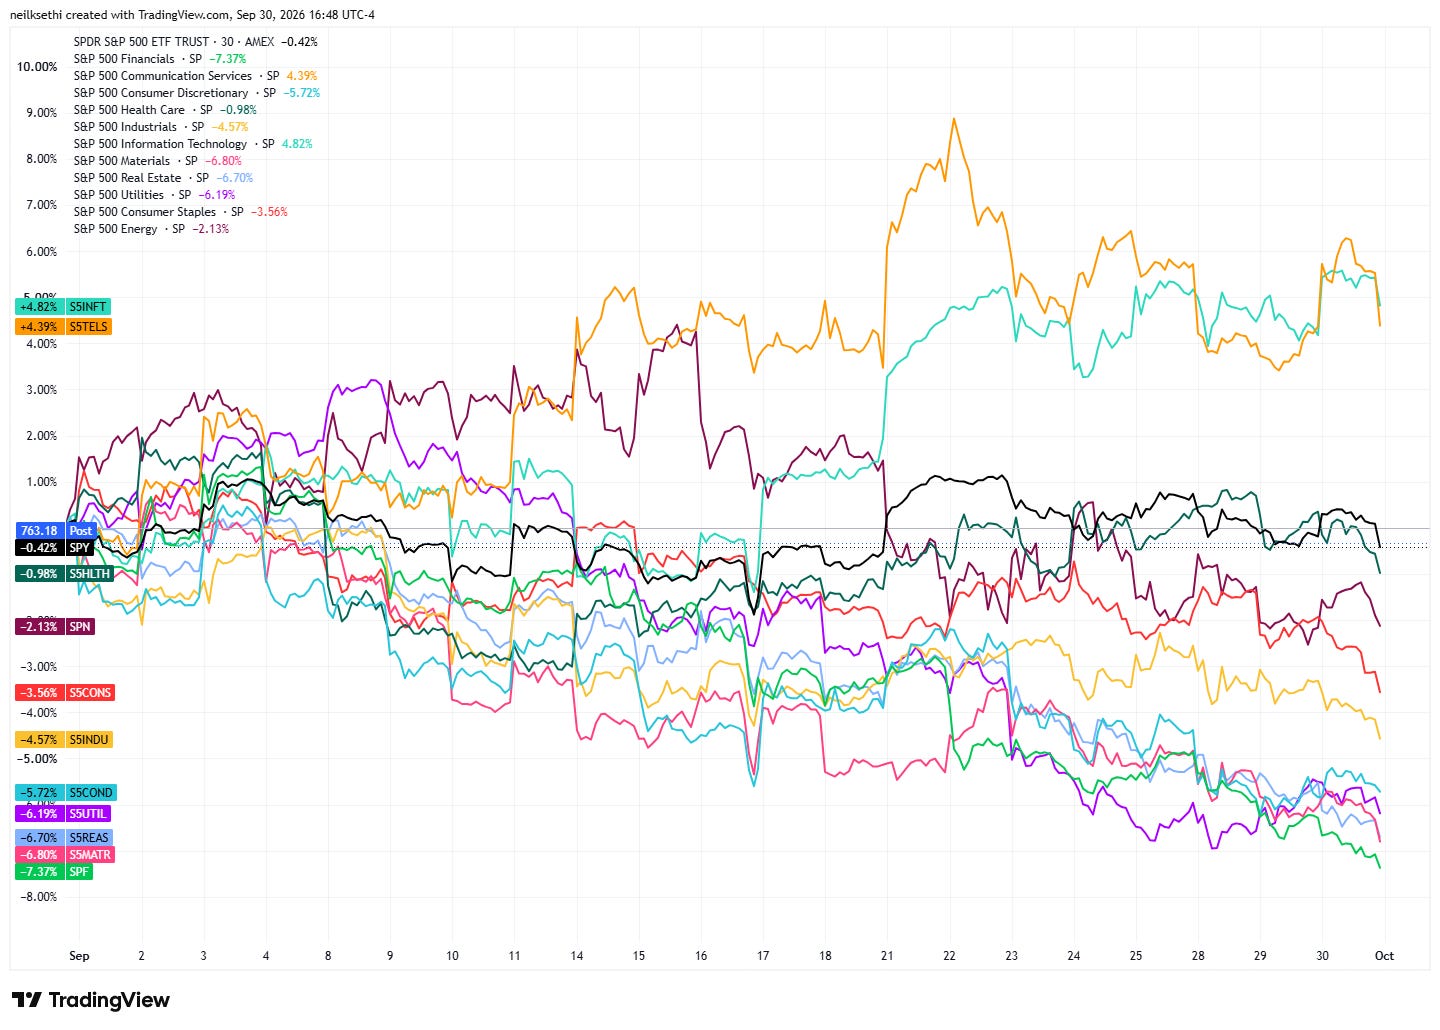
The communication services sector (flat) surrendered a sizable earlier gain as Meta Platforms ($META) -1.8% and Alphabet ($GOOG) +1.00% dropped into the close. Still, the sector gained +4.3% in September finishing second to Tech, the only two sectors to finish in the green (see chart below). Amazon ($AMZN) +1.0%, was another megacap that finished up 1%.
Moderna ($MRNA) -5.4% was a notable laggard in the health care sector and the second-worst S&P 500 component after being downgraded to Sell from Neutral by 5-star analyst Geoff Meacham at Citigroup.
Boeing ($BA) -0.9% would finish lower despite securing a contract valued at more than $20 billion from the U.S. Navy to build its next-generation jet fighter. Shares of Northrop Grumman ($NOC) -4.2%, the only other competitor for the contract, were among the S&P 500’s biggest laggards. The two contractors had spent the past year vying for the business after Lockheed Martin ($LMT) bowed out of the competition. If you missed it, Chris Versace had an update on Boeing along with several other stocks part of the Pro Portfolio, along with Pro Portfolio co-manager Bob Byrne, while “Sarge” Guilfoyle opined on NOC.
Gen Digital ($GEN) +5.6% would lead all S&P 500 components with no news on Wednesday, so presumably follow through from CEO Vincent Pilette’s LinkedIn post discussing the company’s acquisition strategy as well as aspects of its financial outlook and guidance, including a statement that “our full year outlook are both tracking to the higher end of our guidance.”
[Note: chart uses futures prices.]
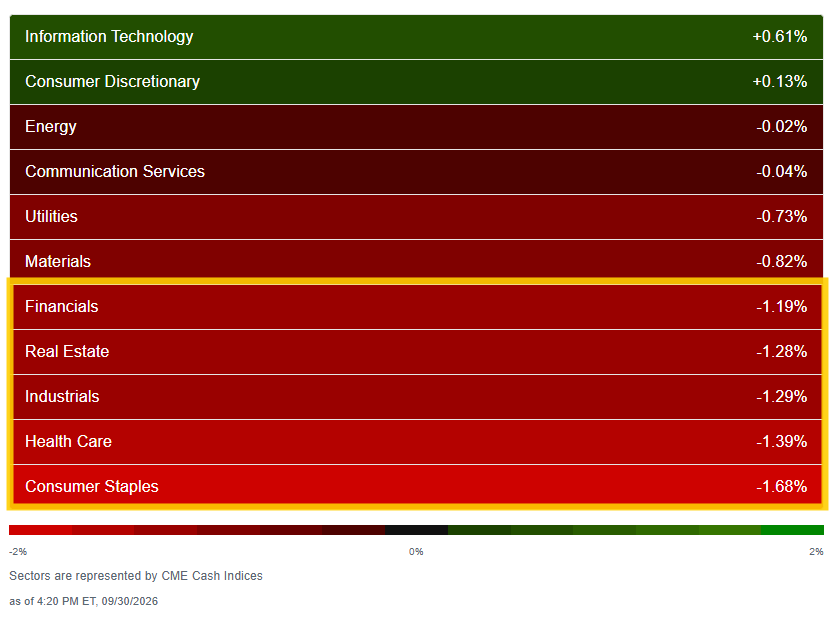
SPX sectors in September.
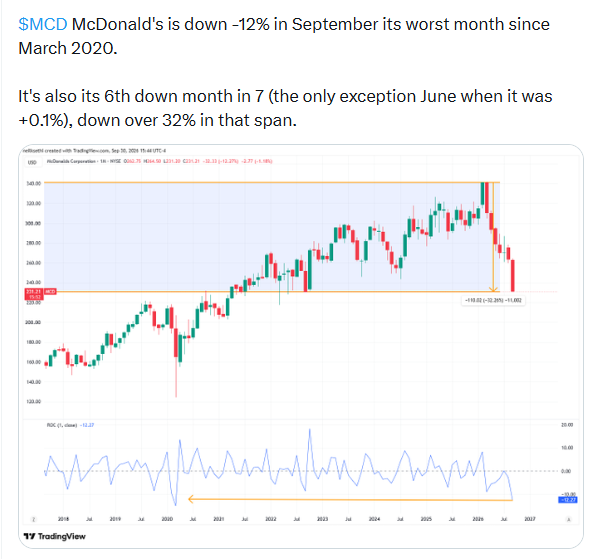
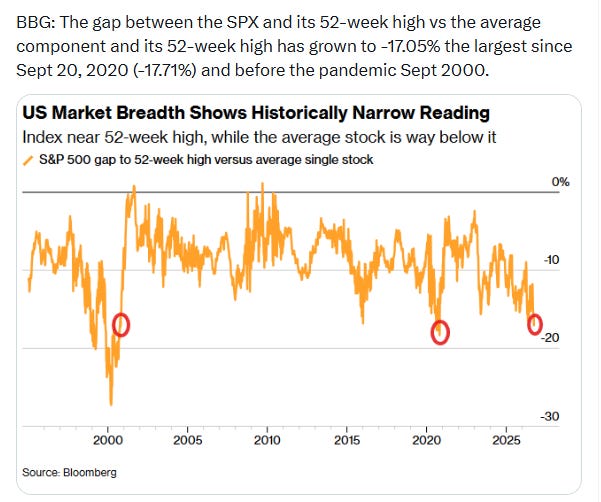
The number of large SPX winners (up over 3%) dropped back to just 9 from ~20 Tuesday, two Monday, while the number of large losers (down over 3%) edged higher to 17 from six Tuesday, ~40 Monday. As mentioned previously, both of these metrics have remained very subdued since the start of August rarely getting above 50 and only once above 100.
And for a second day breadth metrics improved slightly including for the NYSE despite the index finishing down -0.92%. New 52-week highs vs lows rose to -280 from -384 on the NYSE. On the Nasdaq (which finished +0.24%) they went to -283 from -425.
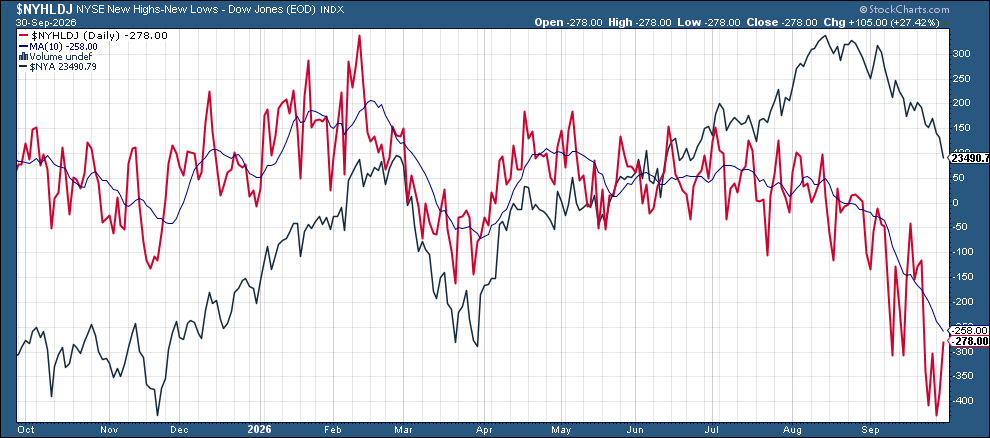
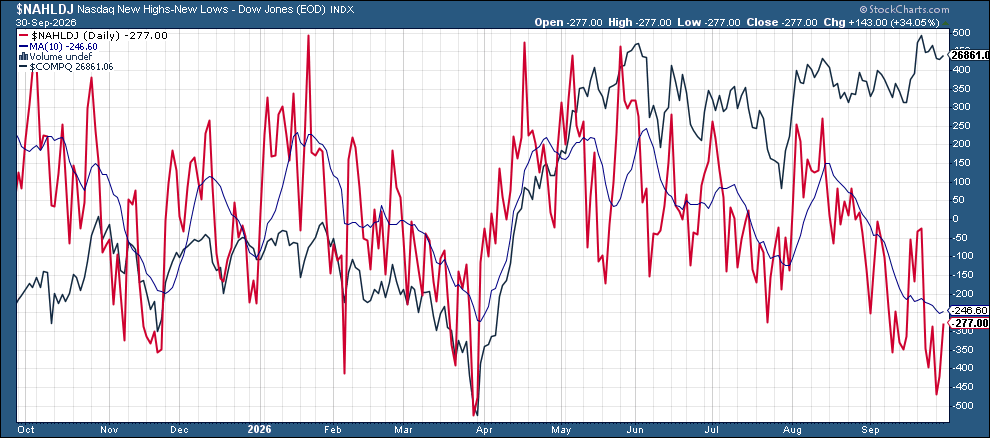
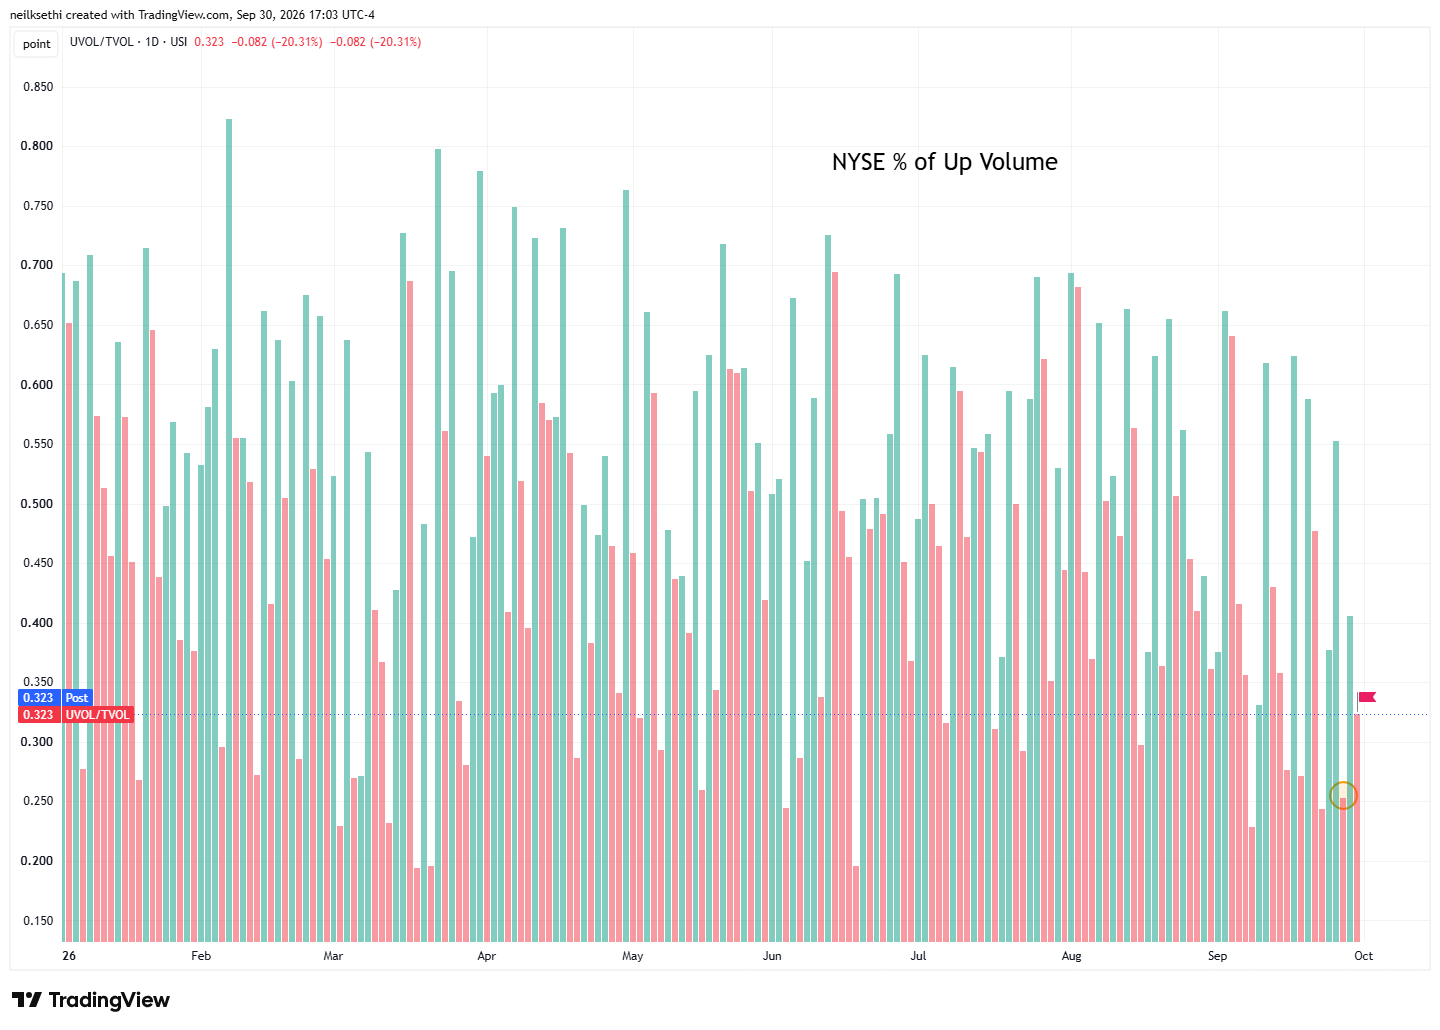
And while positive volume fell to 32.3% on the NYSE, compare that to Monday when it was just 25.3% on a smaller -0.65% loss (circle).
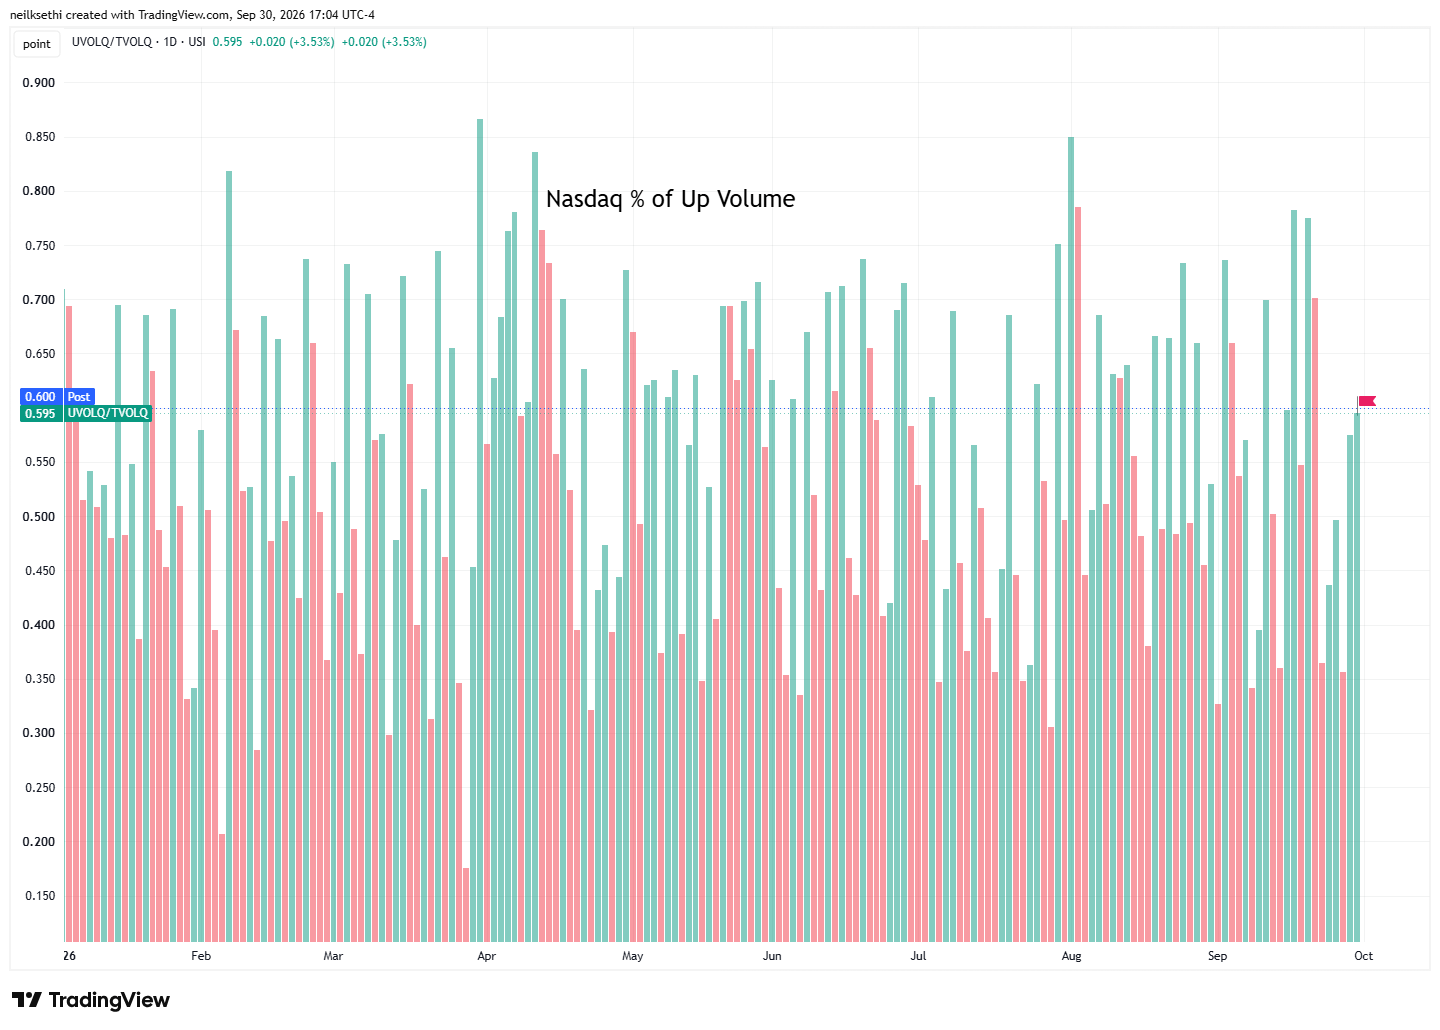
The Nasdaq came in at 60%, the best in over a week.
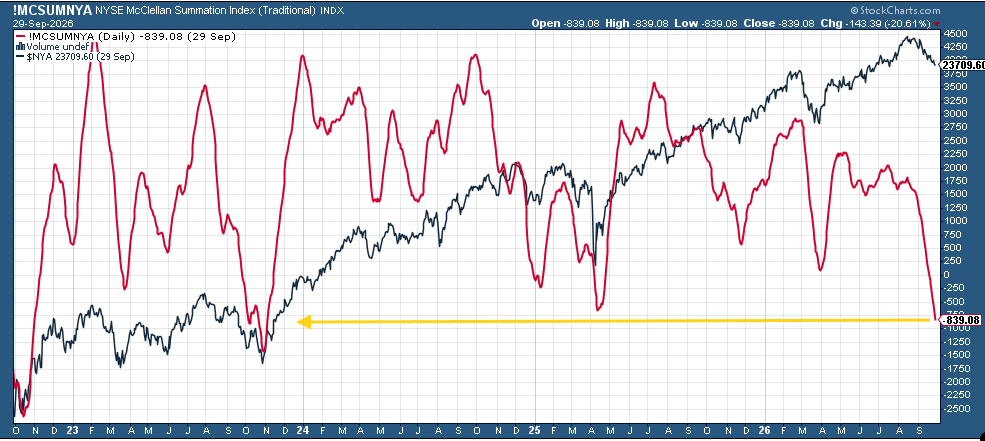
But the McClellan Summation Index (red line, broadly whether the typical stock is doing relatively better or worse than the index) continued to fall to new post-November 2023 lows.
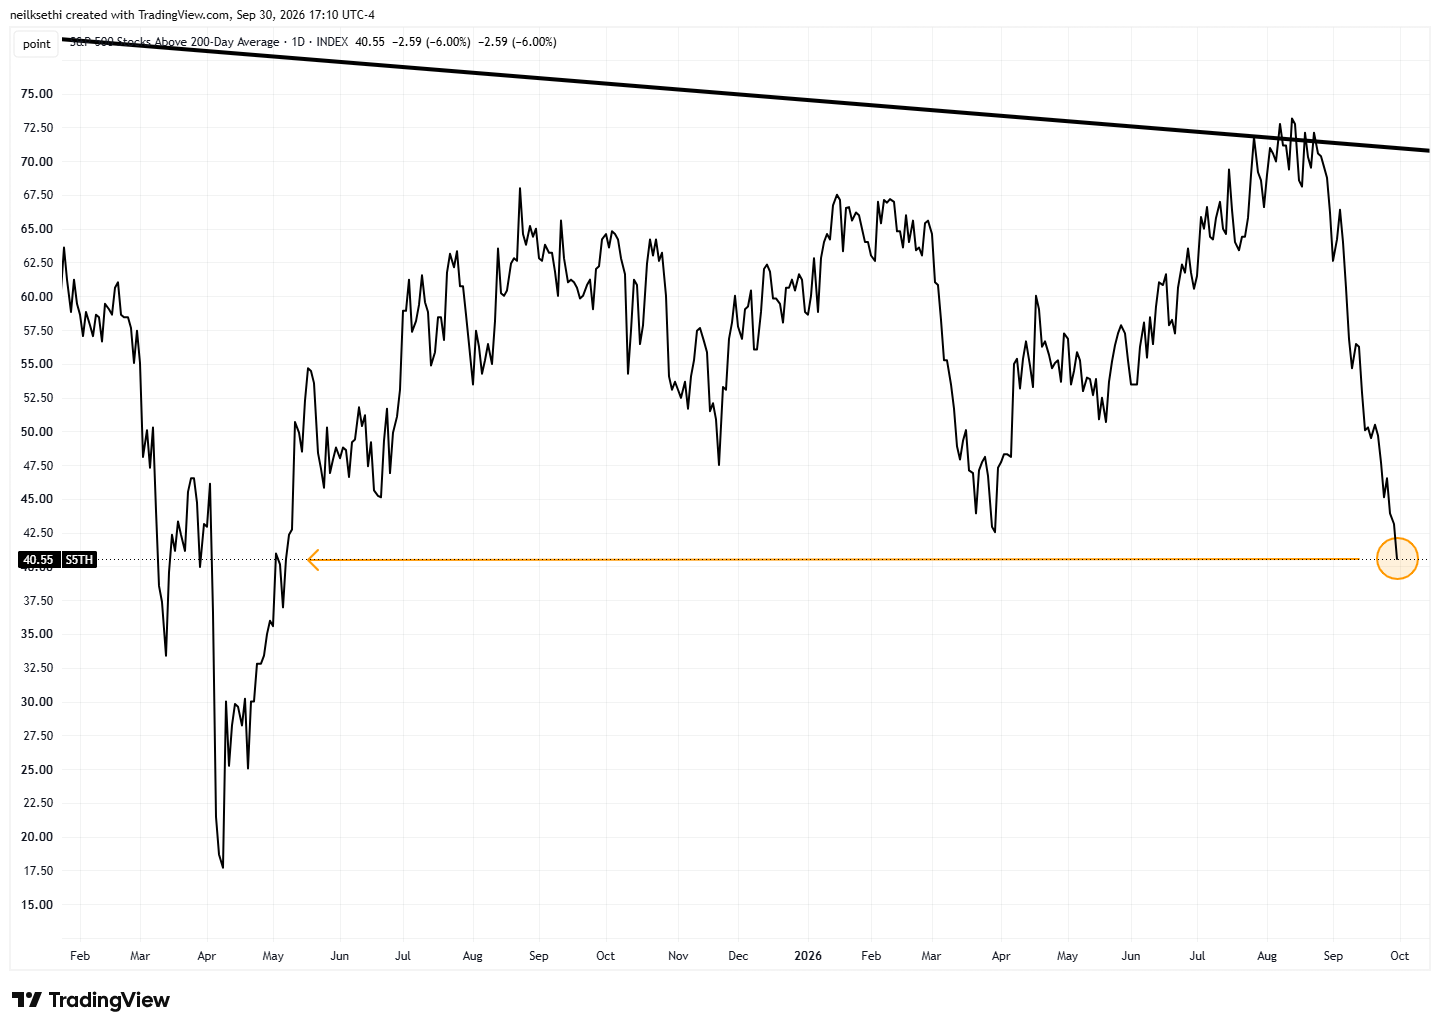
And no turn higher in the percent of S&P 500 stocks trading above their 200-day moving average which fell to 40.55% the least since May 6, 2025.
Some other stock-specific commentary from TheStreet Pro:
- Chris Versace –
- Stephen Guilfoyle –
- James “Rev Shark” DePorre – How to Handle a Stock That Is Acting Poorly
- Bob Byrne – Can Boeing Get Out of Its Own Way?
- Bob Lang – Chart of the Day: Watching Toast as the Stock Gets Burned
A Look At The Charts
Note on all charts the colored lines are moving averages (the average price over the lookback period — days on the daily charts, weeks on the weekly charts):
20 = green
50 = purple
100 = blue
200 = brownException is monthly charts where blue is 10-month moving average and brown is 20-month moving average.
MACD = Moving average convergence/divergence line, a measure of momentum that compares longer term and shorter term momentum to gauge if a move is strengthening or weakening. This is probably my favorite individual indicator.
RSI = Relative Strength Index (basically what it sounds like) = measures the strength of the move comparing gains to losses over the given lookback window (I use the standard 14 periods).
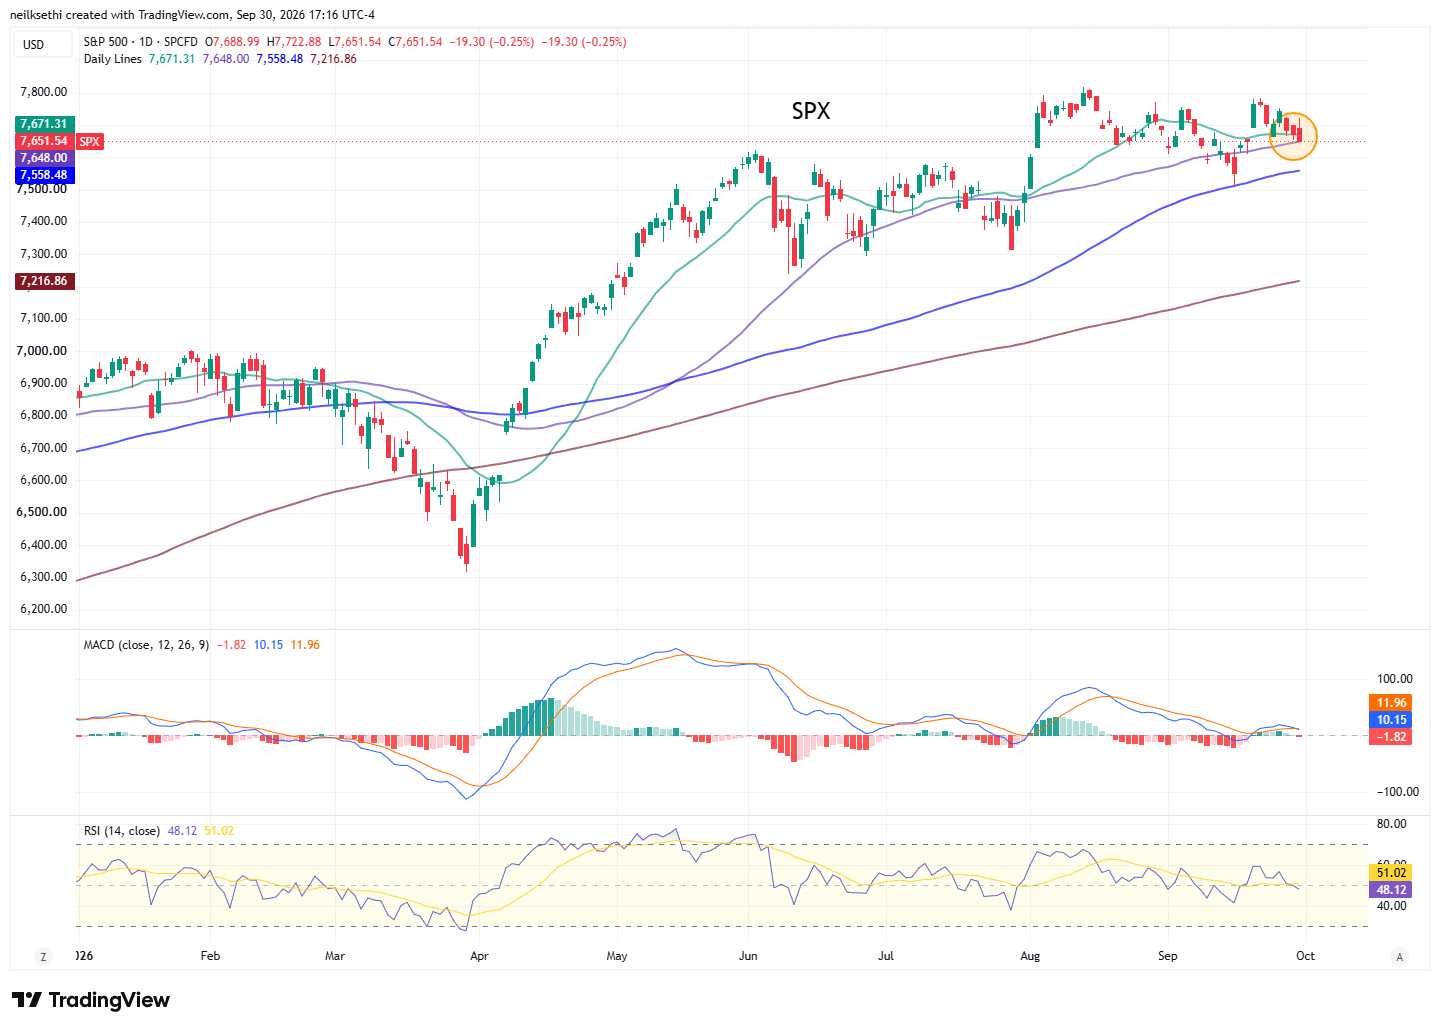
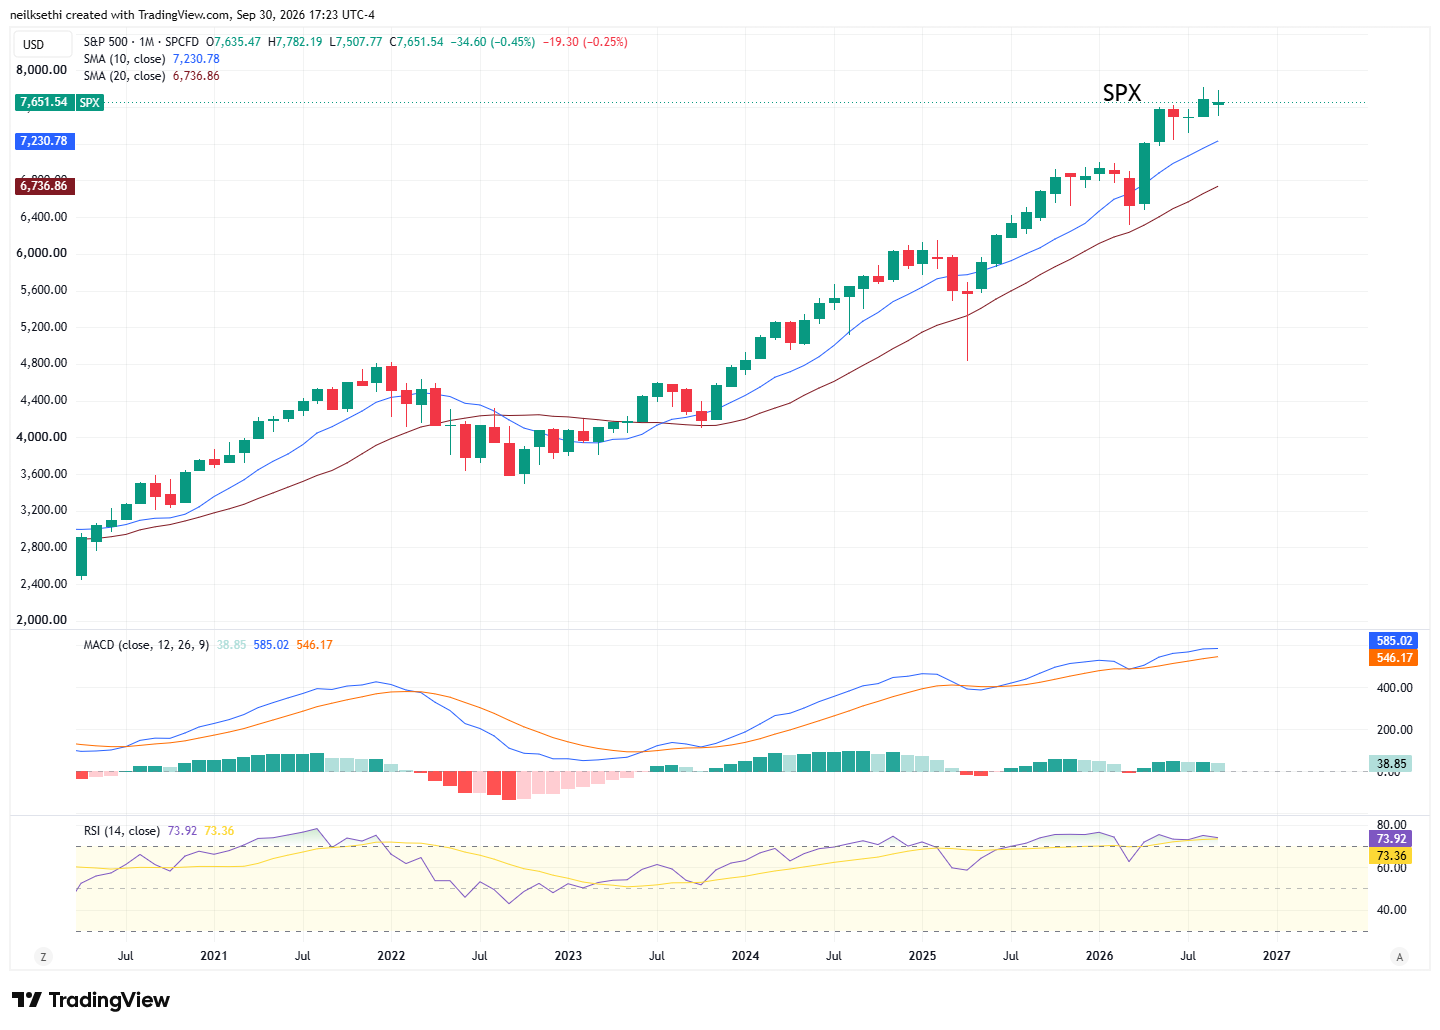
SPX closed right on the 50-DMA. The daily MACD and RSI have now softened to slightly bearish.
Looking at the monthly chart, though, it looks very strong, perhaps the best of the bunch.
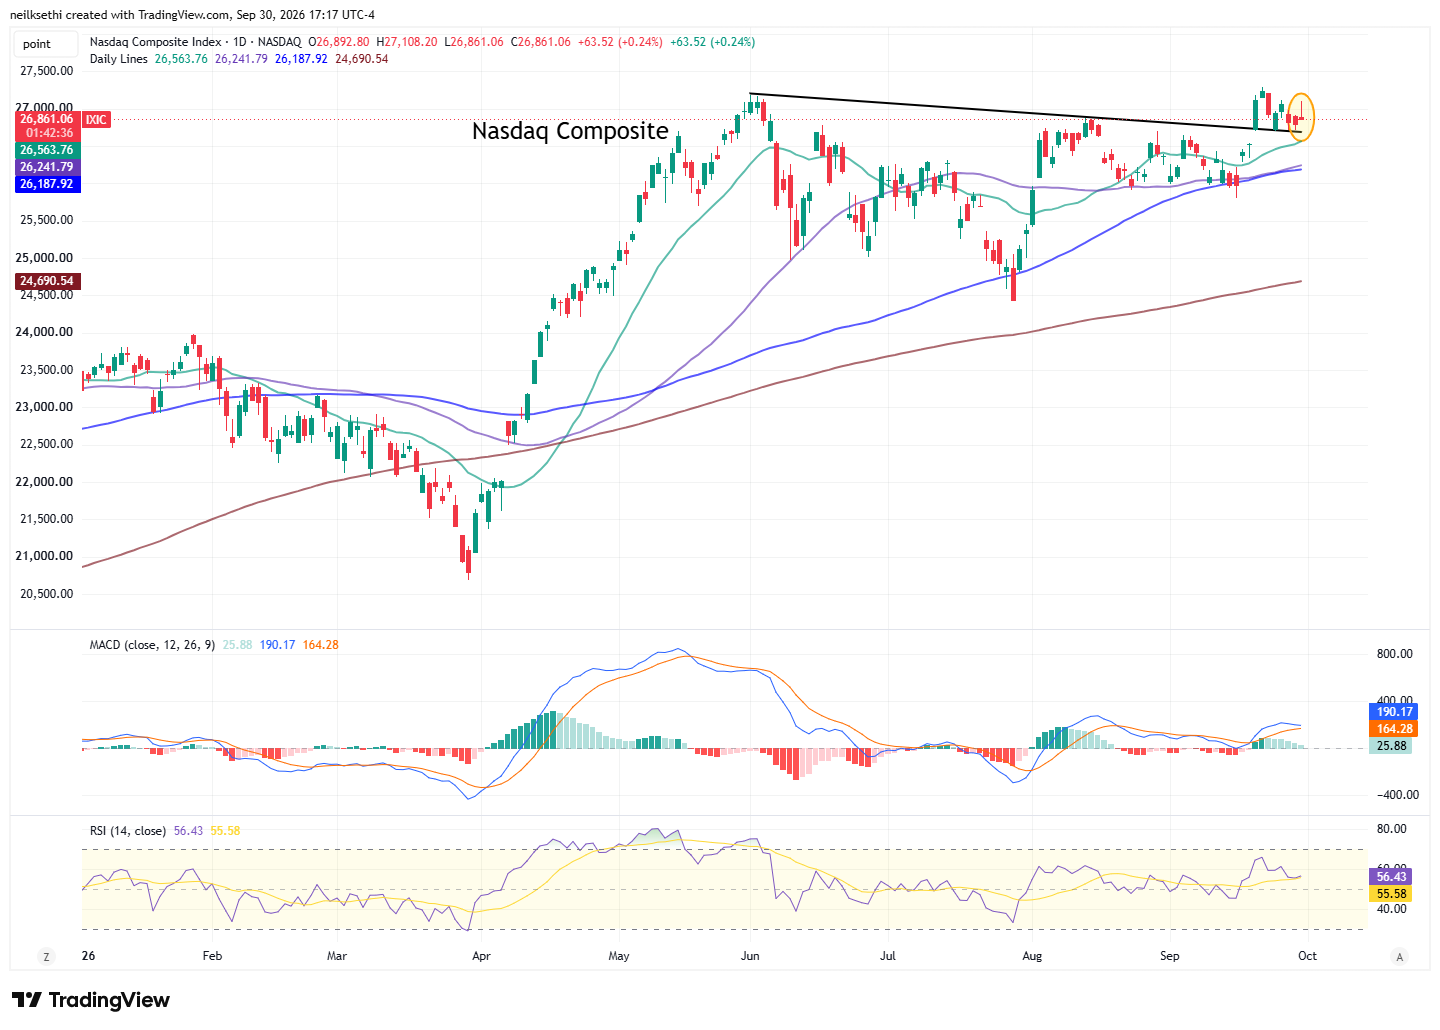
Nasdaq Composite continued its sideways drift just below all-time highs.
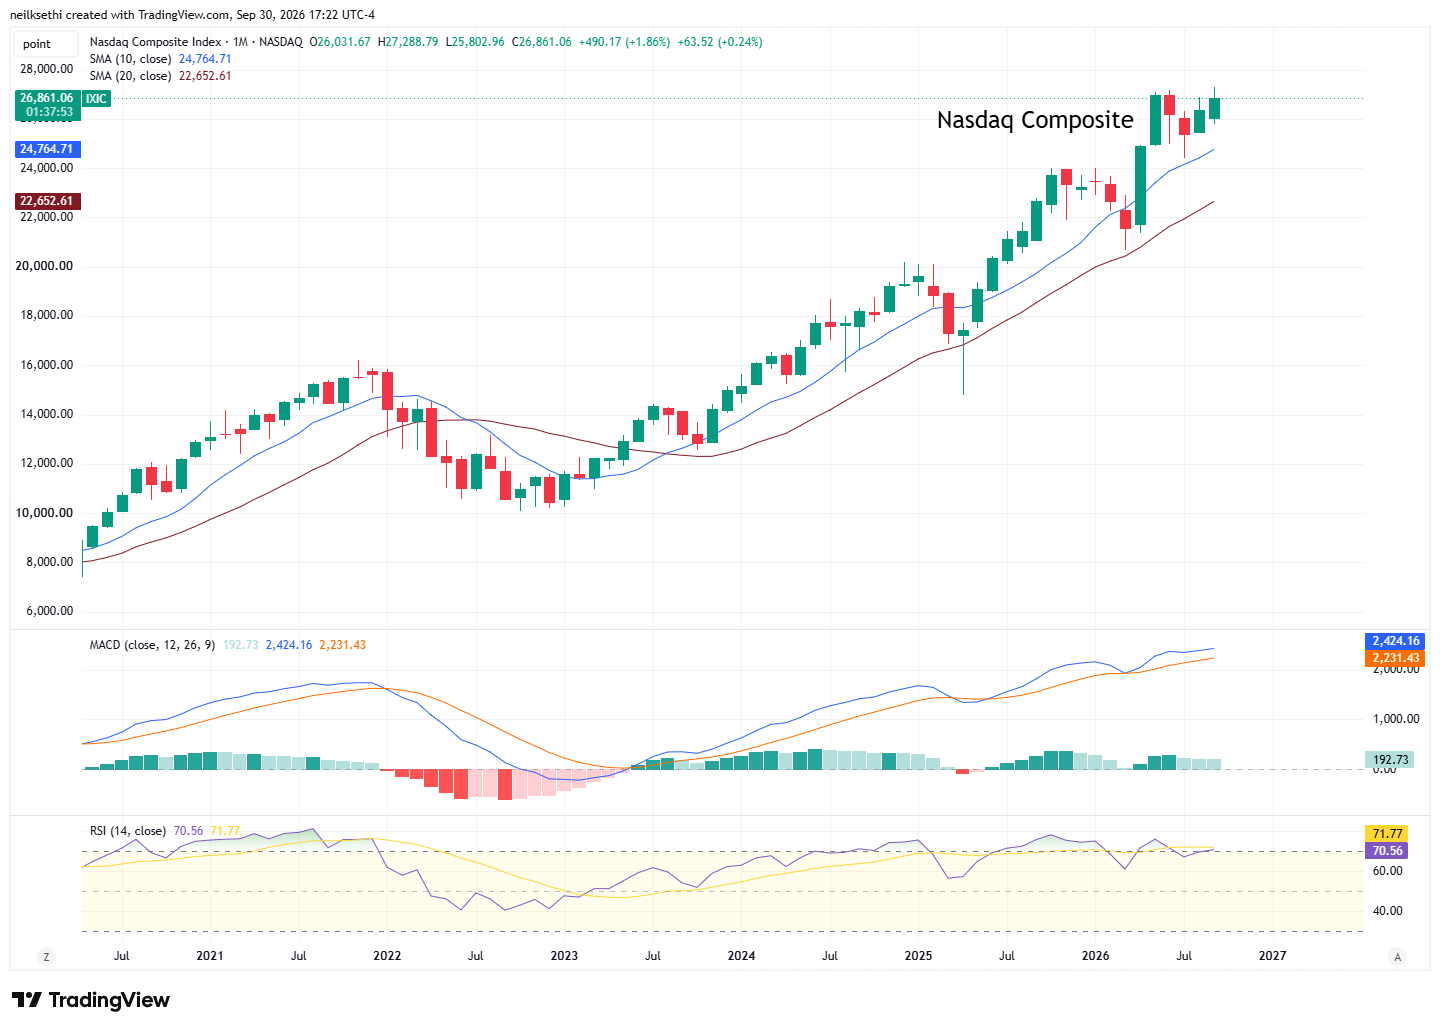
Monthly chart in very good shape.
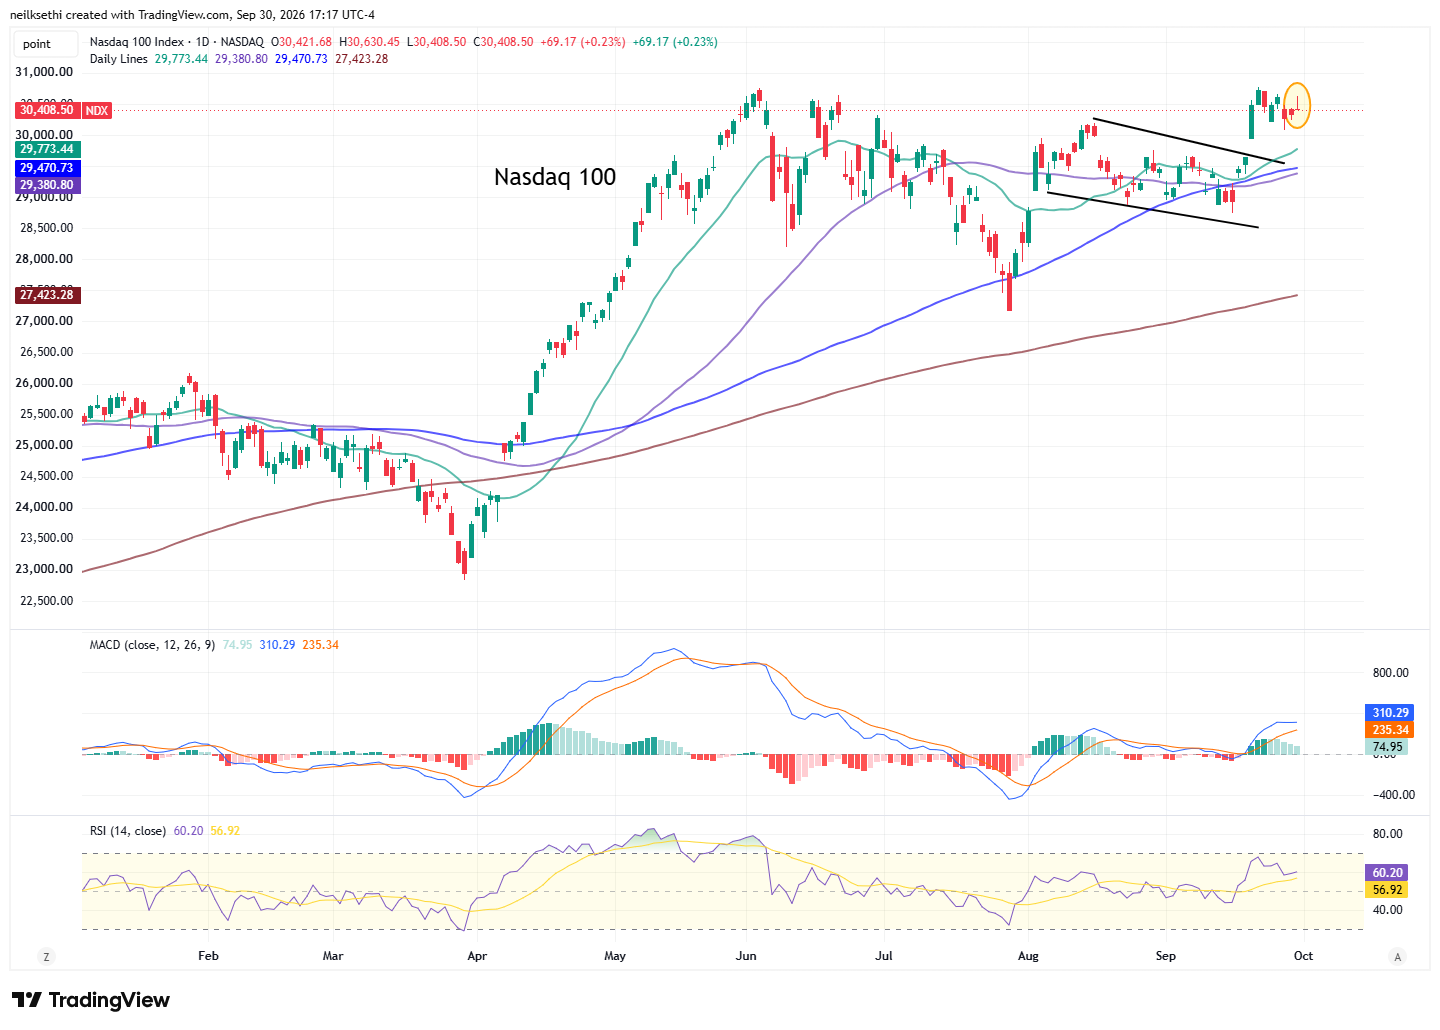
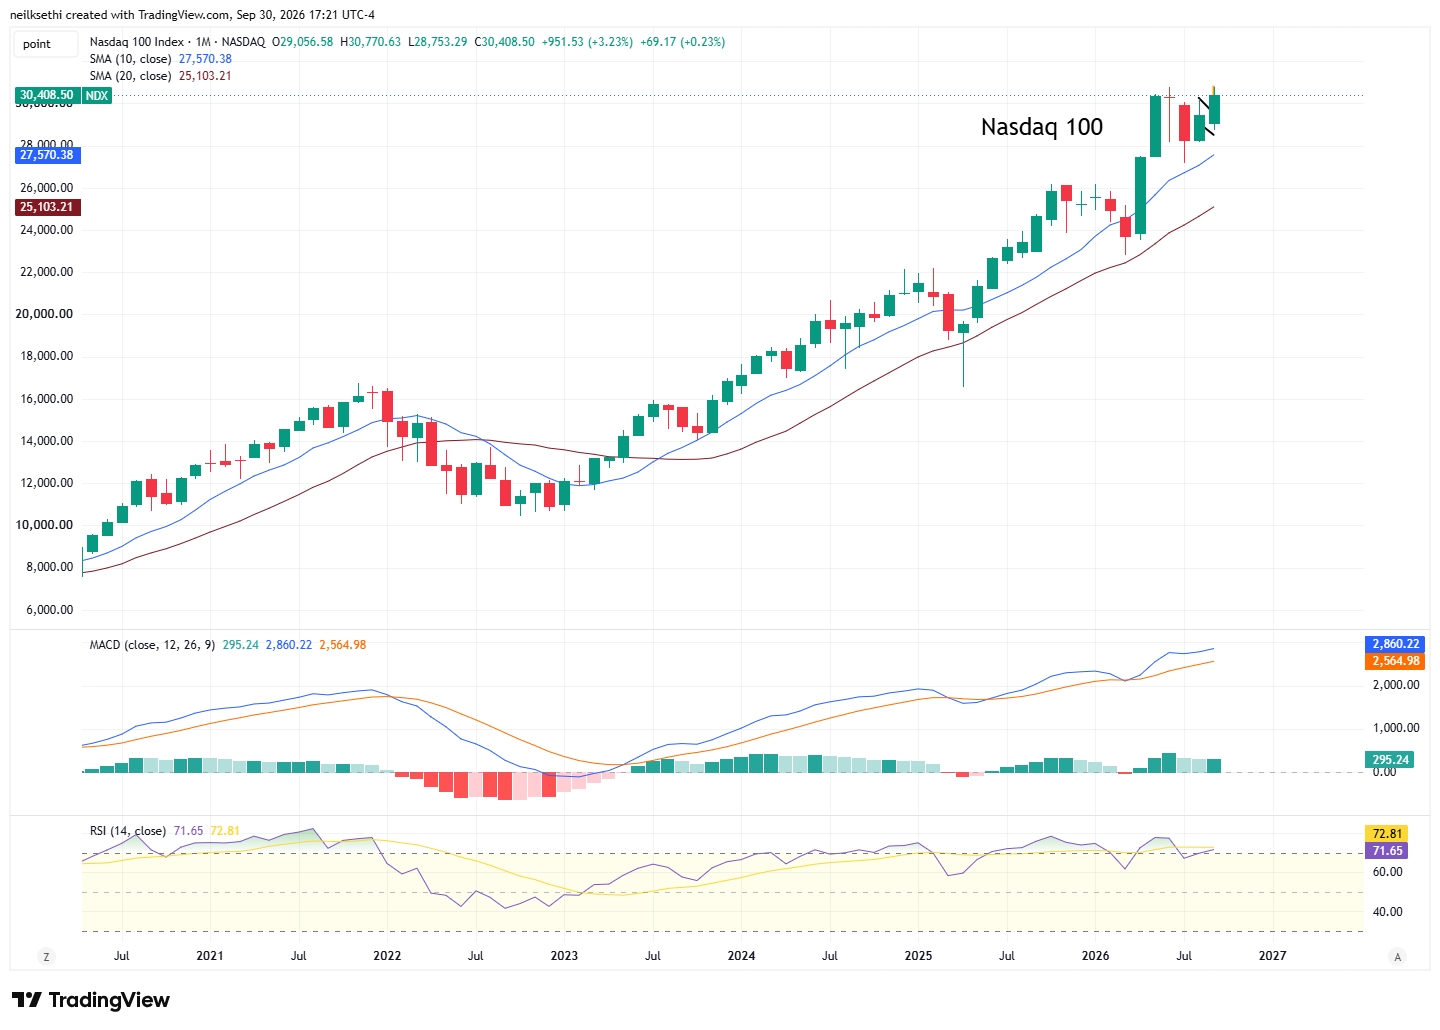
The Nasdaq-100 ($QQQ) also remains just below its all-time high. Daily MACD and RSI also positive here.
Monthly chart very solid.
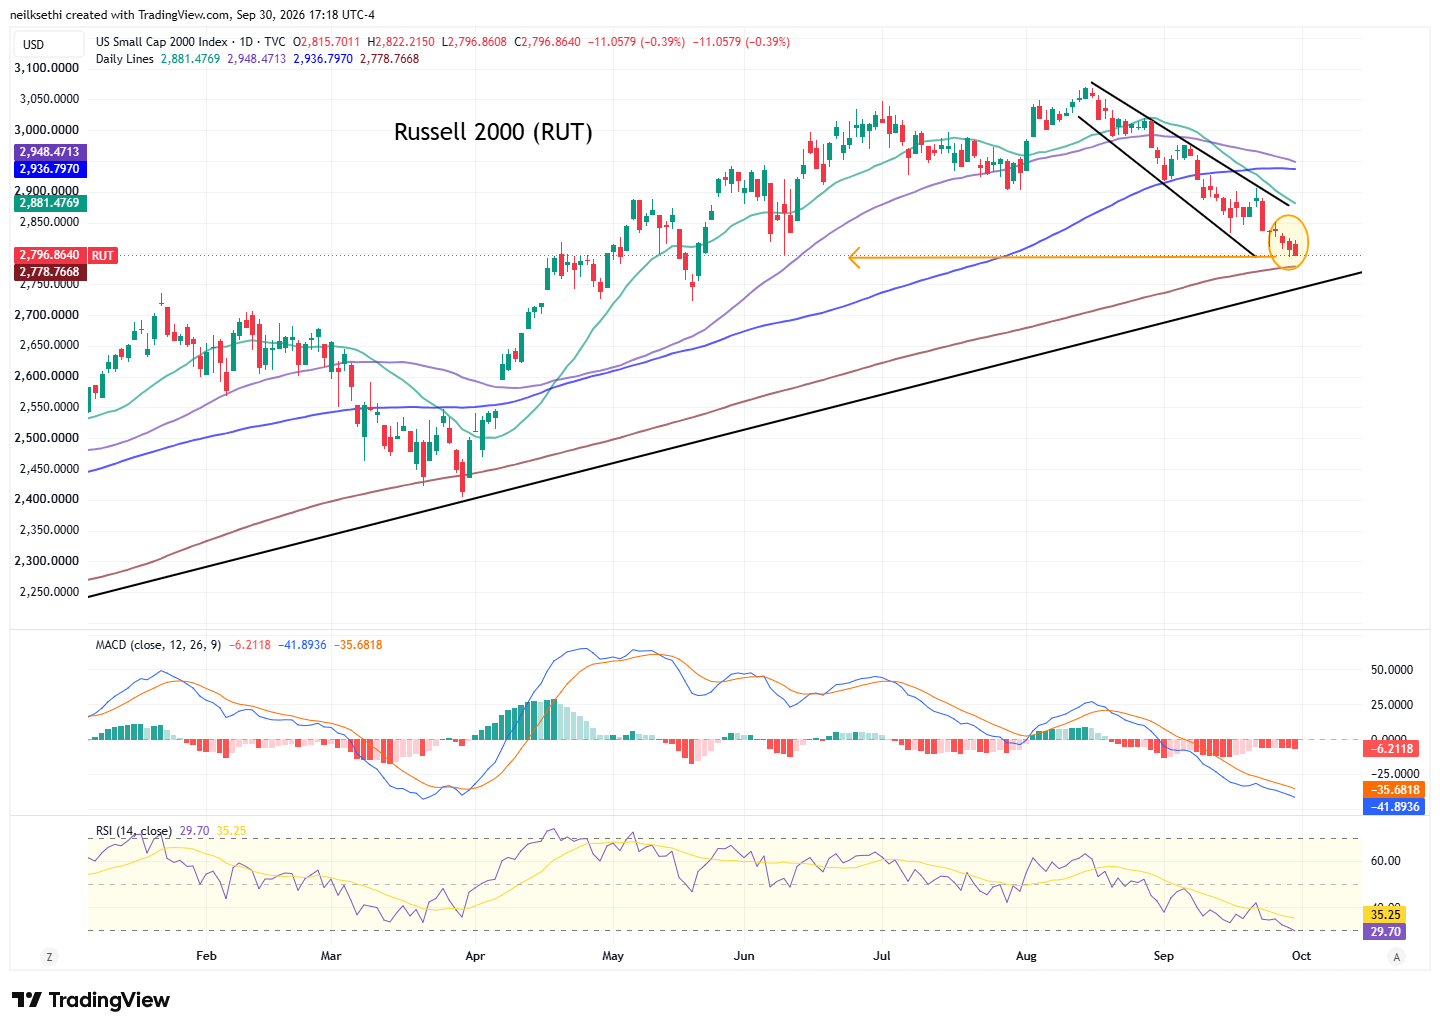
The Russell 2000 (RUT) I said at the end of August was “much more problematic,” and that remains the case as it fell to the lowest close since May. Its daily MACD remains in “go short” positioning, and the RSI is closing in on 30, the lowest since the post-liberation day low. Now very close to that test of the 200-DMA I mentioned two weeks ago.
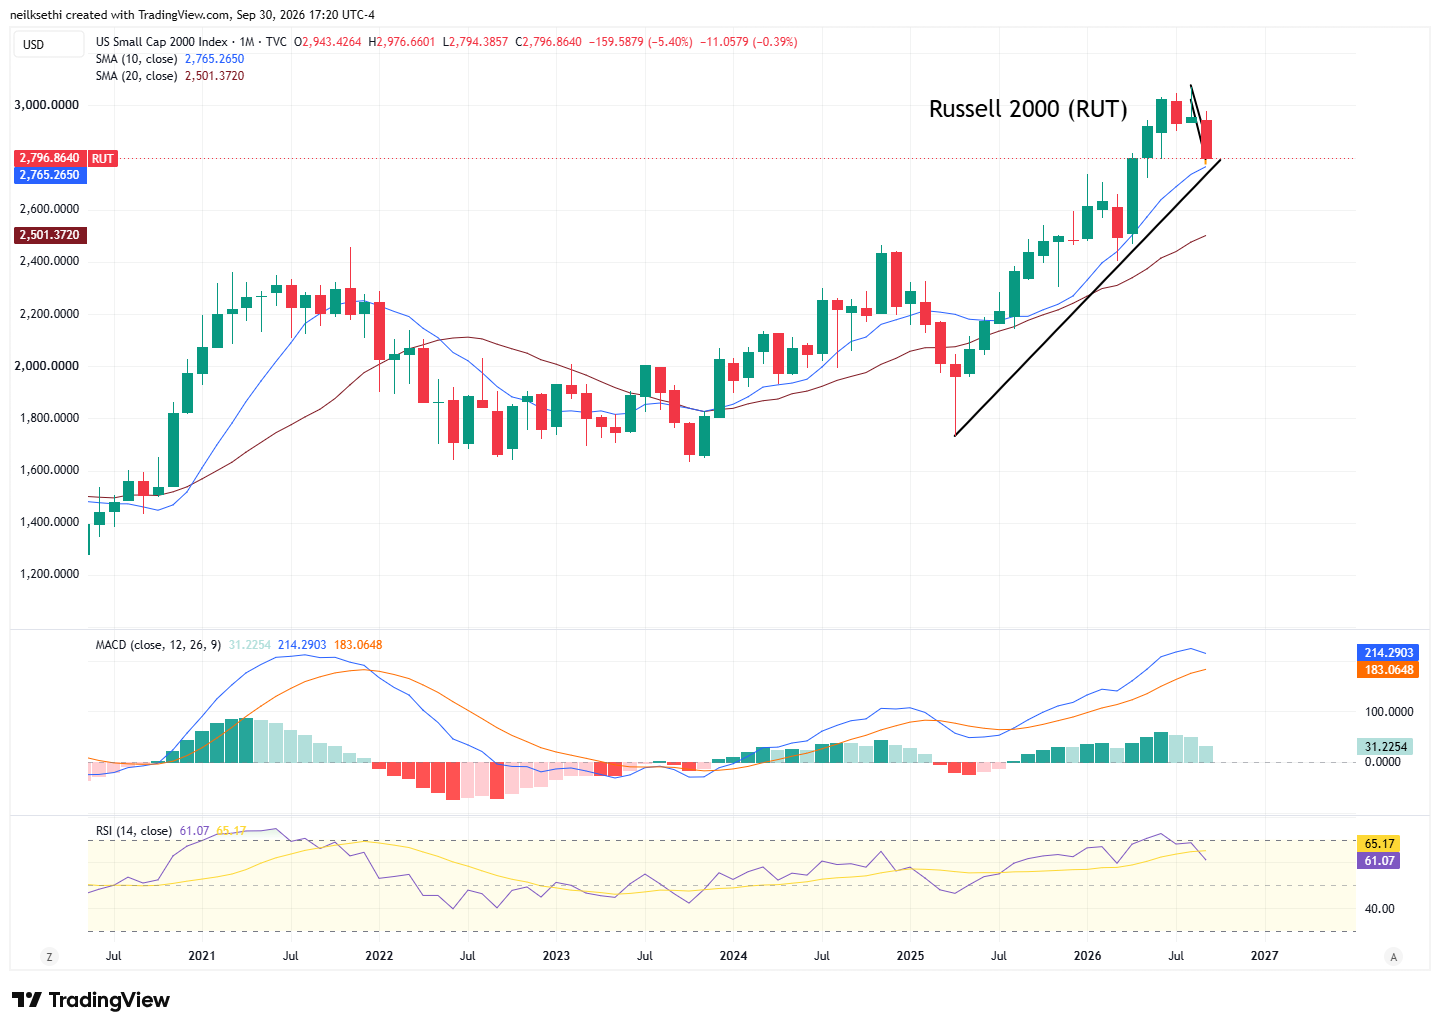
Monthly chart less bearish with the MACD remaining in a “go long” configuration and the RSI above 60 not yet making a lower low.
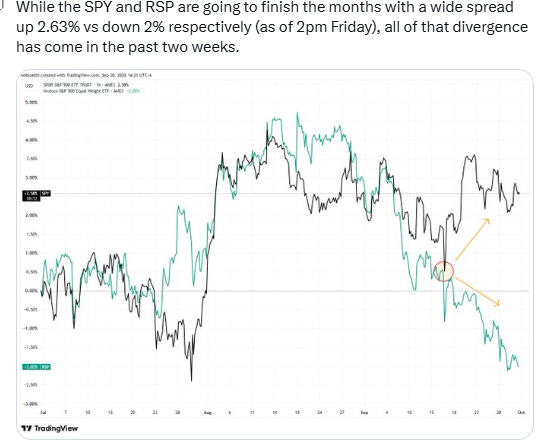
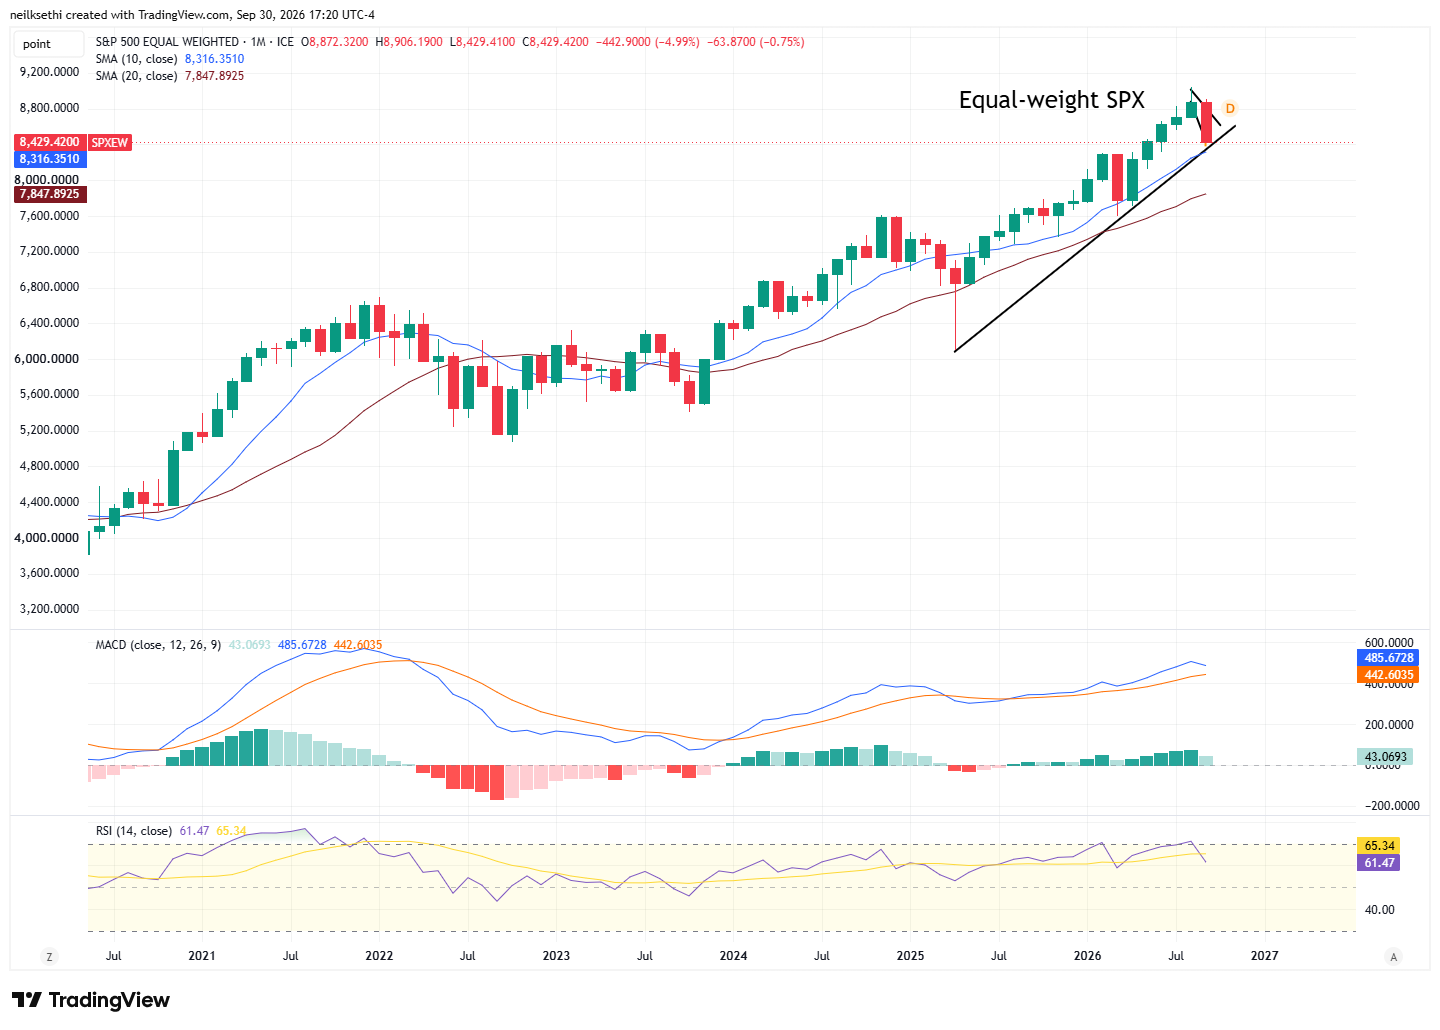
The equal-weighted SPX I said three weeks ago is “back to concerning.” I mentioned then “I did take off most of my holdings in ($RSP) for now. I’ll be looking for a tradeable bottom to form.” Like the RUT daily MACD and RSI are weak. Has a little more room to get there, but like the RUT that uptrend line/200-DMA area might be the place for a buy.
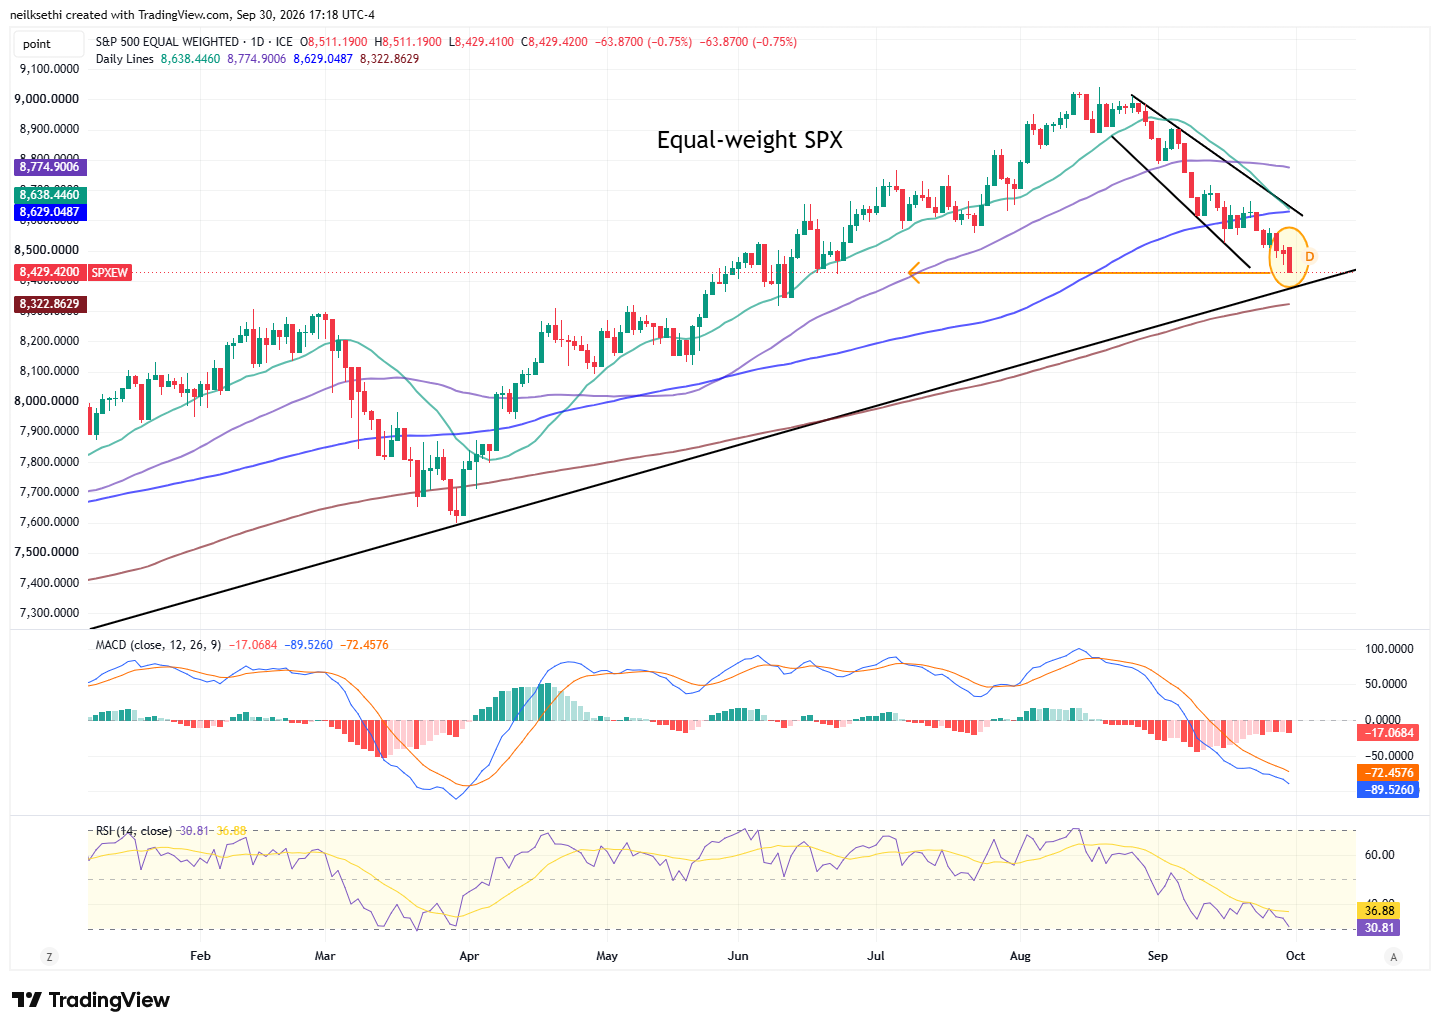
Monthly chart less bearish here as well.
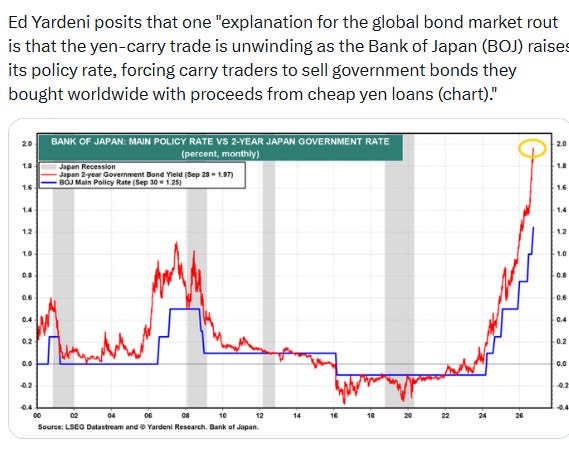
Treasury yields despite the tame inflation print rose across the curve led by the long end:
The 2-year Treasury rose 3 basis points (including the after-hours) a few basis points from the highest close since May 2024 on Monday (including after-hours).
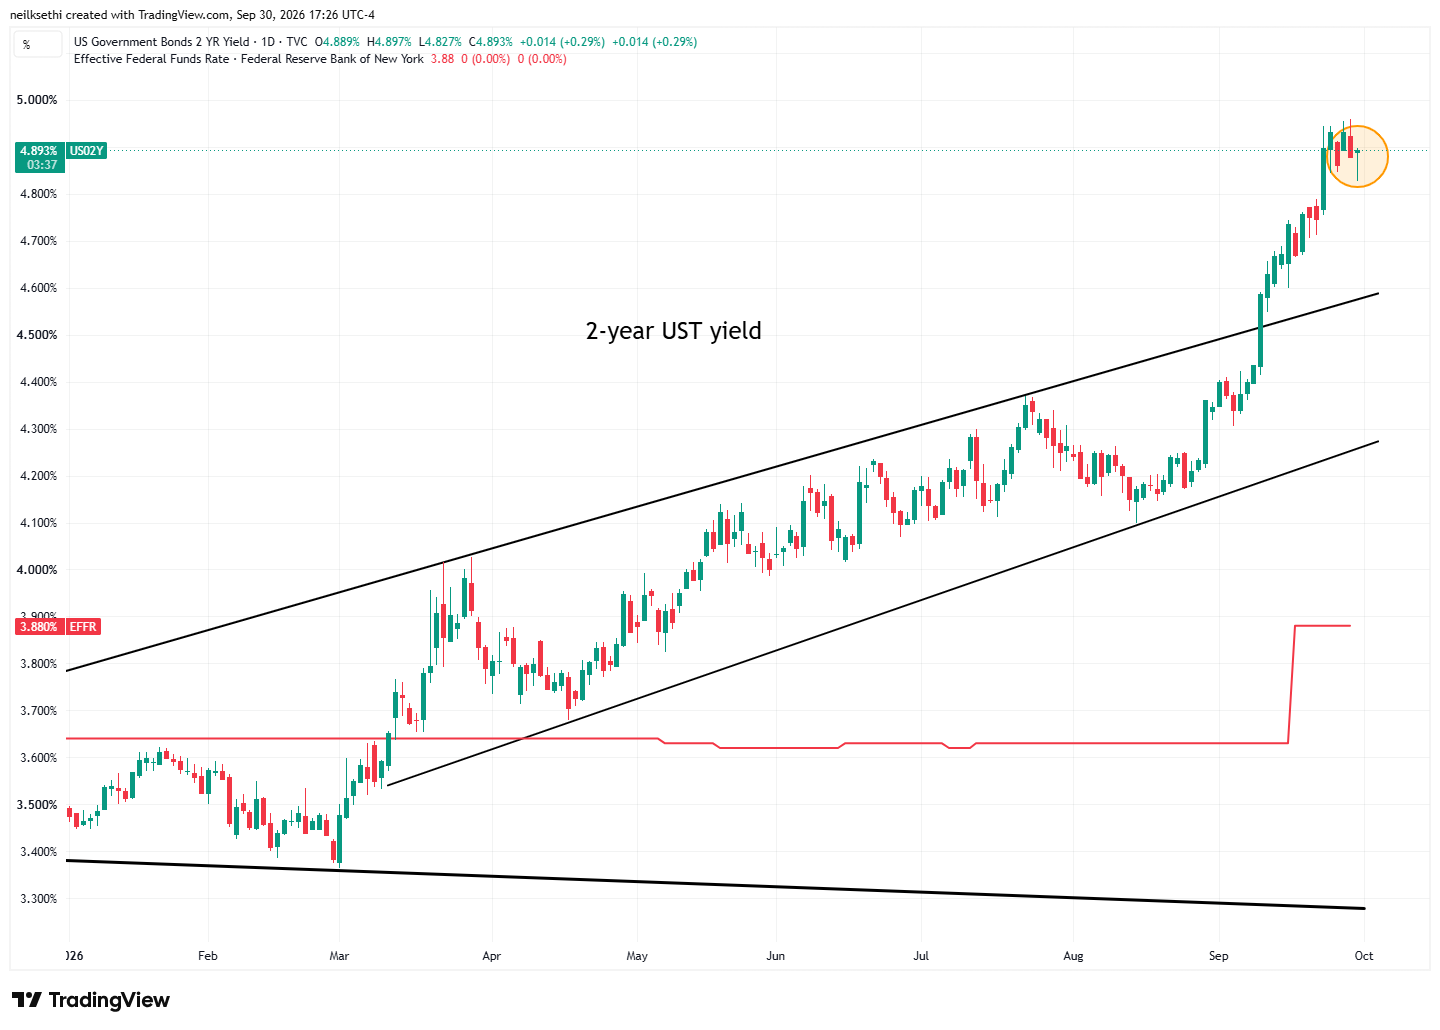
It ended up ~ 55 basis points for the month.
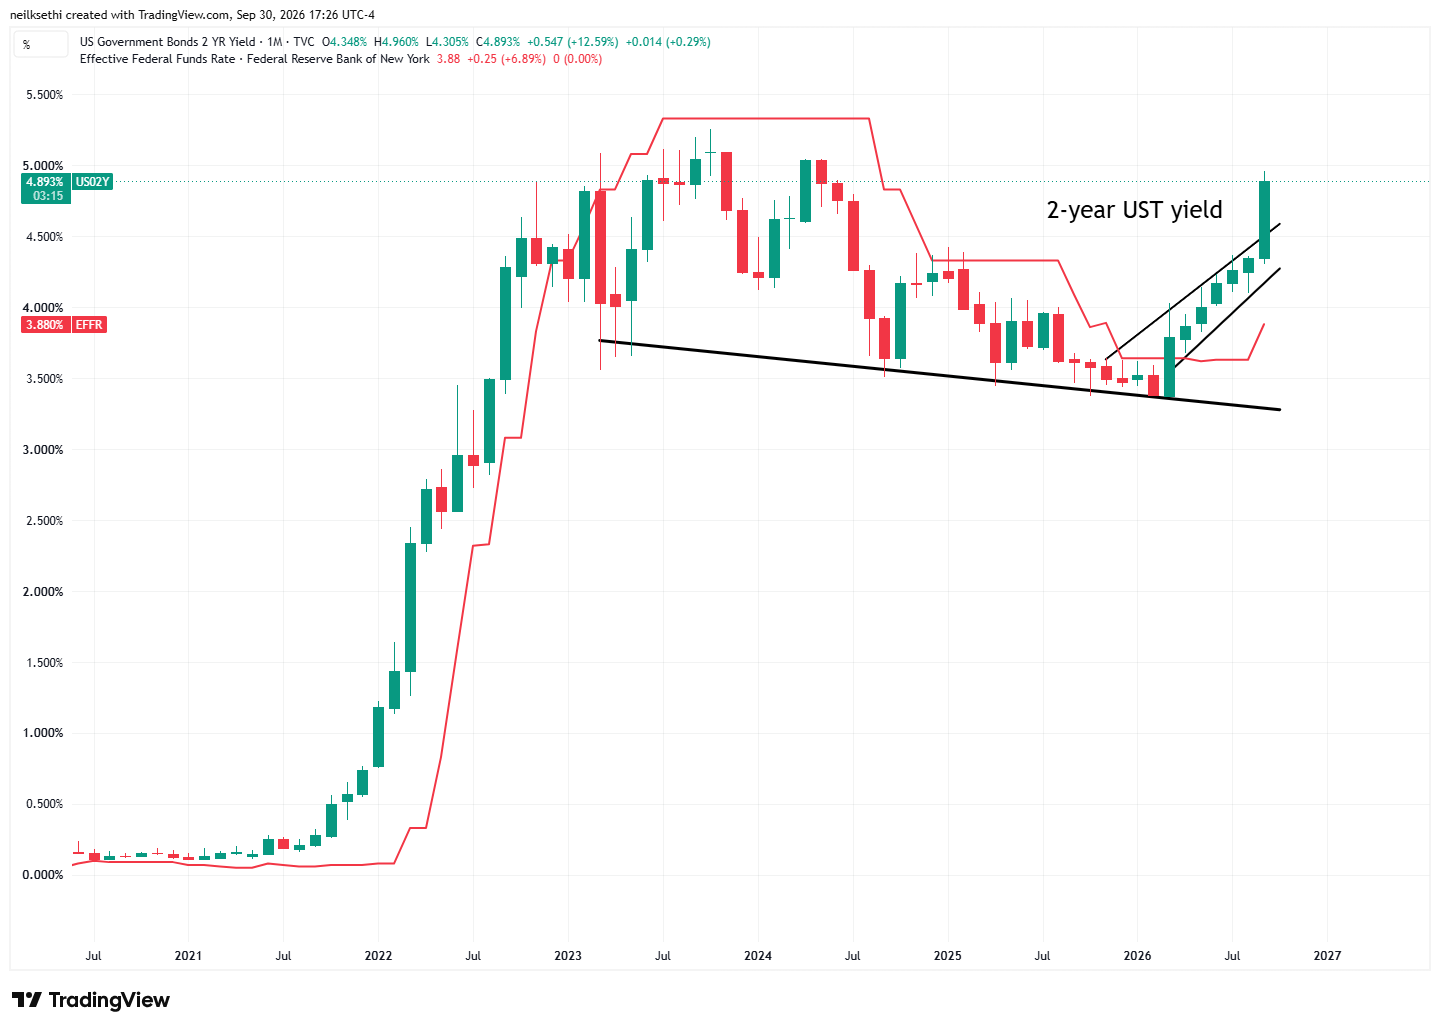
It is ~112 basis points above the Effective Fed Funds rate, so still screaming for (a few) more rate hikes.
In that regard, while we did see October rate hike bets soften to just a 37% chance of a hike (from 51% Tuesday), with now just a 30% chance of two hikes this year, the 2-year stayed elevated, as hikes through 2027 actually increased two basis points to 97 total. So the market just pushed the second 2026 hike into 2027.
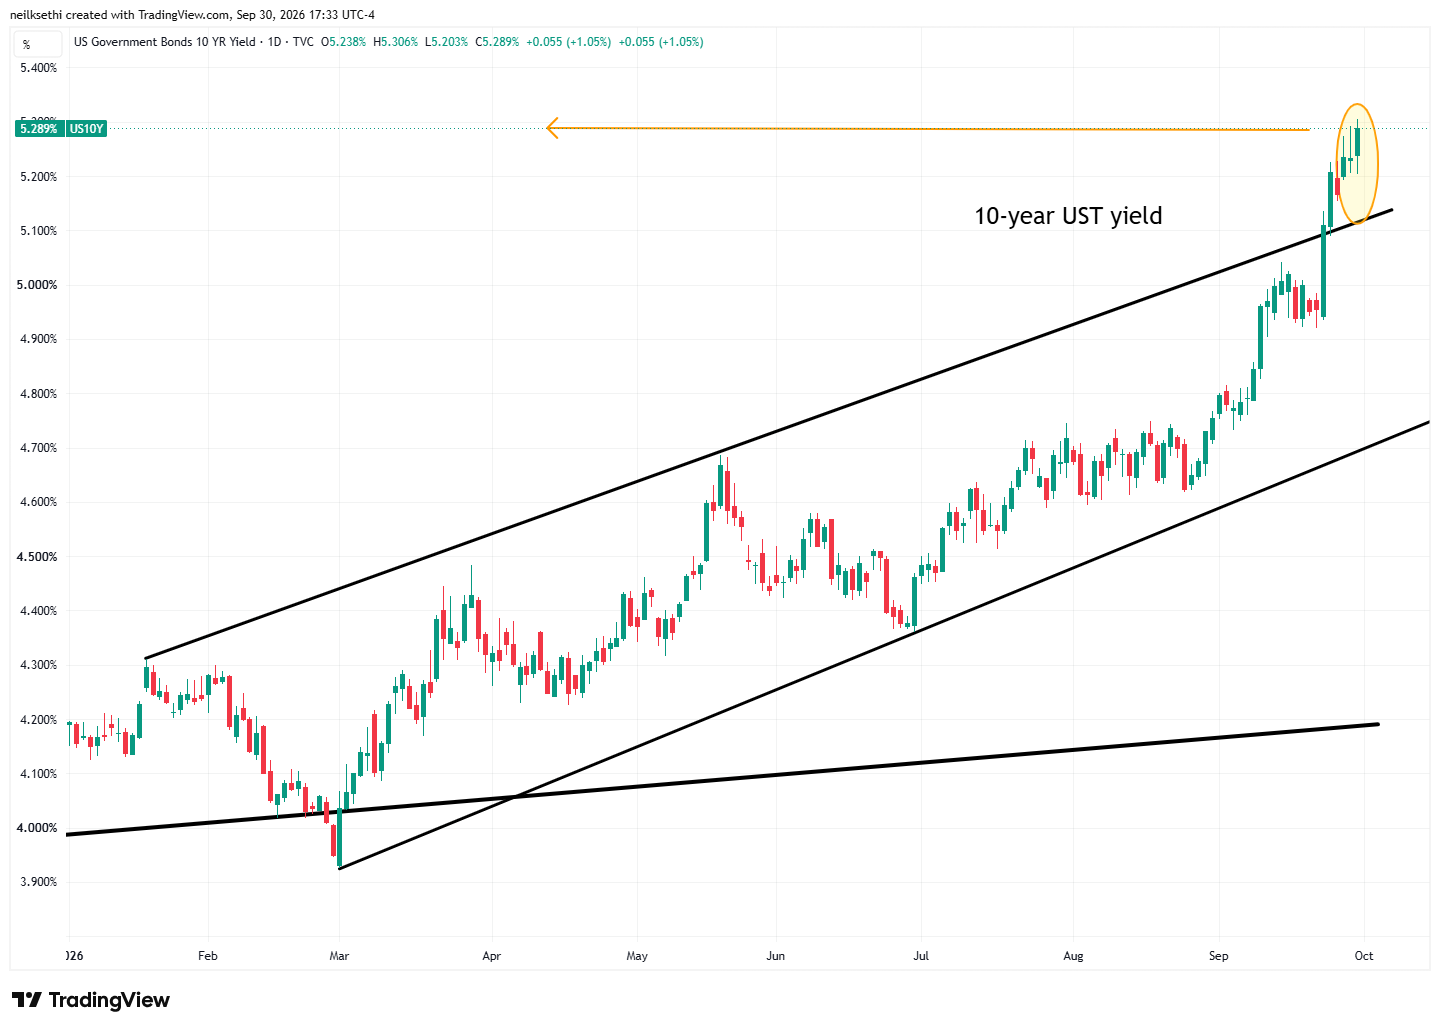
10-year yields up 5 basis points to 5.29% (including after-hours) now the highest since 2002.
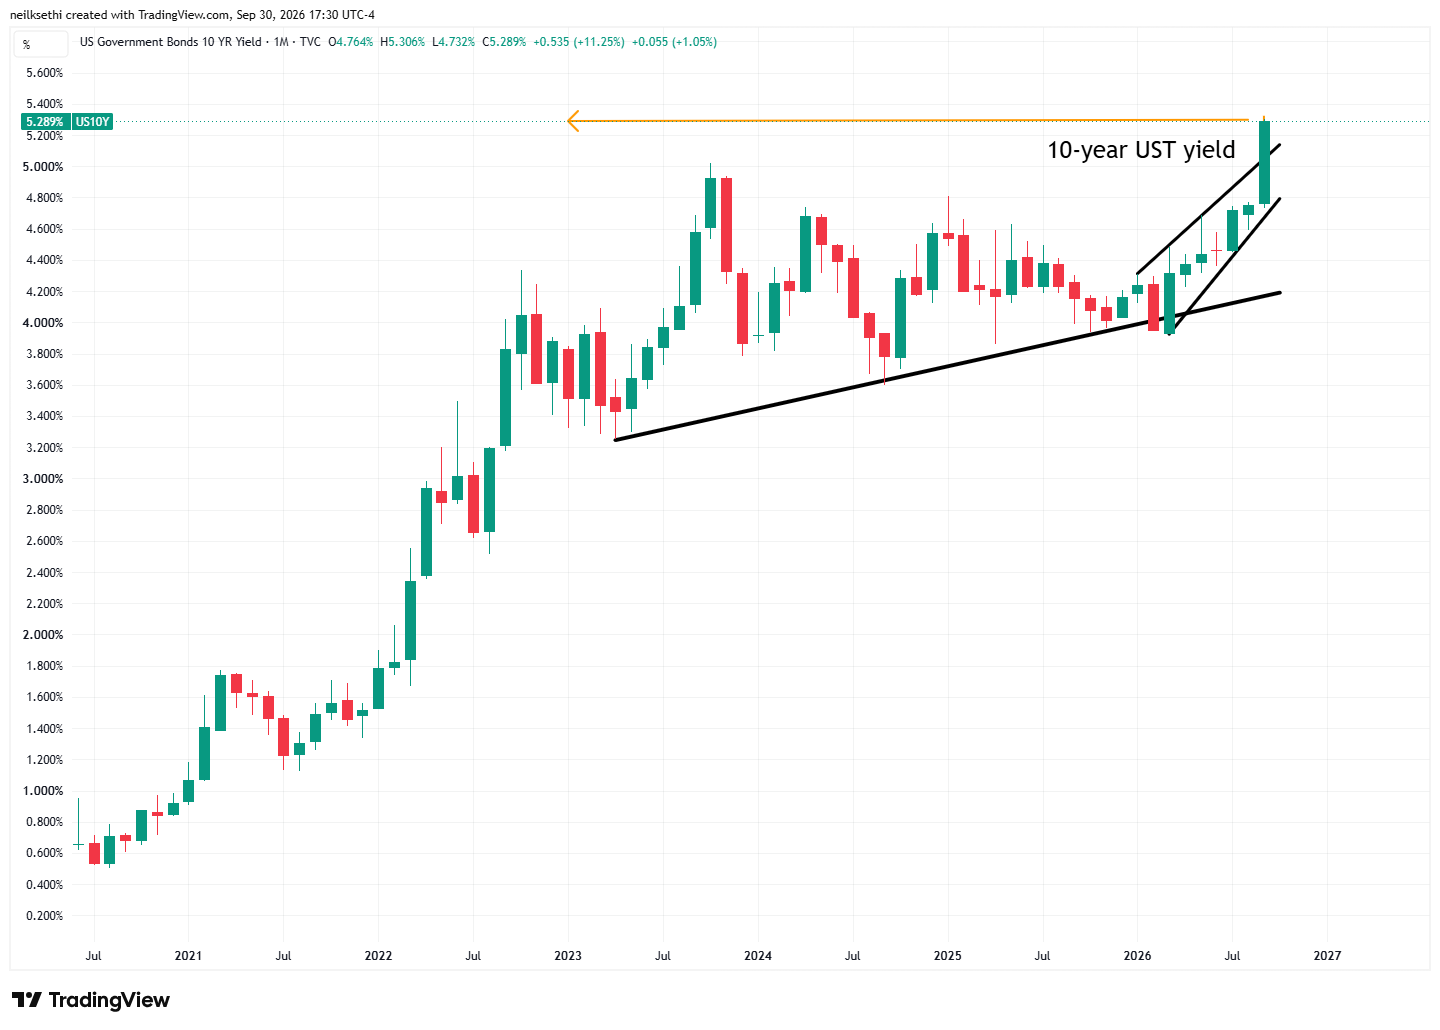
It was up 54 basis points on the month.
30-year yields up 6 basis points to 5.63%, the highest close since May 2002.
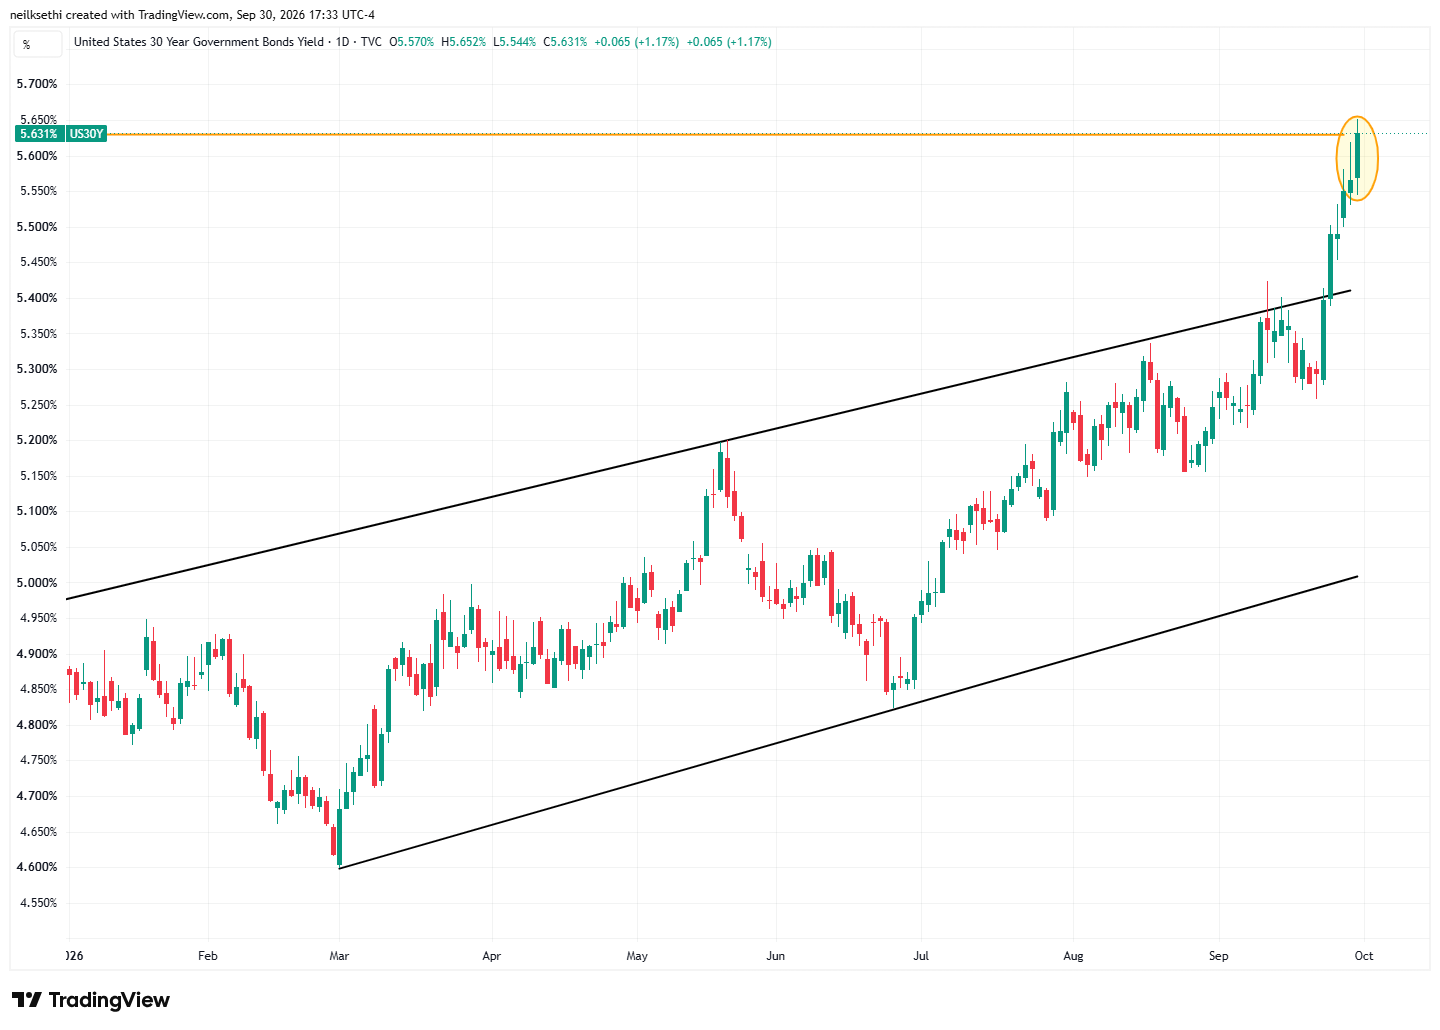
It was up 39 basis points on the month.
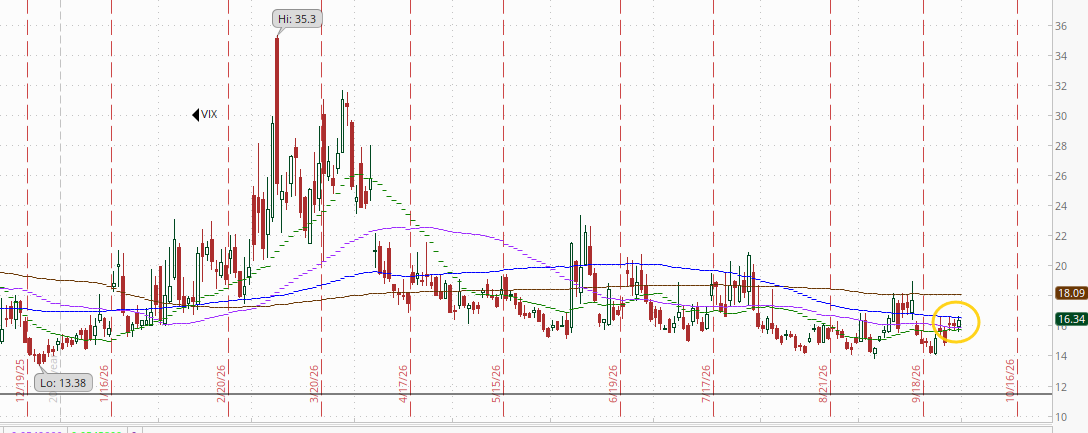
VIX remains remarkably quiescent at 16.3. That’s consistent with ~1.02% average daily moves in the SPX over the next 30 days.
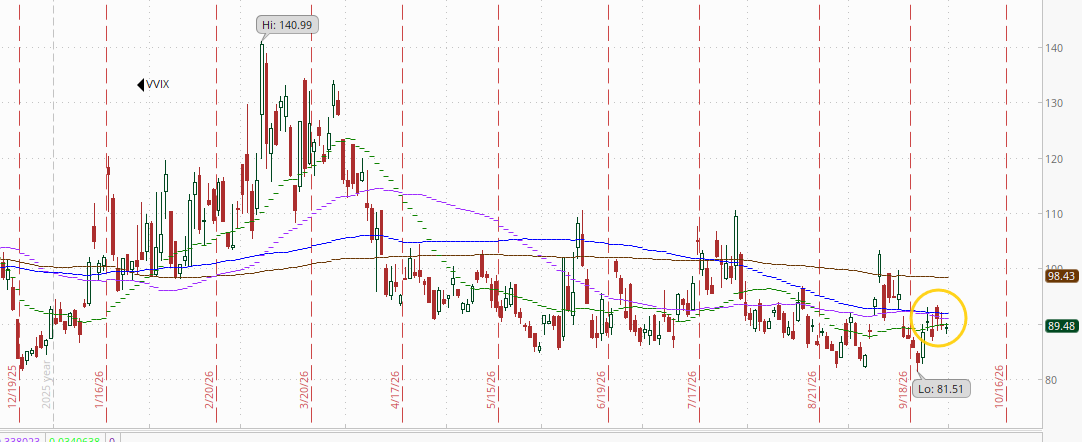
The VVIX (VIX of the VIX) eased to 89.5, also remaining very subdued.
The current level is consistent with “moderate” daily moves in the VIX over the next 30 days (historically, normal is 80-100). Above 100 is the level flagged by Charlie McElligott as indicating higher stress.
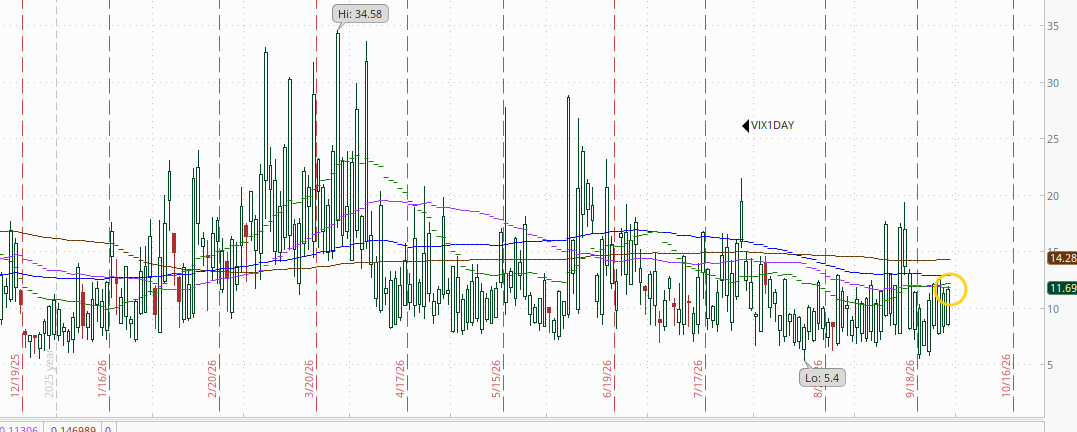
1-day VIX little changed at 11.7. The current reading isconsistent with a move of 0.75% in the SPX next session. This should move higher tomorrow with NFP Friday.
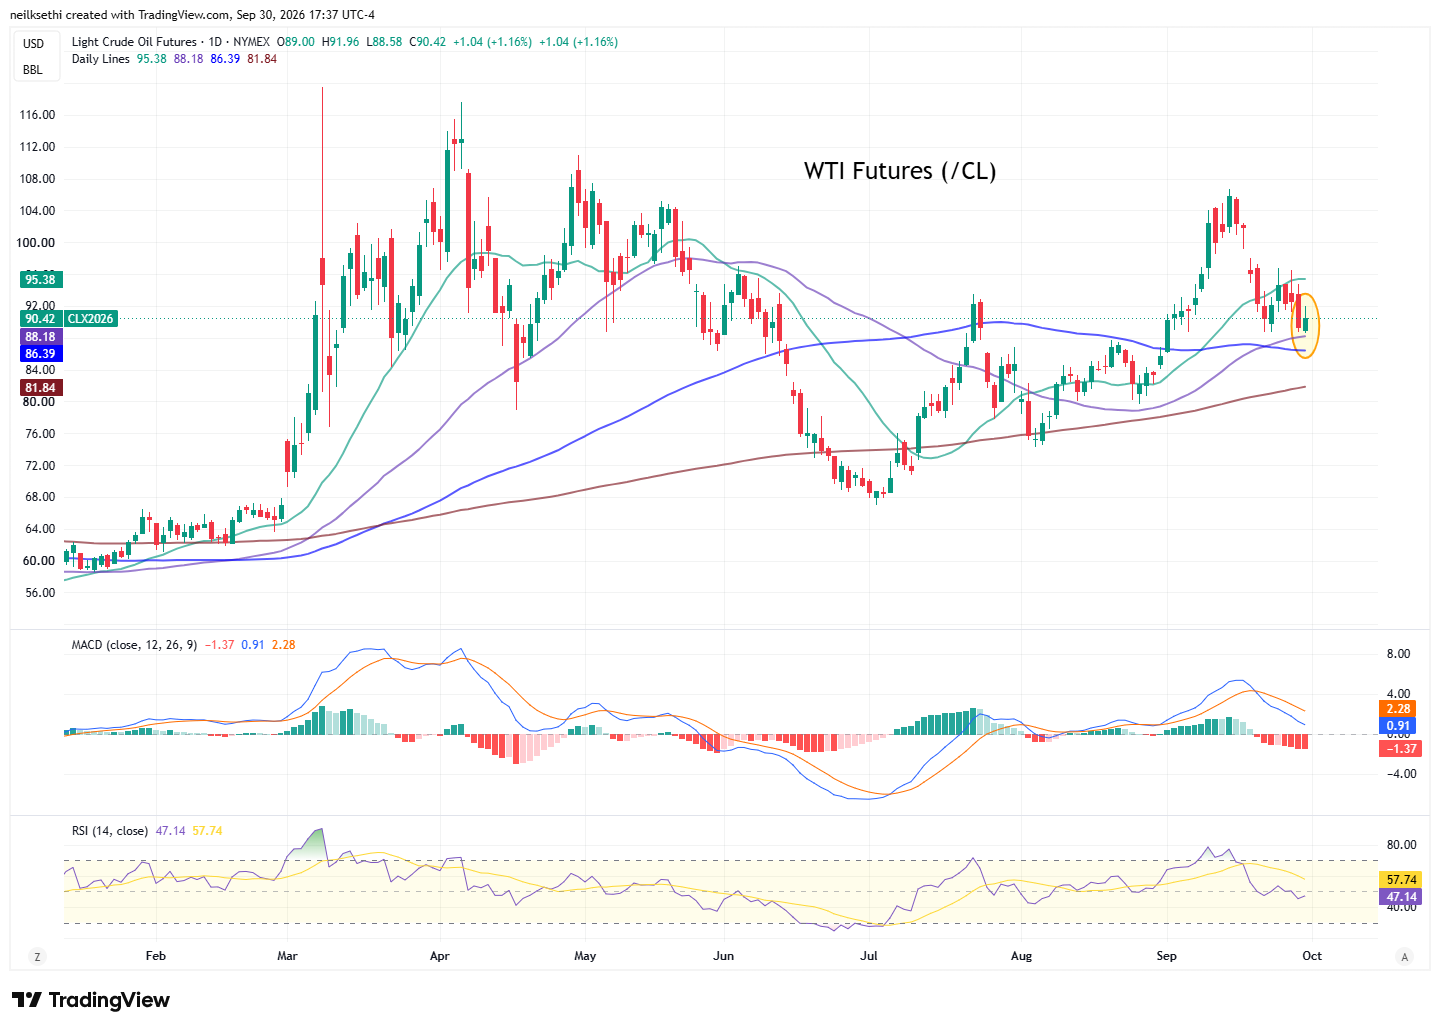
WTI futures (/CL) up around 1% holding the 50-DMA.
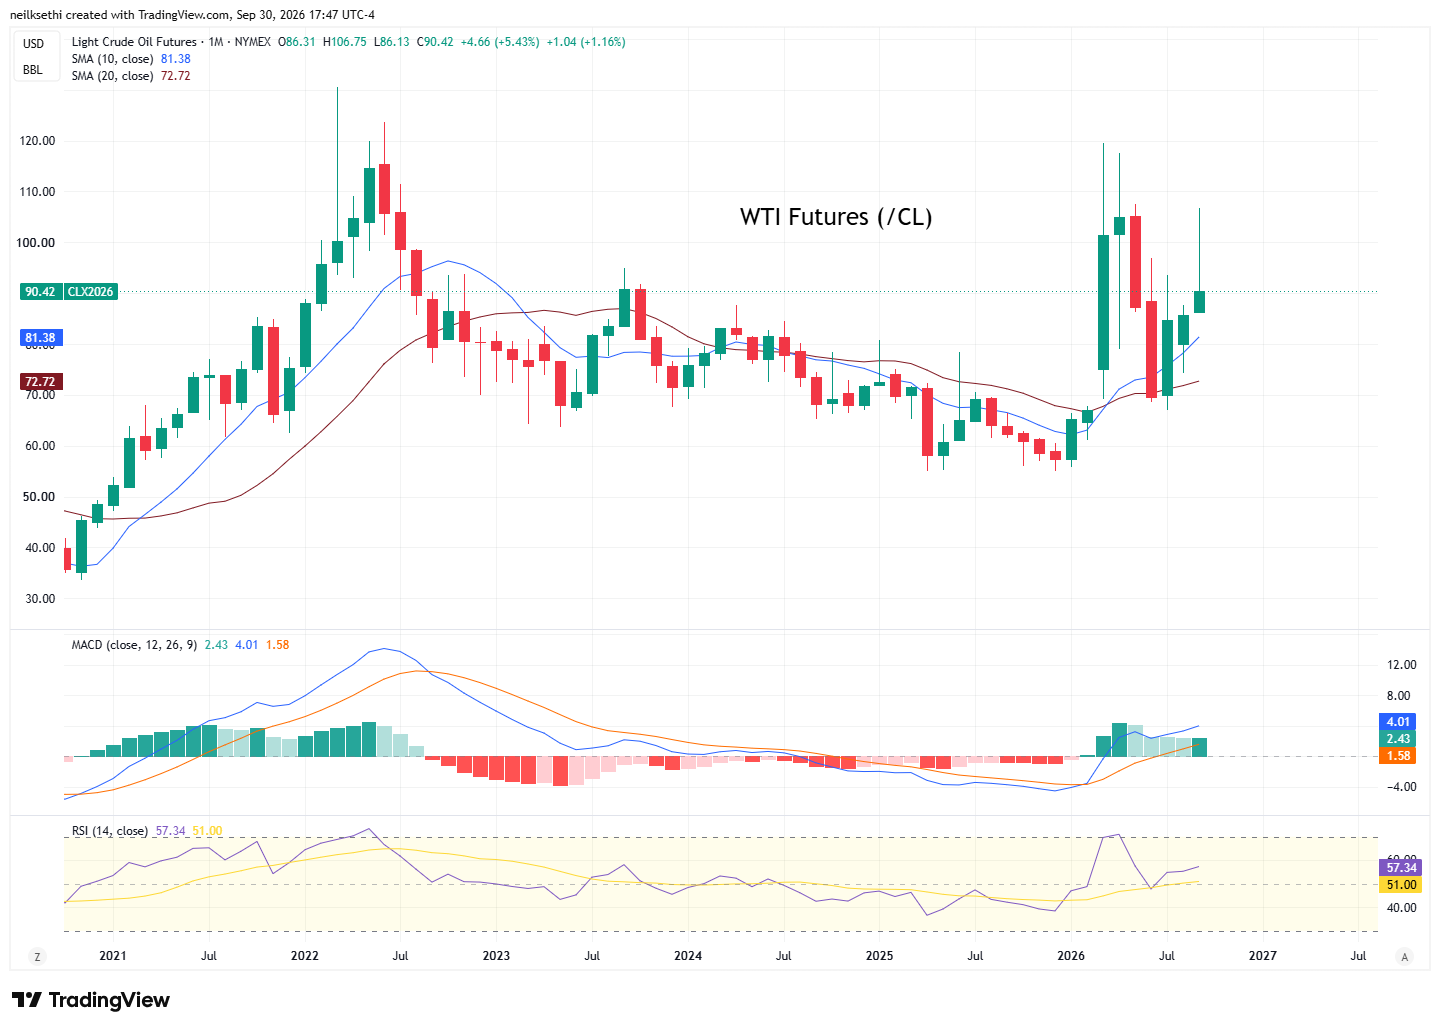
Basically just been in a big monthly trading range since the start of the Iran conflict.
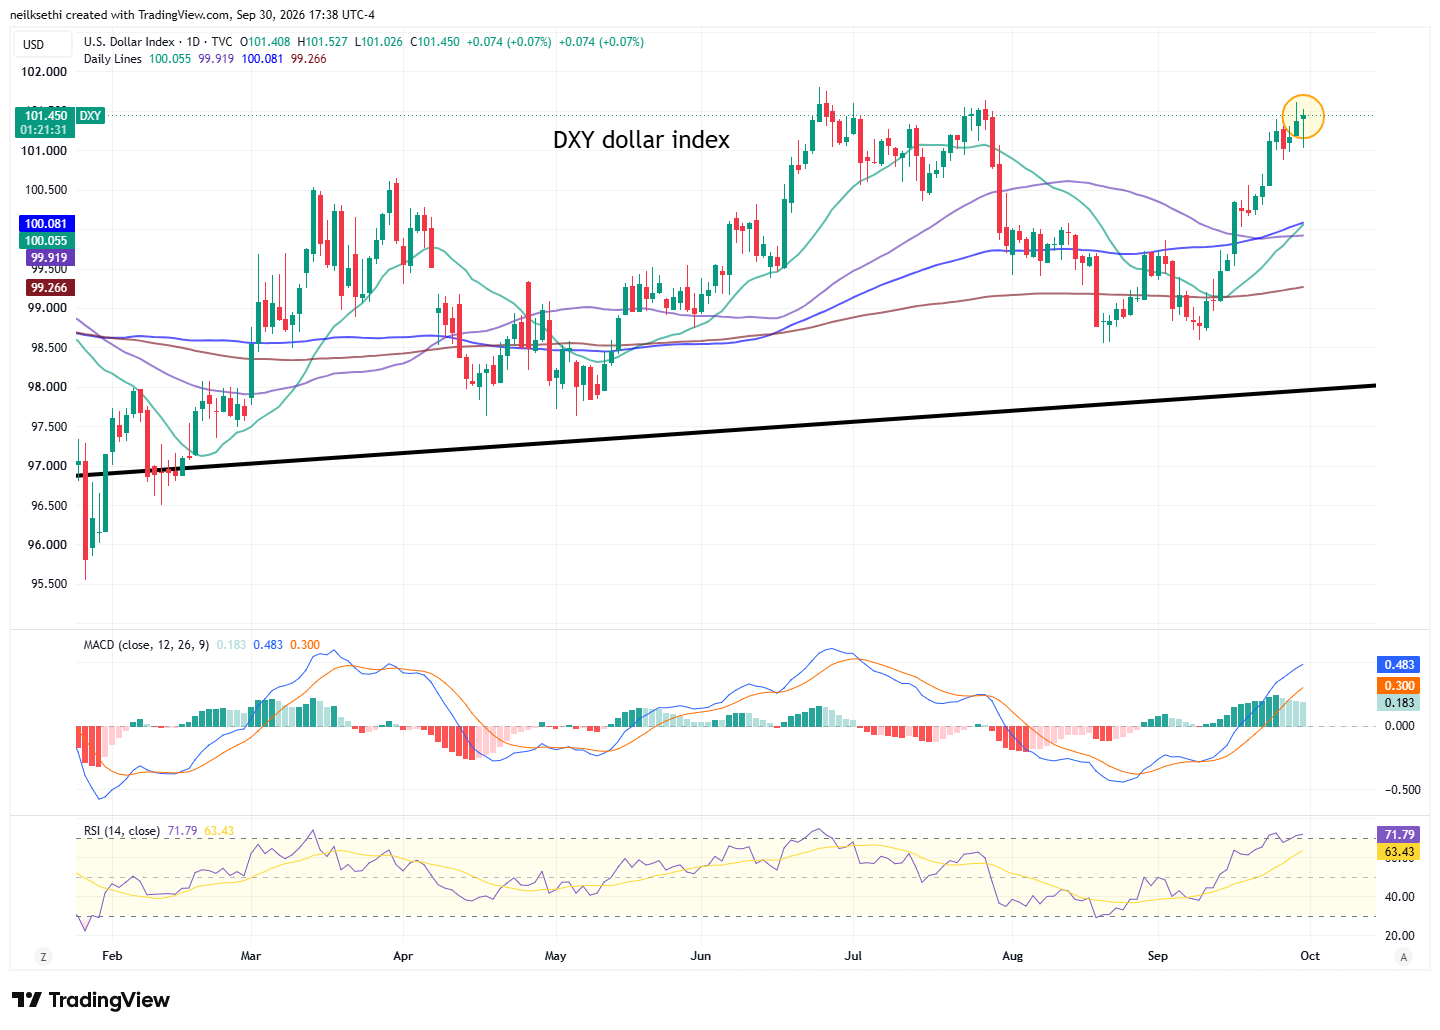
The DXY dollar index (which is fixed weighted with a heavy (57%) weighting vs the euro), pressed higher once again now just below the highs of the year.
As I mentioned two weeks ago “The daily MACD remains positive and the RSI is above 60 so it continues to have strong technical support.”
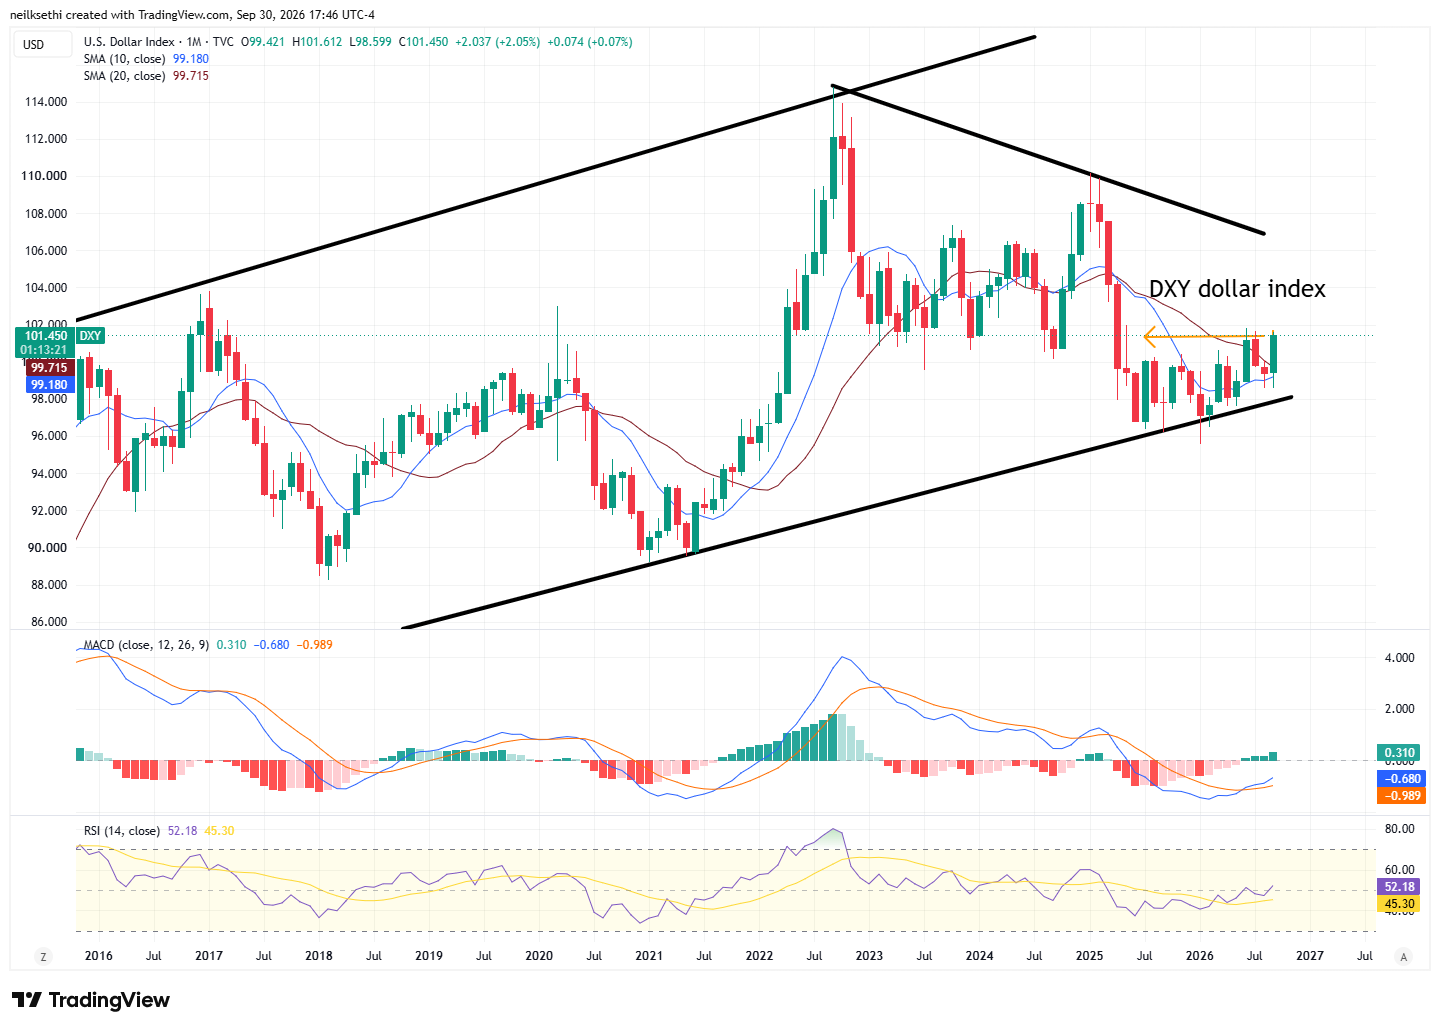
Monthly chart continues to look positive. Highest monthly close since March.
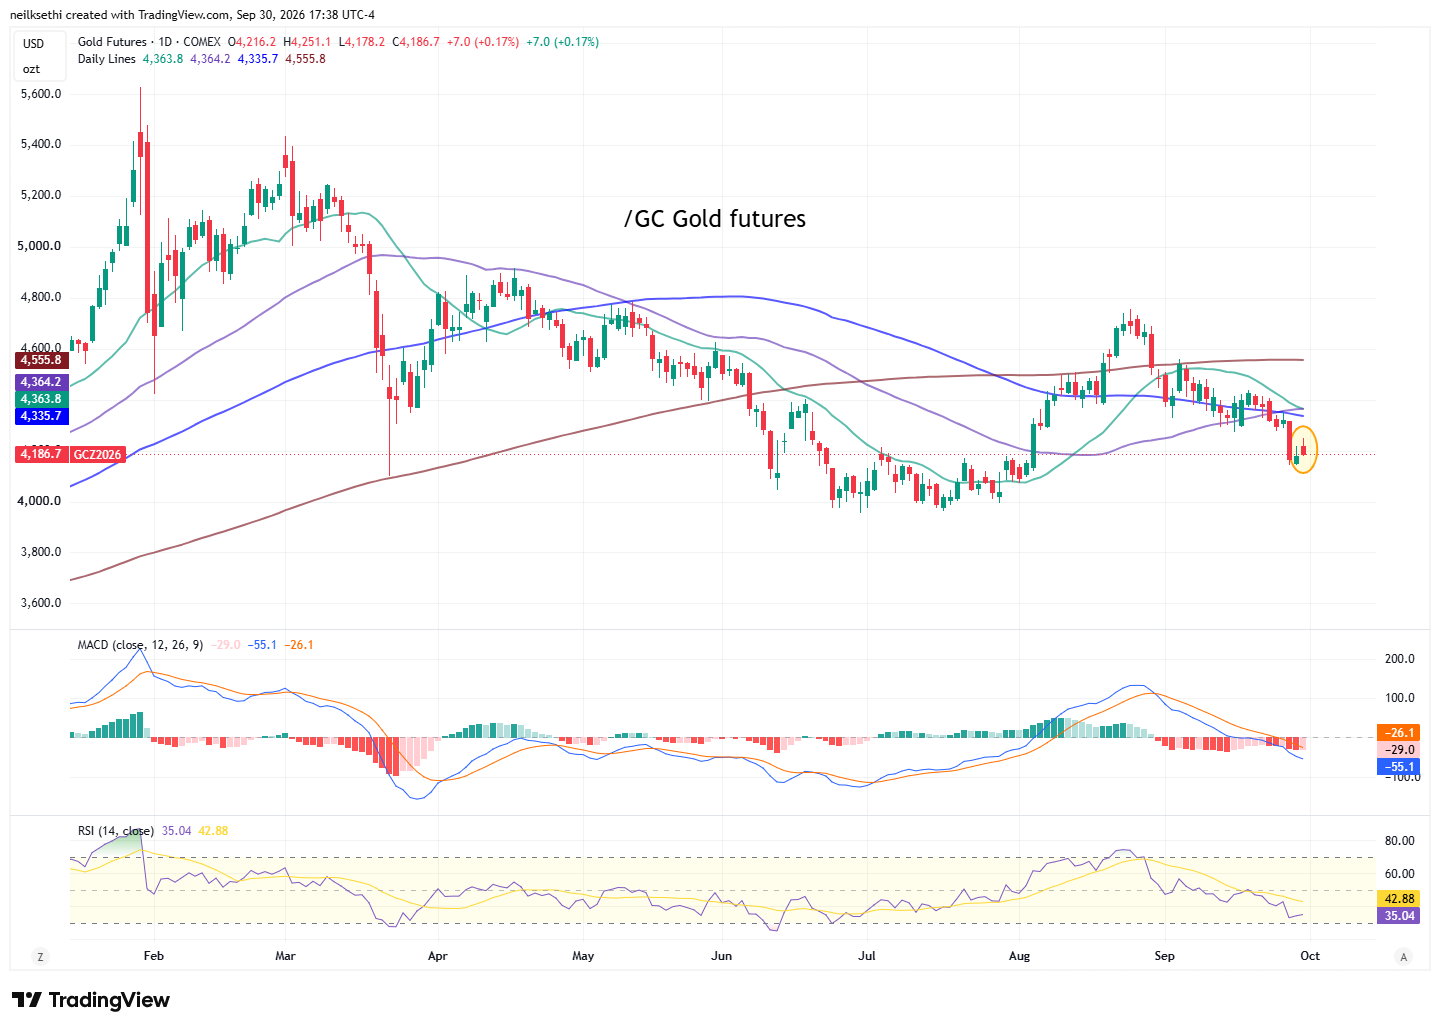
Gold futures (/GC) continue to stabilize. The daily MACD remains negative and the RSI is under 40 so it’s going to take some time.
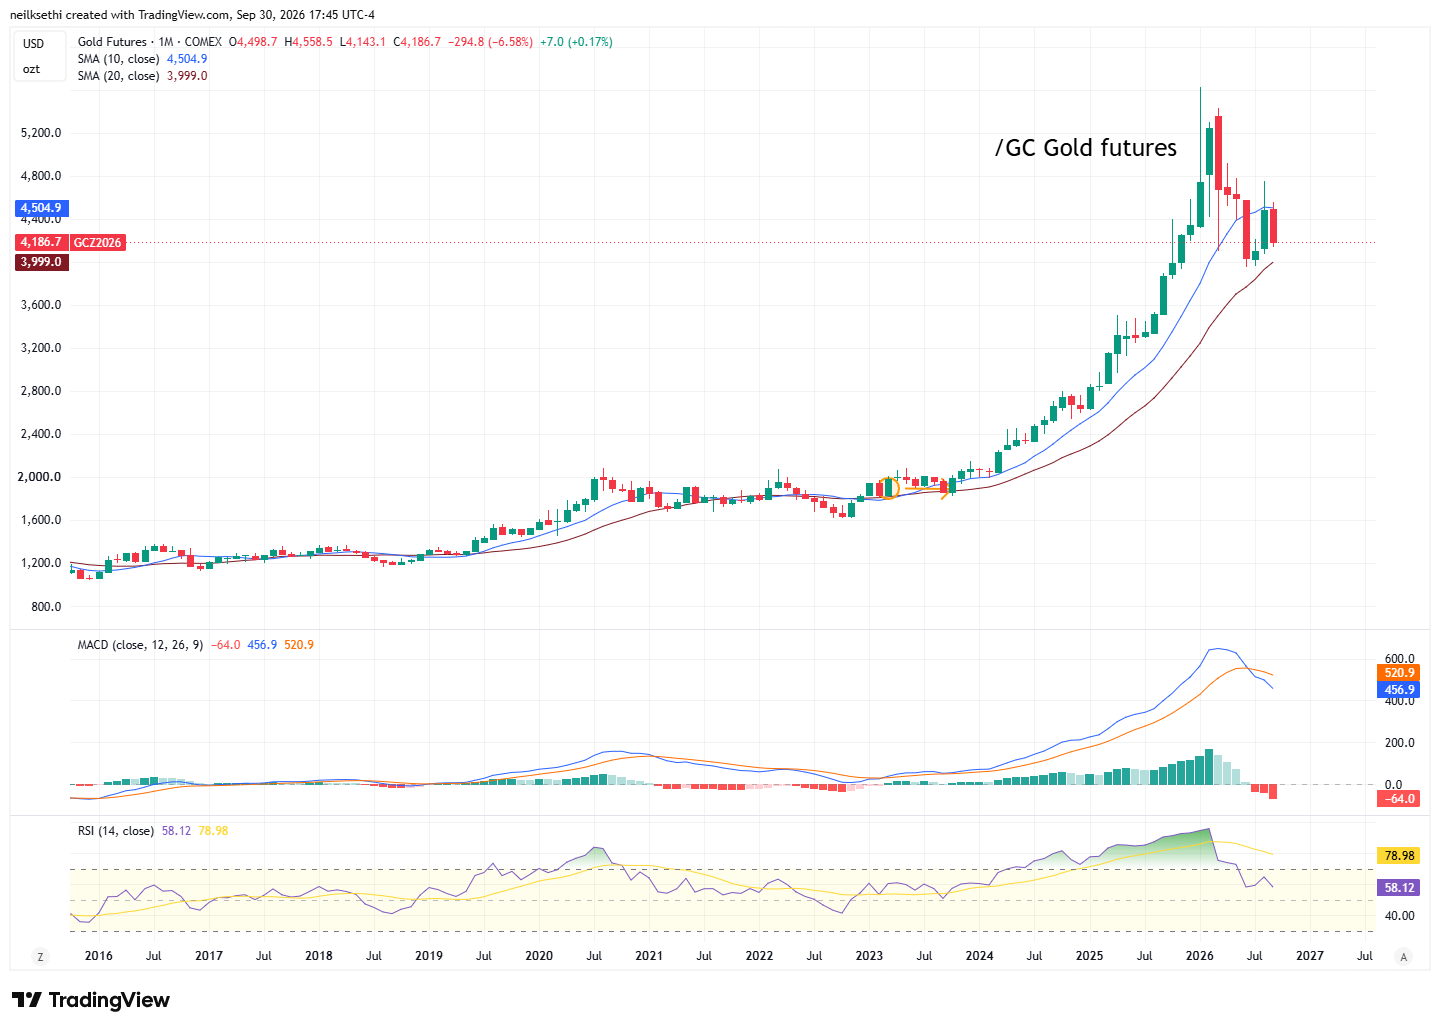
Monthly chart remains weak, capped by 10-month moving average (MMA) with negative monthly MACD although RSI remains above 50.
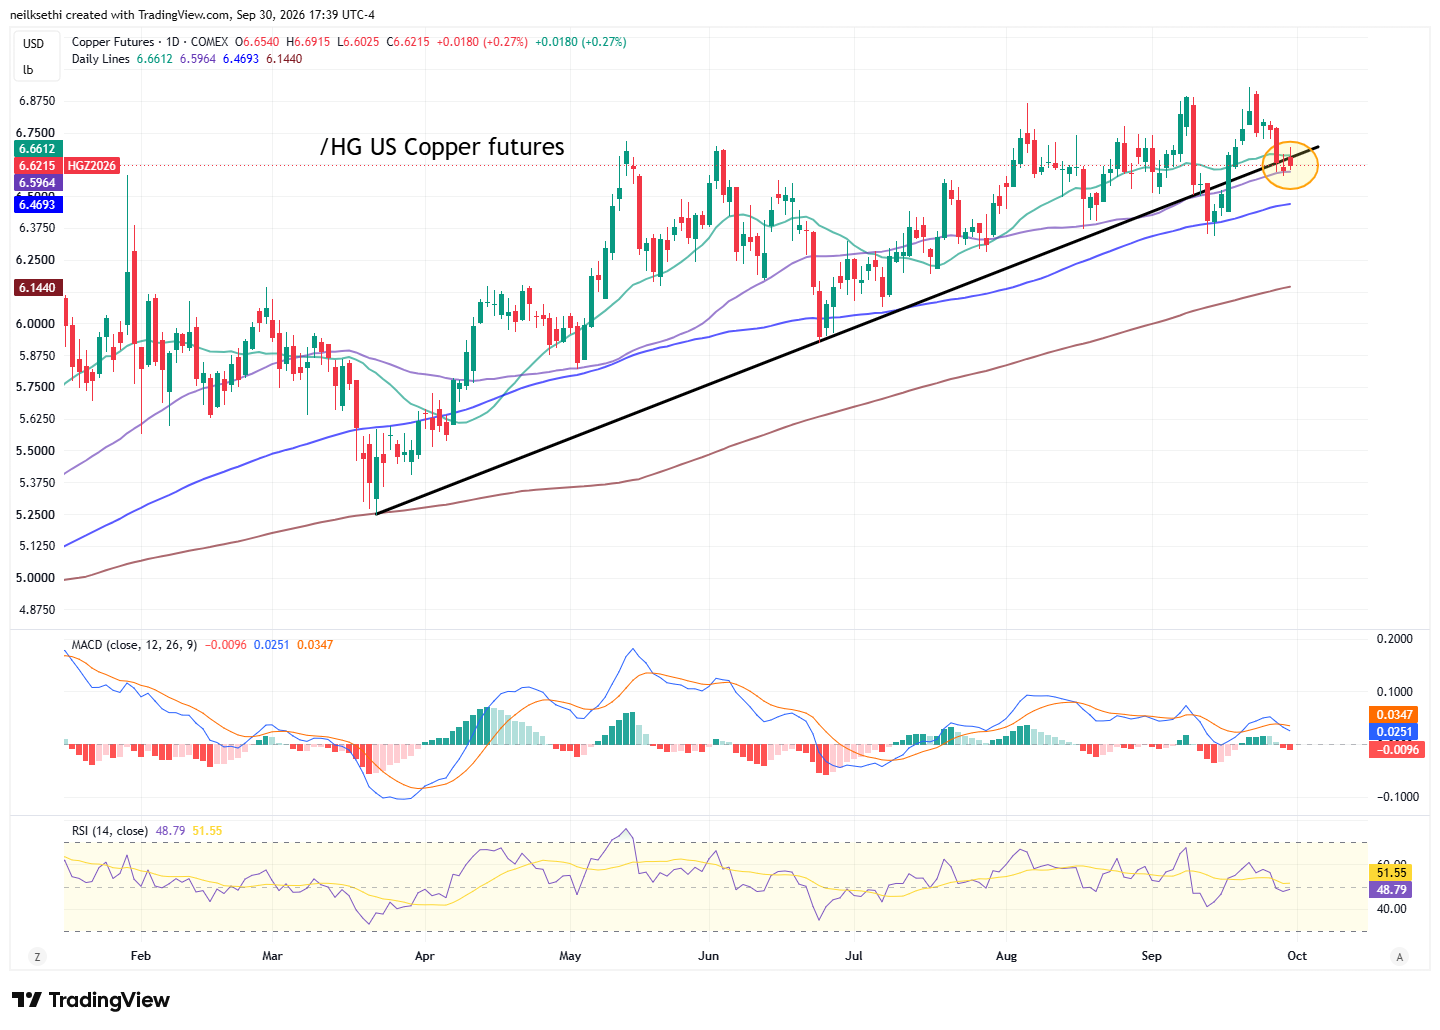
US copper futures (/HG) little changed continuing to hold the 50-DMA. As noted Tuesday the daily technicals have now softened to negative. As I said then “Given it made its stand at the start of the month at the 100-DMA, I’m going to give it that room again this time.”
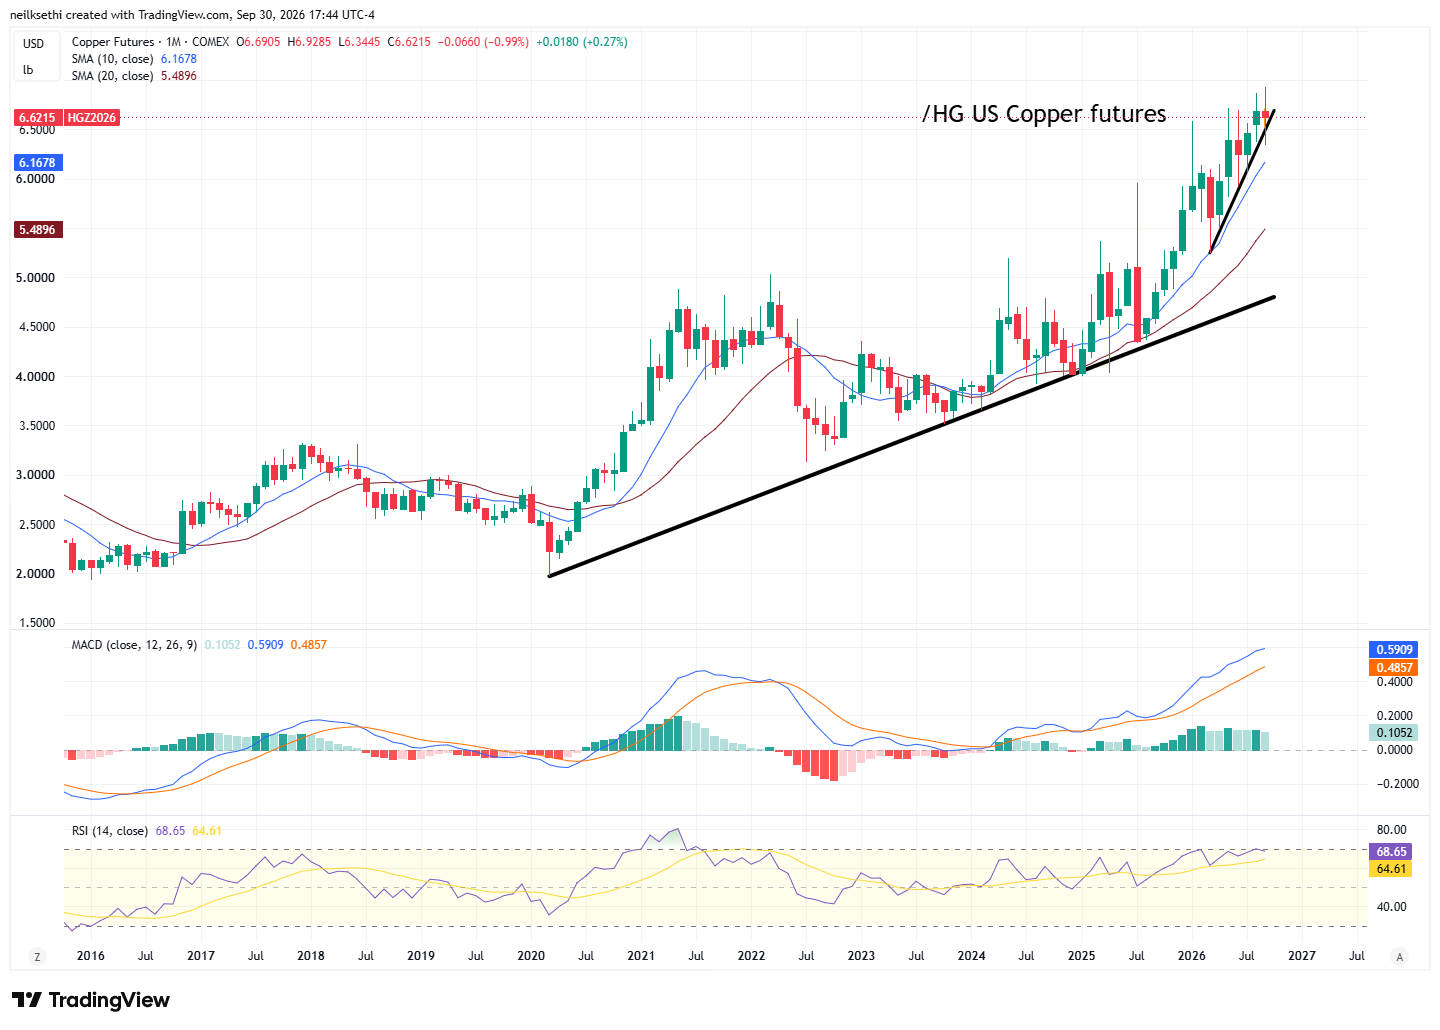
Monthly chart continues to look very solid.
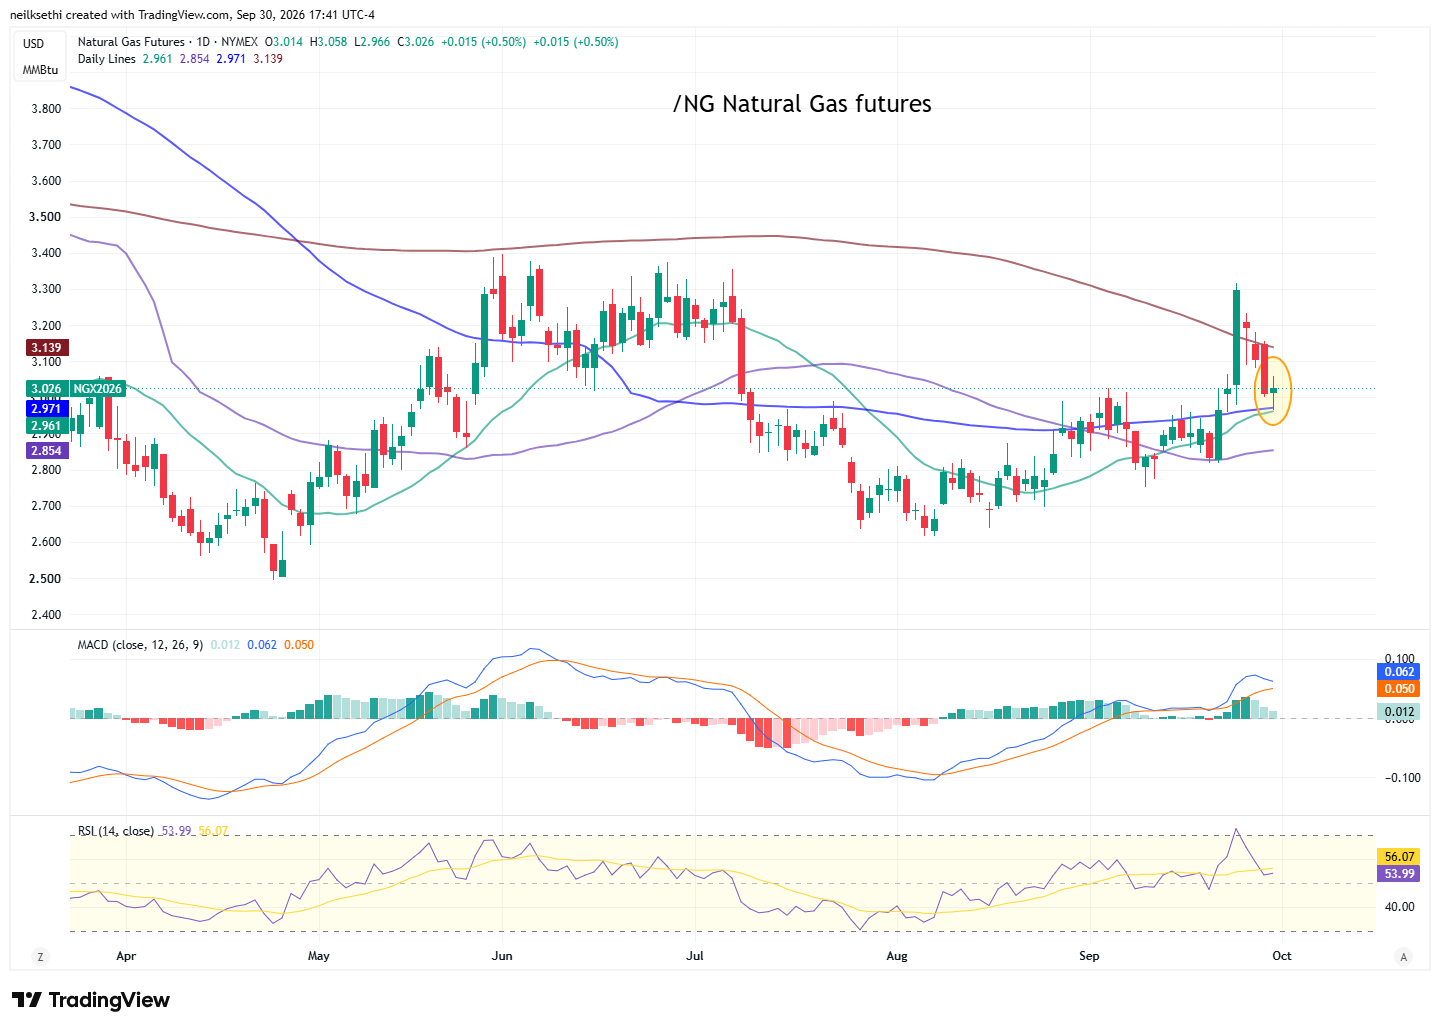
US natural gas futures (/NG) fell back for a fourth day before bouncing off the 100-DMA. We’ll see if they can hold above that and the $3 level.
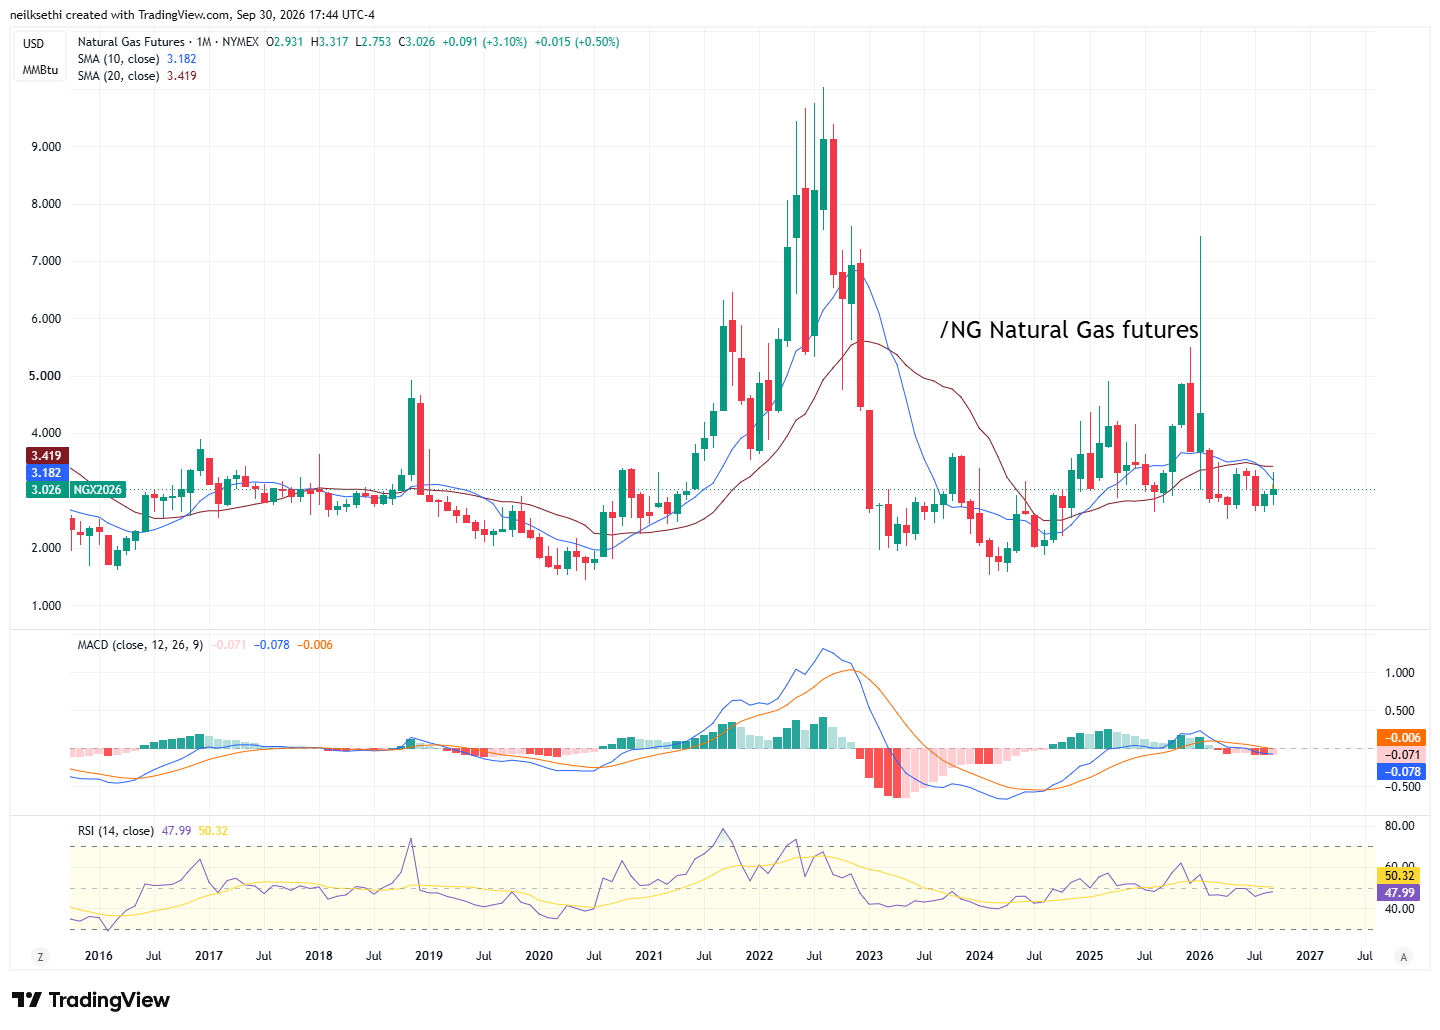
Monthly chart still capped by the 20-MMA.
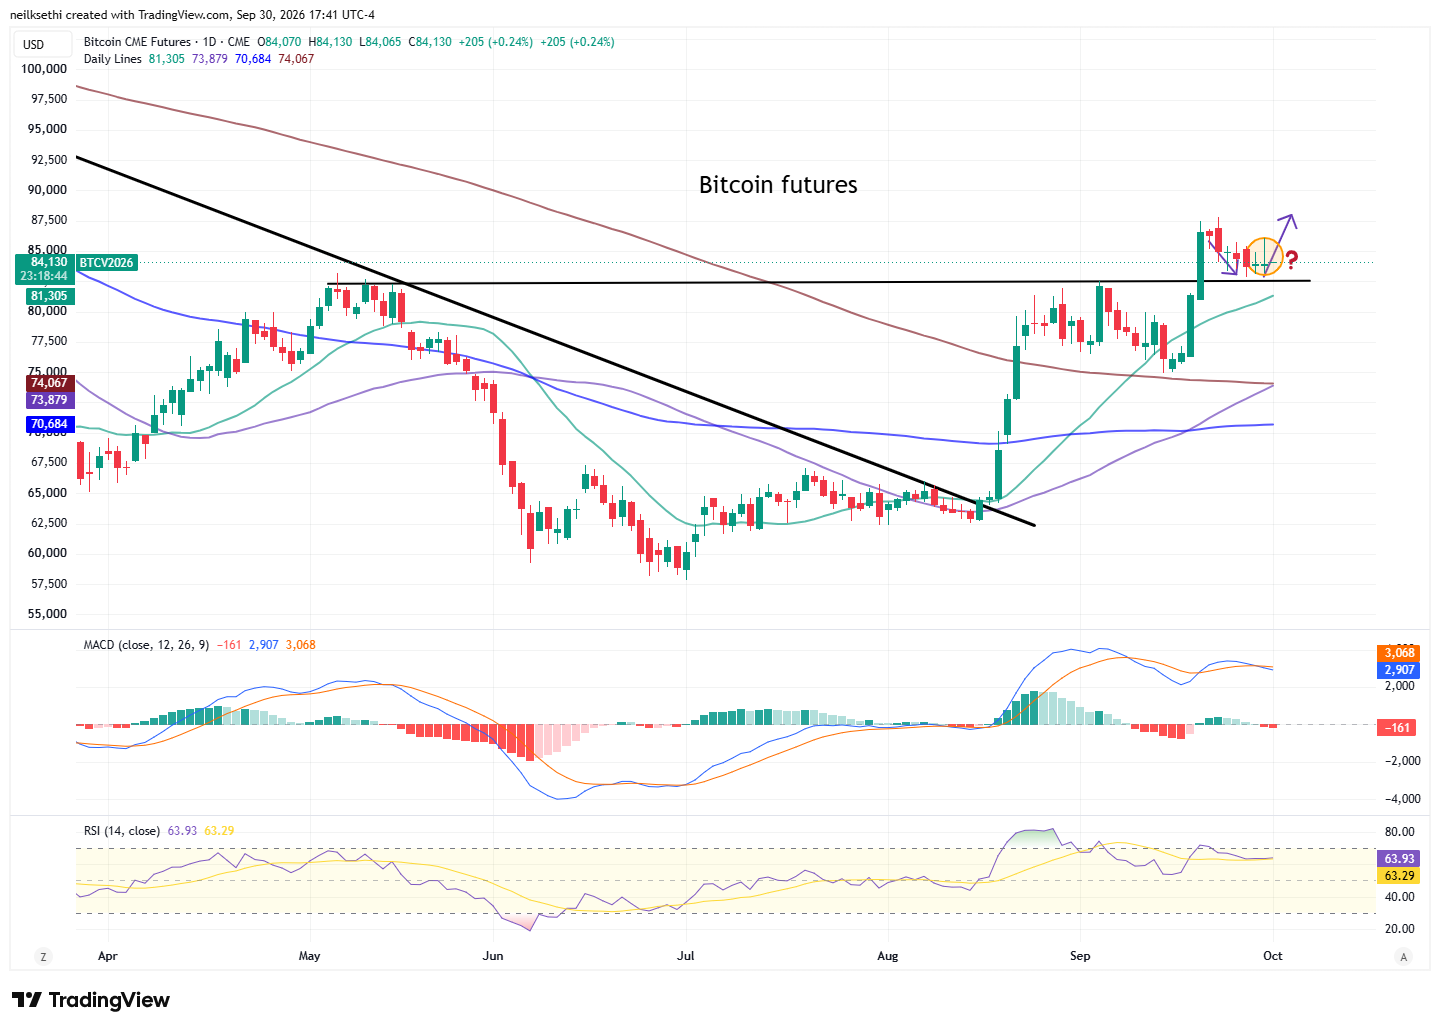
Bitcoin futures up (barely) for a second session, for now keeping alive the “natural path” (for bulls) I laid out a week ago (in purple). Needs to hold that breakout level. A break of $82,000, and I will be selling. Daily MACD has slipped negative while the RSI remains positive for now.
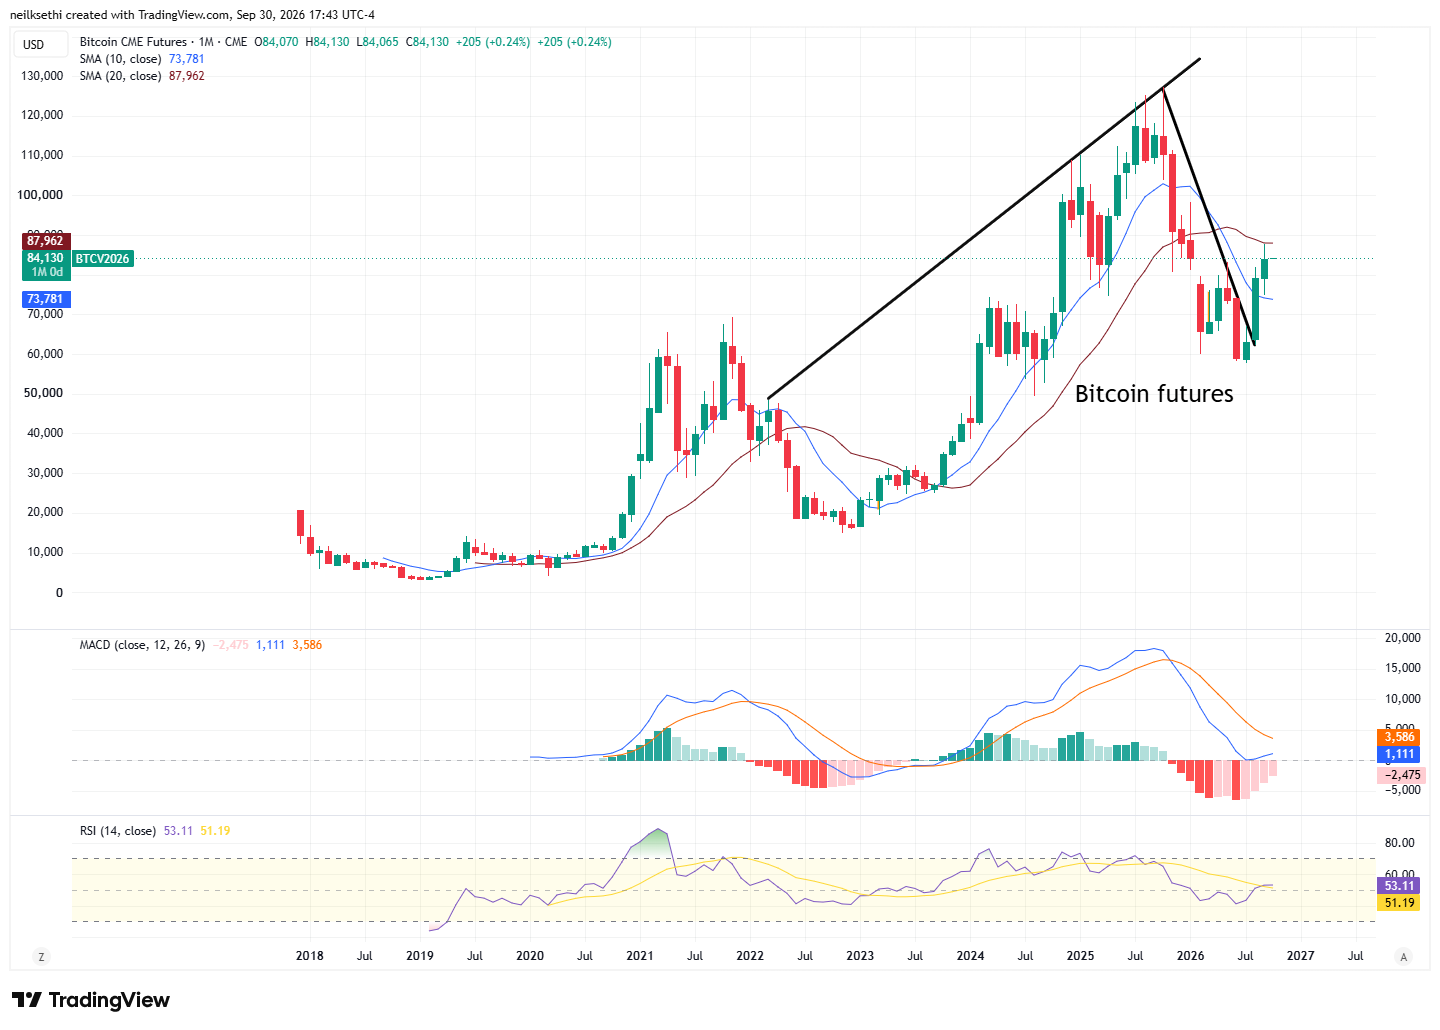
Monthly chart remains less positive remaining under the 20-month moving average with the monthly MACD still negative.
More From TheStreet Pro:
- Chris Versace – Why August PCE Shouldn’t Be the Focus: 8 Key Items Shaping the Stock Market Wednesday
- Stephen Guilfoyle – A Chill Down Wall St. as Confidence Cools
- James “Rev Shark” DePorre – September Trading Sees Fitting End With Higher Rates and 2 Tiers
- Bret Jensen – Here’s Where I’m Keeping My Dry Powder Safe From Market Headwinds
And From Me If You Missed It:
- Job Growth Rebounds to 3-Month High as Manufacturing Hits Four-Year High
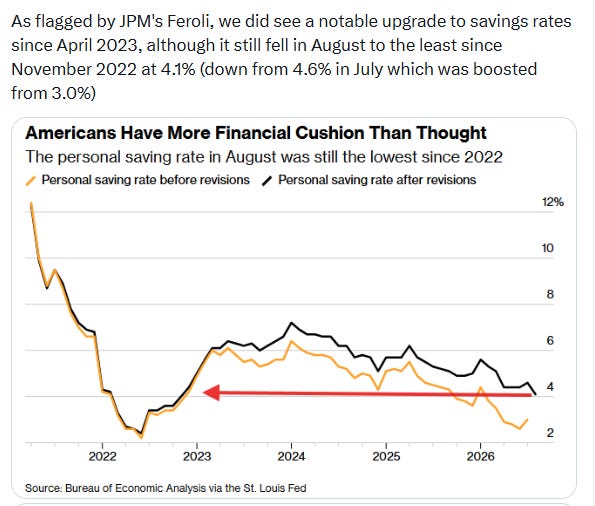
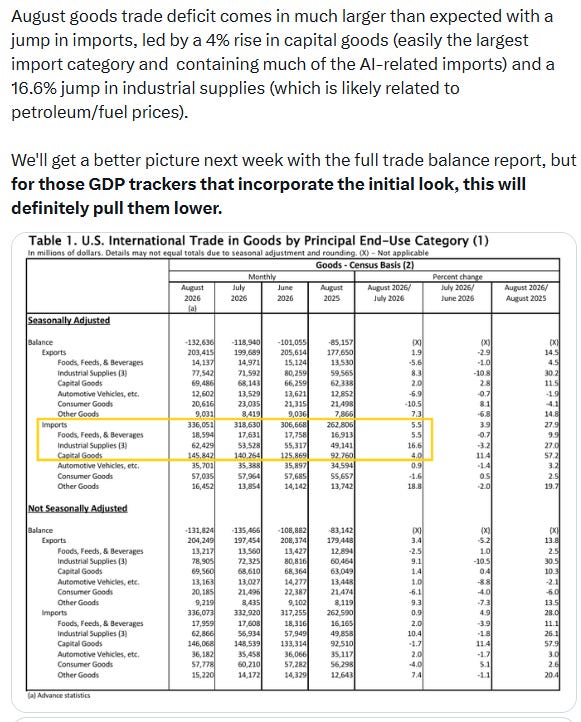
- Core Inflation Moderates While Real Spending Jumps
Miscellaneous:
Wrap-Up – A Reason For Hope (Part II)?
I said last week in Wednesday’s wrap-up:
The gravitational pull of surging interest rates was too powerful for even the renewed Tech trade to escape Wednesday. I had mentioned in prior weeks that it would be difficult for stocks to succeed if rates were going to continue ratcheting higher, let alone a jump like we saw today.
I had hoped that we had seen the highs, at least in the short term, but clearly not. We are unfortunately now apparently in a “good news is bad news” (and vice versa) cycle, and given my positive outlook on the economy, I’m not sure how much bad news we’re going to get… So it seems we’ll just have to wait for this most recent leg in yields to run its course. We’re already above levels that I thought would cap things so I’m taking the other side of this trade, but it could be some time before that pays off the way things are going.
This hasn’t dented my longer-term optimism though, and the pullback is creating what will prove to be bargains in many stocks.
And I noted Monday
today was a reprise of Wednesday’s action. A push higher in interest rates sucking the life out of even the previously strong Tech trade. As to Tech that was a one-day blip and the trade came back Thursday and Friday. Will we see something similar this time as well?
As to the non-Tech trade, I will continue with my now well-worn statement that we have gotten to a place where things are very stretched in terms of the rout in bonds and non-Tech areas of the market. As I have noted, though, these things can continue well beyond where they “should,” so your guess is as good as mine as to when we see at least a short-term reversal. It will come at some point, so all we can do in the meantime is wait and try to stick with what’s working.
And as I said Tuesday
today was tracking along with Monday’s action, right up until NY Fed President Williams’ speech discussed above. Could that mark a turning point in this seemingly never-ending press higher in yields? Certainly too early to tell, but we can always hope right? As noted we’re also seeing more and more calls to buy bonds, and we know that pension funds are modeled to be big buyers this week.
And early in the day we were seeing a continuation of that. But then yields recovered their losses with the long-end pressing to new multi-decade highs. That along with what I suspect was the big pension rebalance we were promised (or at least some other month-end distortion) sent most equities back into the red.
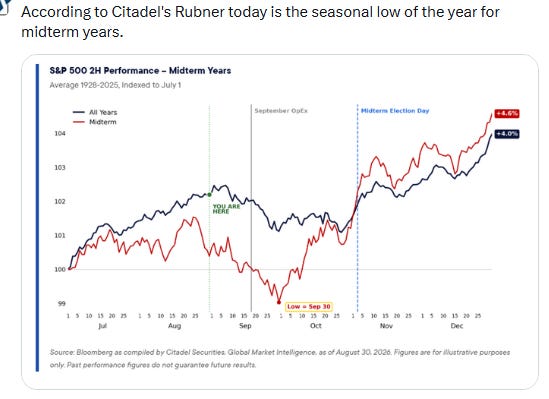
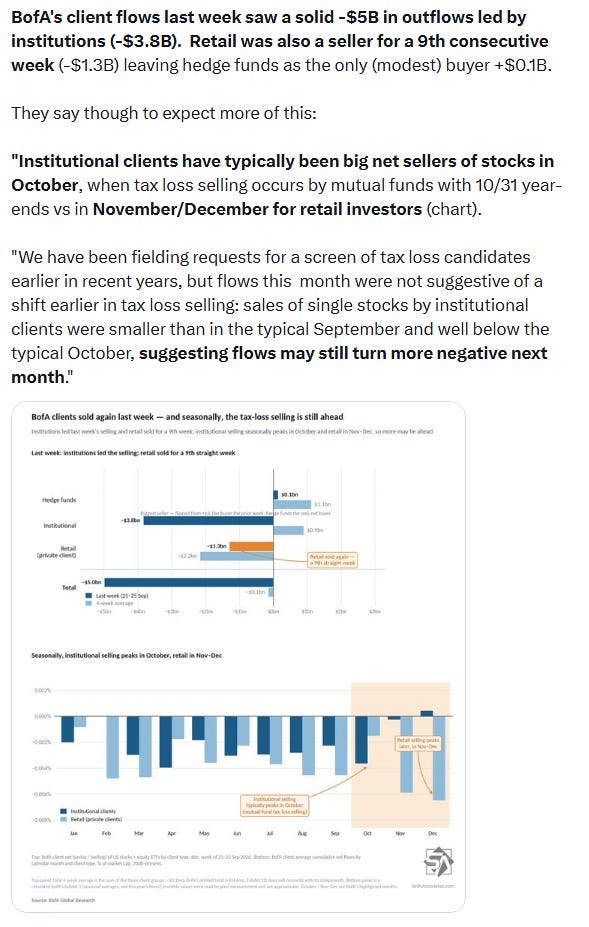
But now the list of positives grows somewhat. The pension rebalance is behind us, and we embark on the seasonally strong first half of October. The first of the month will also bring new 401(k) flows, and we saw evidence that the tech trade is reengaging.
Doug Kass also noted today that “the S&P Short Range Oscillator remains in a deep oversold at -4.98% vs. -5.37%”. That -5% level is one that has often been flagged as buyable.
So as I said Monday (and Tuesday), “Let’s see what we get tomorrow.”
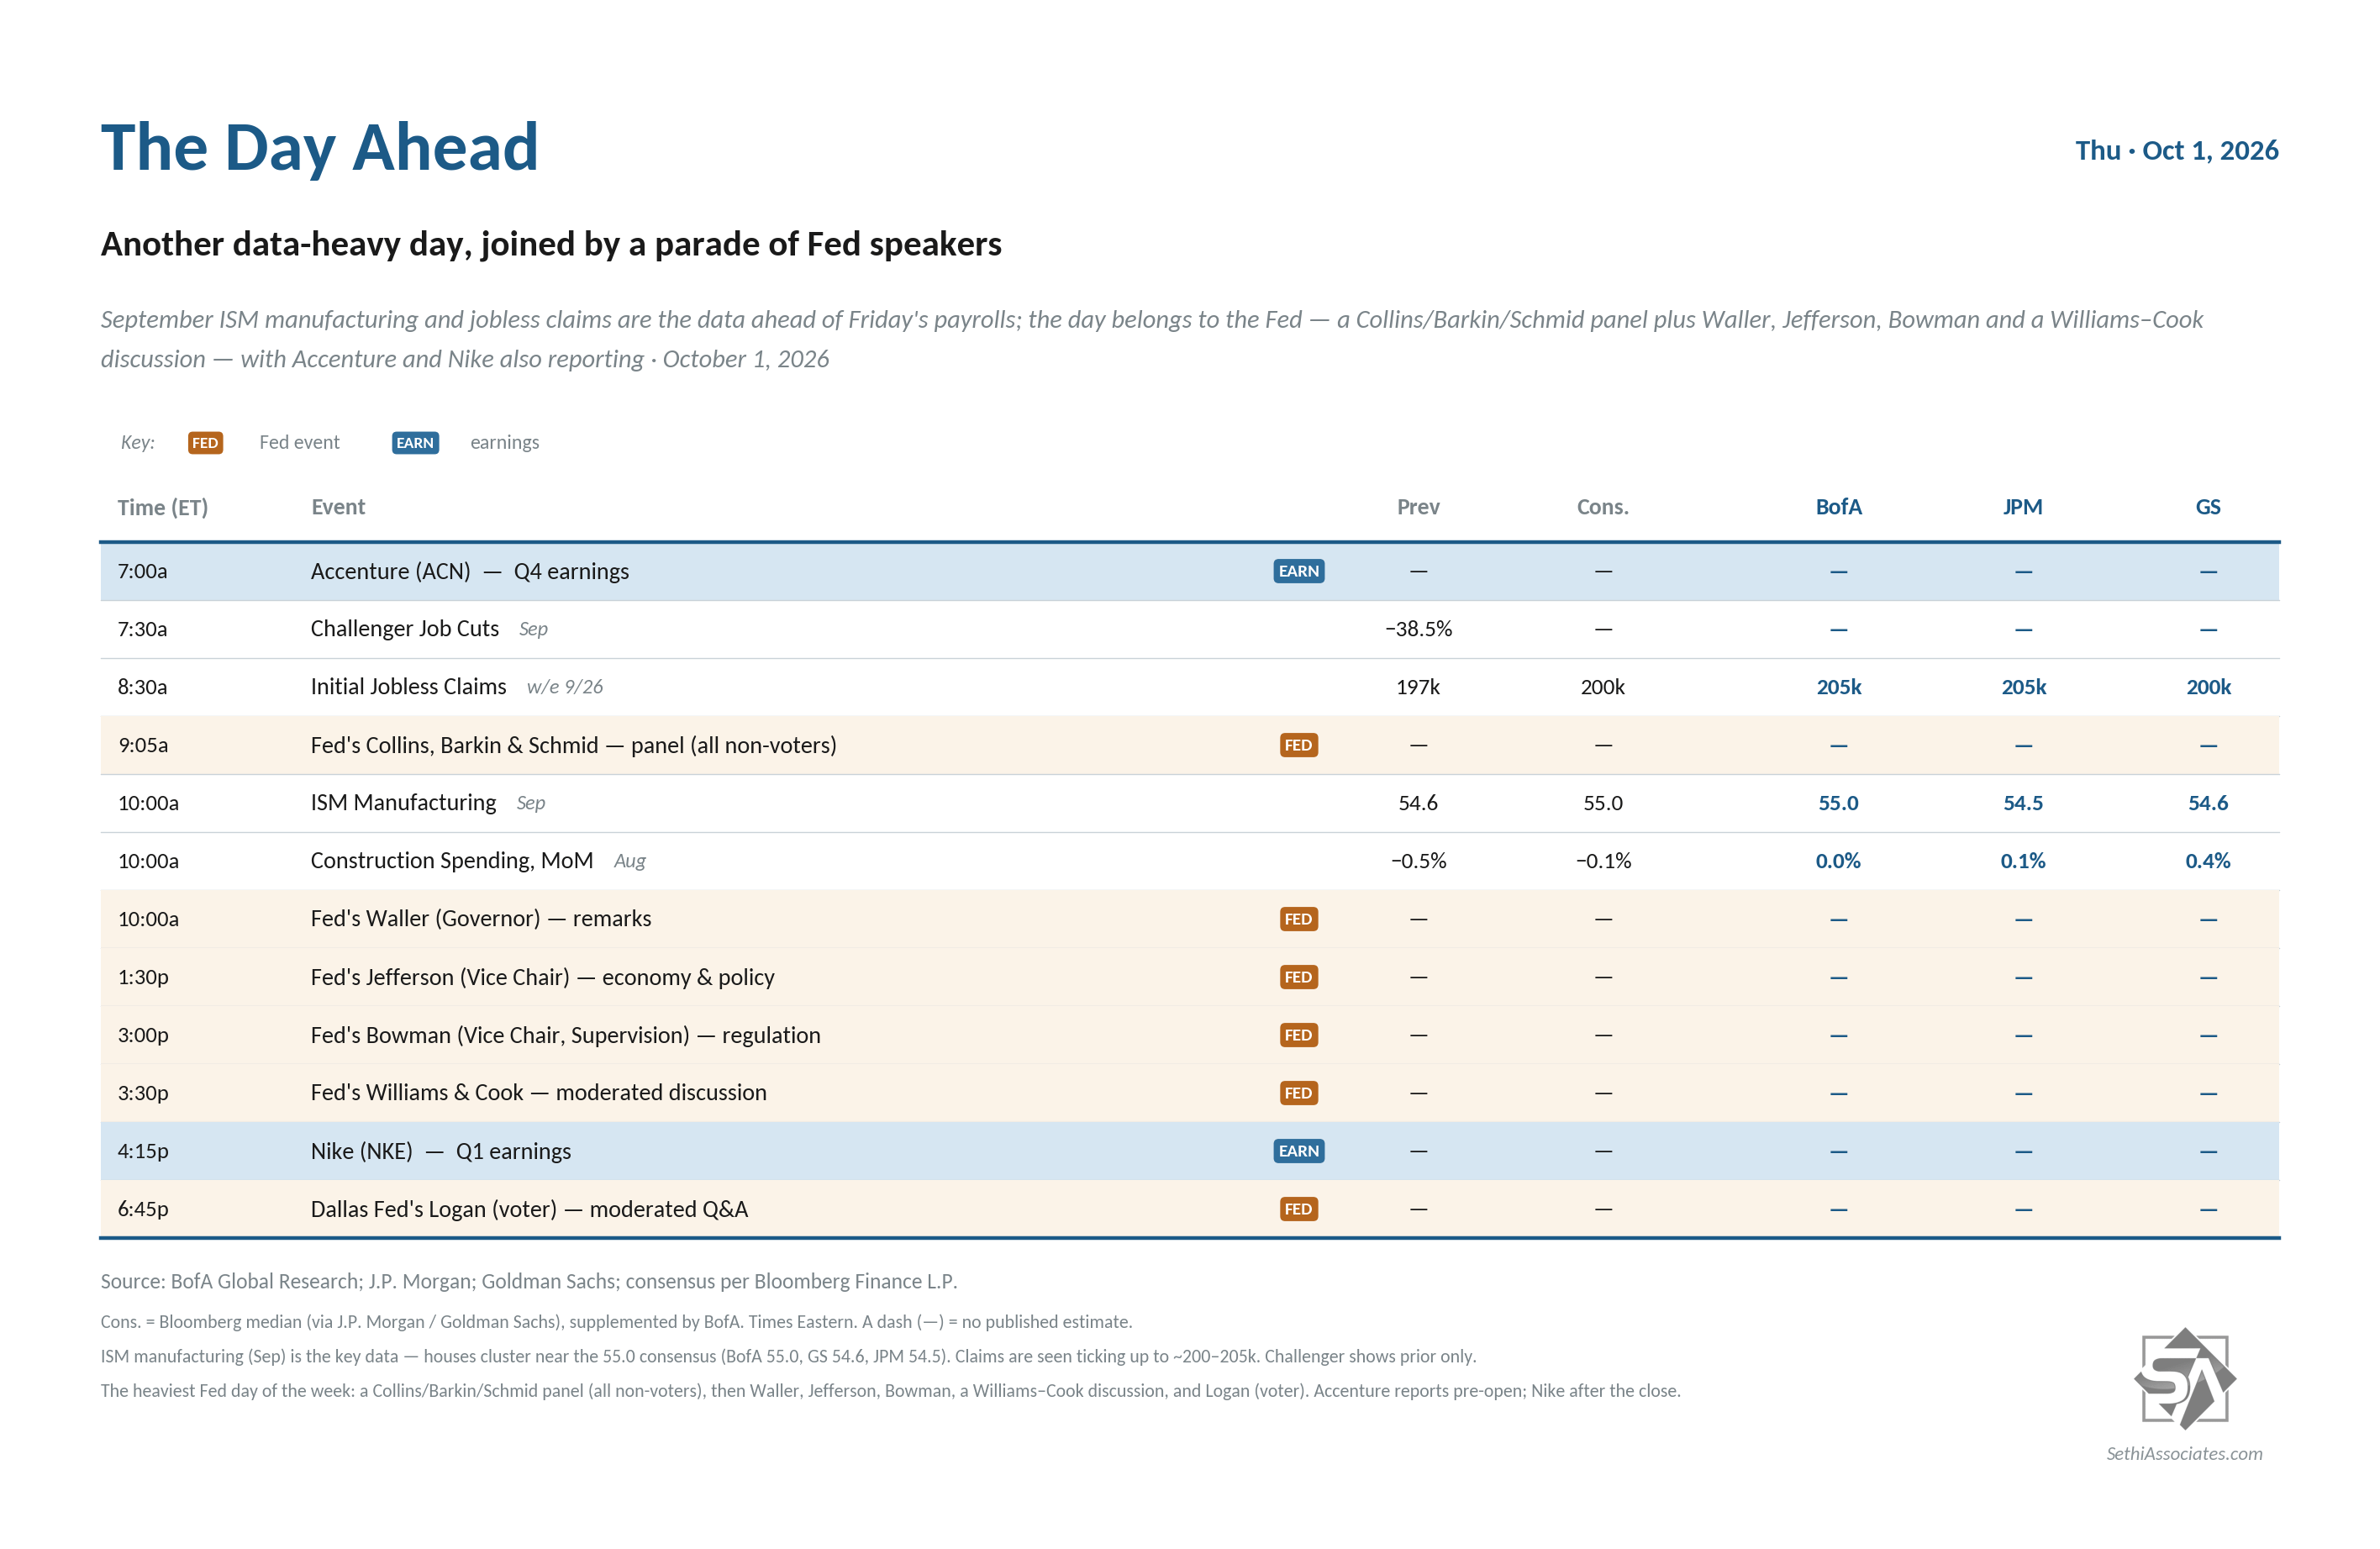
The Day Ahead – Another Packed Day
US economic data remains heavy although no individual reports pack the punch of the August personal income and spending report. But we’ll get some important ones nonetheless headlined by the final September manufacturing PMIs. In addition, we’ll get September Challenger job cuts/hires, August construction spending, and weekly jobless claims.
Fed speakers continue and we’ll get another big dose with Governors Waller, Jefferson, Bowman, Cook, and regional Fed presidents Williams and Logan. All will be interesting to the extent they opine on the upcoming rate path, but we’ve heard from Cook and Williams several times now in the past two weeks.
Non-Bill (>1yr in maturity) US Treasury auctions off this week.
We’ll get three SPX components reporting Thursday in Accenture ($ACN), Nike ($NKE), and McCormick ($MKC).
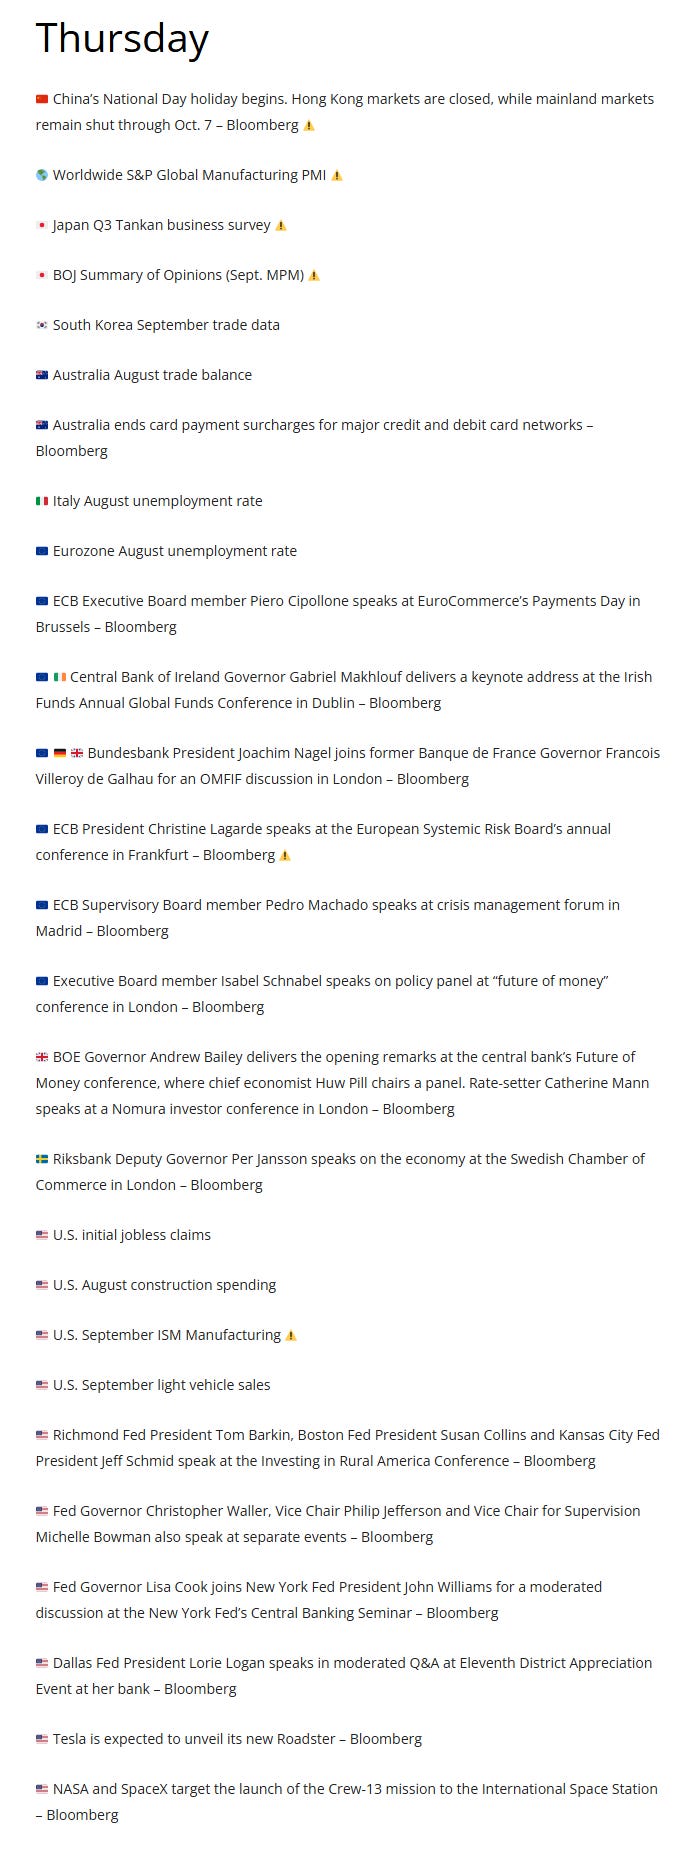
Ex-US highlights are September manufacturing PMIs, Japan Q3 Tankan survey, Italy August unemployment rate, budget balance, Eurozone August unemployment rate, South Korea exports, Switzerland September CPI.
Also China’s week-long National Day holiday begins.
From Christophe Barraud’s international Week Ahead rundown:
At the time of publication, Sethi was long MU, META, GOOG, AMZN, BA, QQQ, SPY, CPER, IBIT, and numerous equities in the energy sector.
As a reminder comments are encouraged. If they are directed at me, please put @NeilSethi in front.