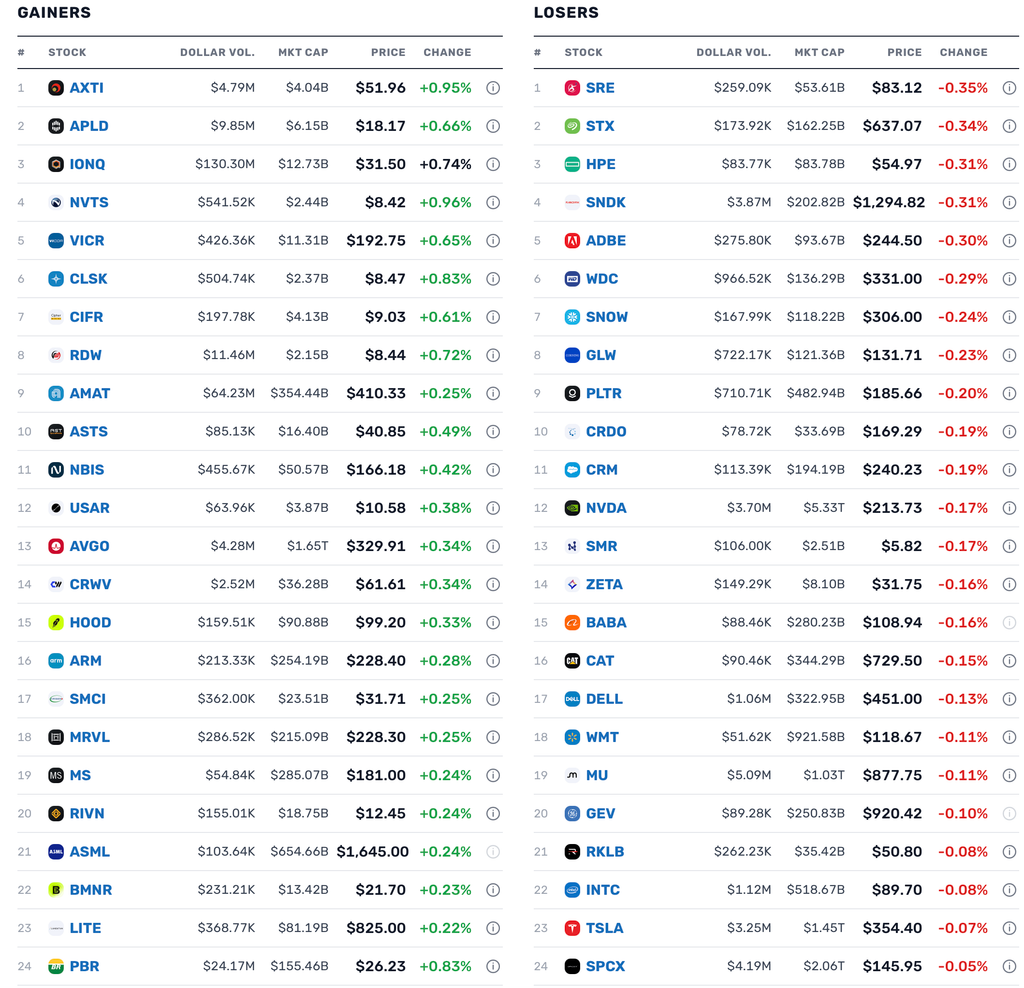
Friday’s After-Hours Movers

Position: None
Position: None
Closing Volume
– NYSE volume 10% above its one-month average
– NASDAQ volume 17% above its one-month average
– VIX index: up 21.45% to 19.99
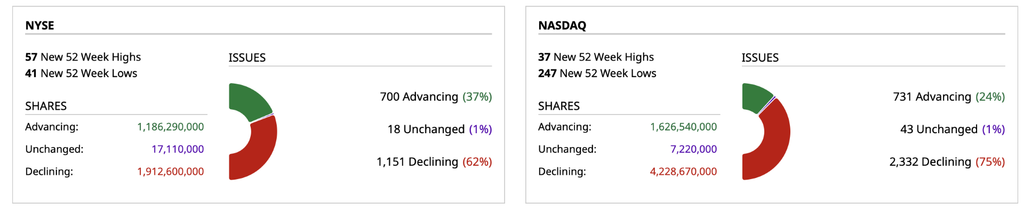
Breadth
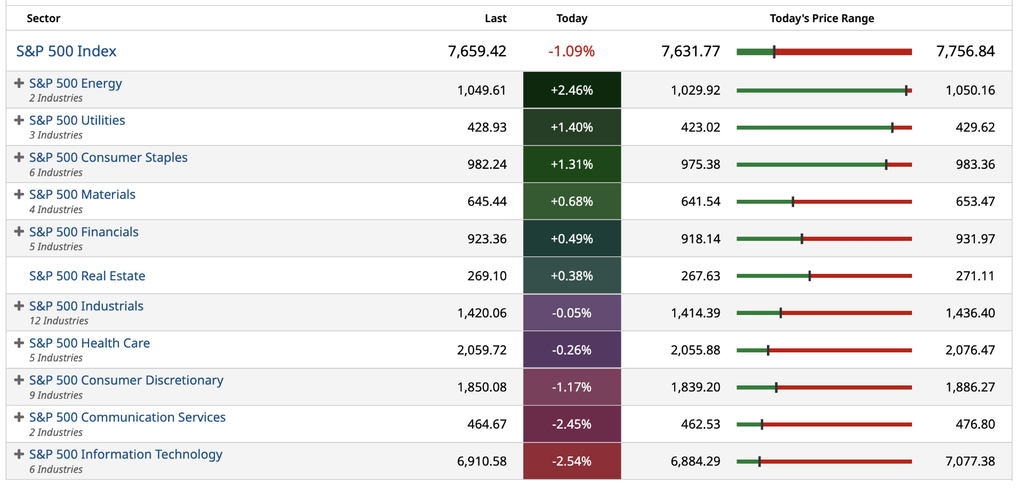
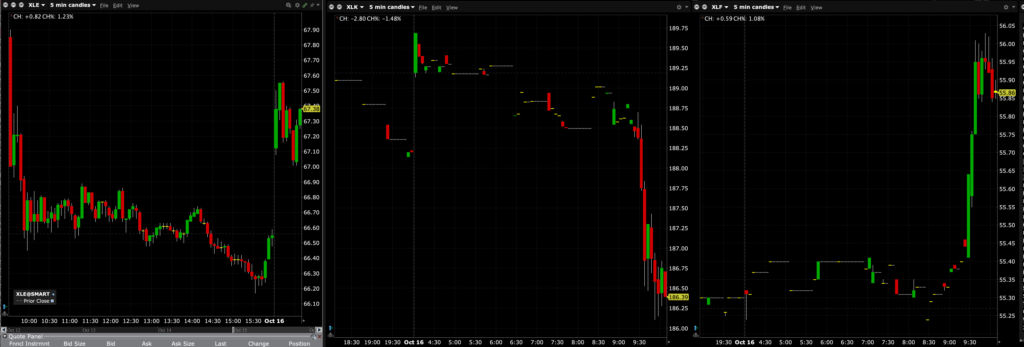
S&P 500 Sectors
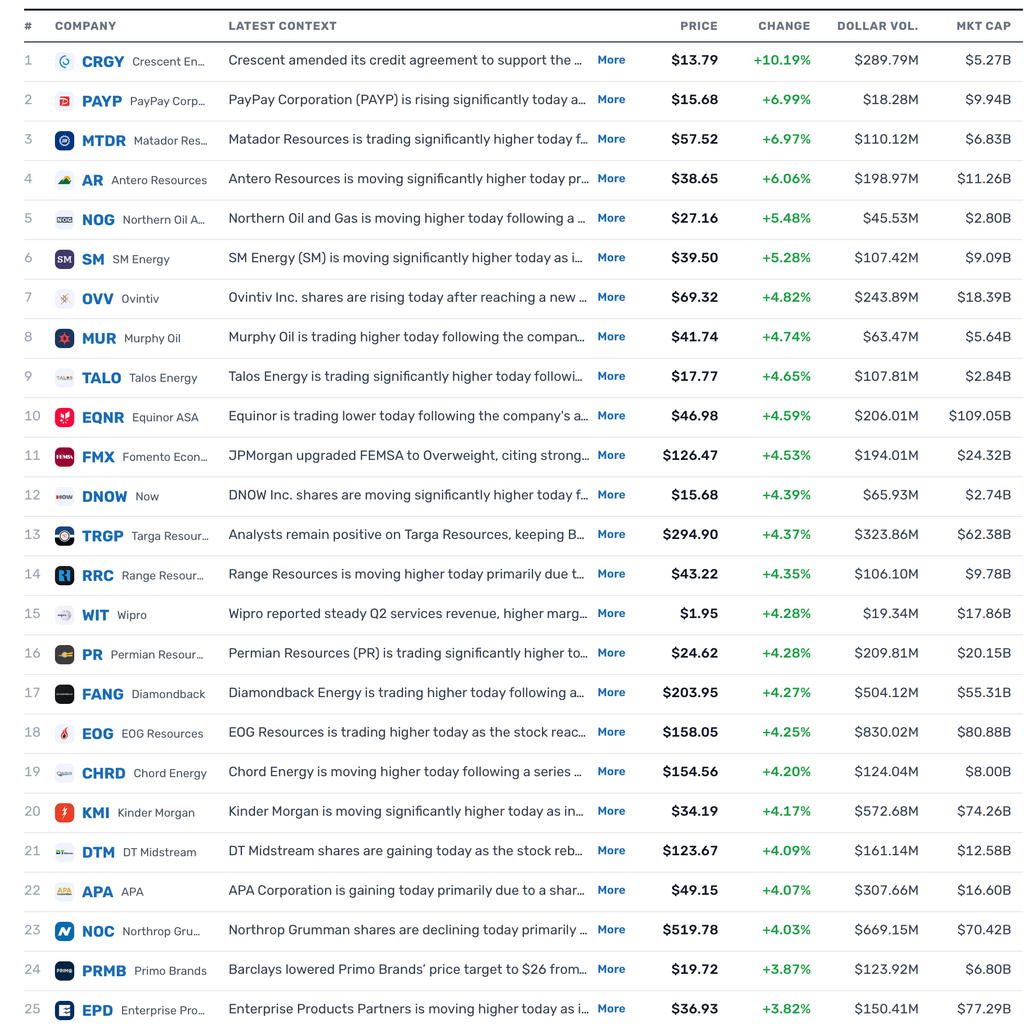
% Movers
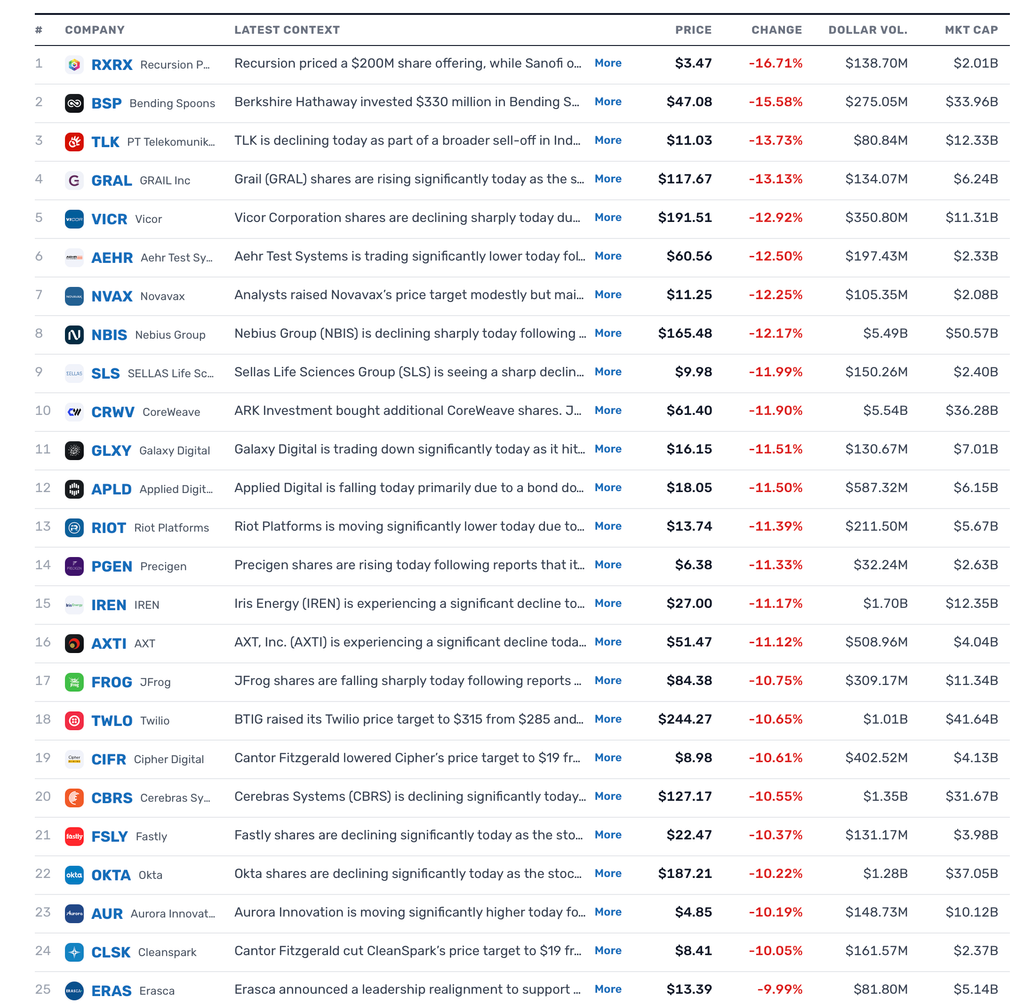
Heat Maps
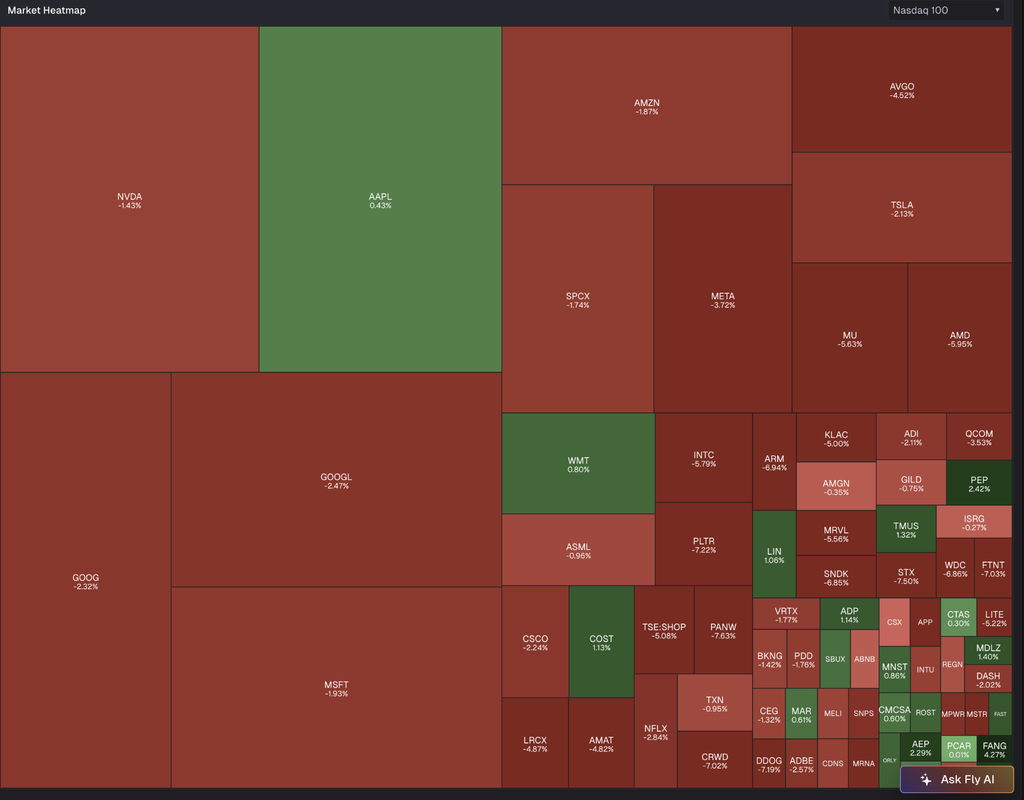
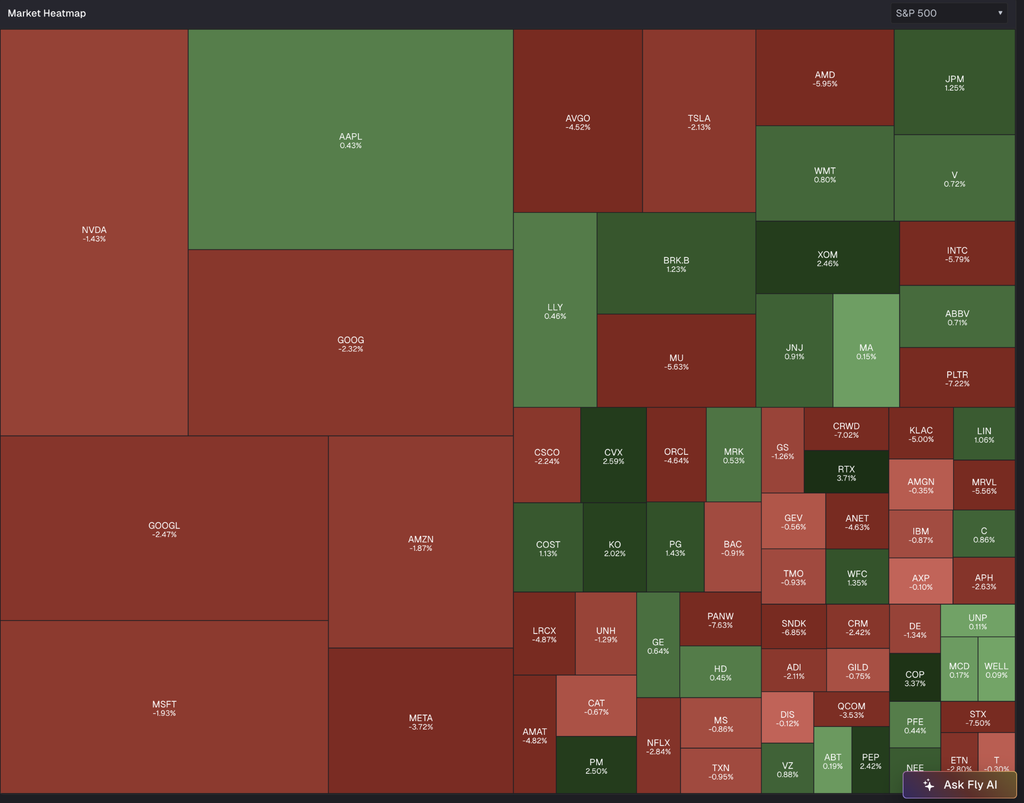
Position: None
I am leaving early for the weekend as I have much to do regarding my return to Florida.
Thanks for reading my Diary.
I hope my output was helpful.
Enjoy the weekend.
Be safe.
Position: None
No trades today since my index rental.
Position: None
Position: None
Position: Long MSOS common (VL), calls (VS)
A few observations:
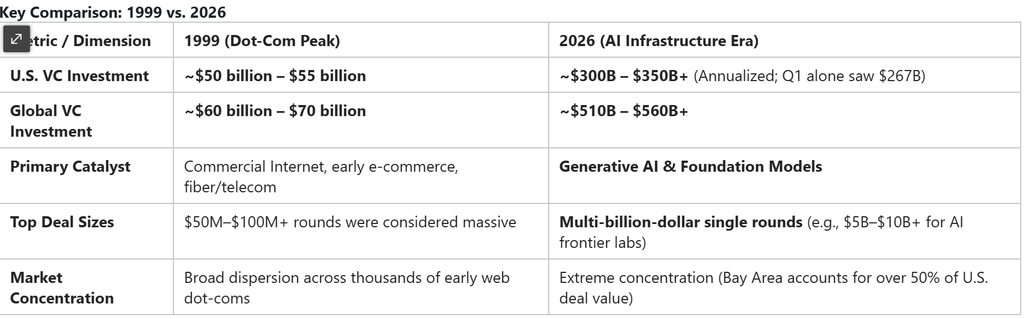
* Per my previous “Tales” in which I made the point regarding the low-quality revenue in this space due to a lot of it coming from venture-backed firms that have no future like Character AI, here is some data. Tweet and subtweet. The first tweet claims 80% of Anthropic’s and Open AI’s revenue comes from startups. I have no idea if this is true or not, but it seems plausible, when you see what these startups are actually doing both on the revenue and expense side. The subtweet from Chamath Palihapitiya of all people verifies these numbers. Then the bar graph he includes also indicates 80% of all venture funding is now going into the AI space. In dollar terms, that is a massive number, and dwarfs the $ invested in the dot-com cycle per the data below, and is also much more concentrated. The scale at which they and private capital now invest in these startups is now at another level.
A giant hunk of OpenAI and Anthropic revenue is coming from garbage that has no economics, does not need to exist, and only exists due to greater fool theory investing, and will eventually not exist, just like Character AI, which went from $2.7 billion to almost $0 in an instant. Same thing that happened in the dot-com era and sent Exodus and a lot of other things to $0. On top of that, another giant hunk of the revenue that remains for Anthropic and OpenAI comes from distillation, which will have to slow because everything for the most part has already been stolen. Even Meta ($META) apparently did it to build their new model, and has now cut it off, which is funny and ironic.
Silicon Valley really did create its own circular self-fulfilling money-recycling machine. That is one more reason they are all so promotional about this stuff. There is no underlying economics, the only thing they have to rely on is the next greater fool.
* Nvidia’s ($NVDA) Jensen Huang saves the day yesterday by claiming he doesn’t need to backstop CoreWeave ($CRWV), “because their cost of capital is decreasing.” There was a time when you would lose all credibility for saying something obviously that stupid, wrong, and untrue. Because of that, nobody even would even say that sort of thing. Now, it is the exact opposite world. The more crazy and outlandish a statement, the more one is rewarded for it. These guys, and their circle, have become worse than politicians.
He then went on to extol the virtues of CRWV. If CRWV is so great, why doesn’t NVDA just buy them, capture the value, and solve the whole problem? Because none of it is true and if NVDA were to buy CRWV, they inherit all of the losses, and the balance sheet, and lose the ability to sell into them and recognize all the revenue without the offsetting expense. For all intents and purposes, CRWV is really just an SPV that was created to consume NVDA parts. It is an accounting vehicle built to inflate NVDA revenue and profits, in my view. NVDA invested $100 million into CRWV privately in 2023, and anchored the actual IPO with $250 million, and without their participation, the deal might not have even gotten done.
It is amazing to me GAAP allows for all of this shenanigans. If it didn’t, the internet bubble implosion, where the same stuff was done to lesser of a degree, may not have happened as well. When it is all over, the history books will reference this stuff, but nothing will probably change, and then it will happen all over again with something else in another 10-20 years.
CoreWeave’s CEO claimed his stock was going down due to the market selling his stock irrationally. If it is irrational for the market to sell his stock, why do he and all the insiders there sell it like nobody’s business? The amount of insider selling there is staggering.
“Before CoreWeave imploded, its three co-founders had been busy dumping stock, a lot of it, totaling $3.3 billion since the company’s March 2025 IPO. Michael Intrator, Brian Venturo and Brannin McBee sold $2.4 billion this year alone, according to Bloomberg’s new report on corporate filings. Intrator has sold more than $907 million in shares this year. McBee’s sales since the IPO total $1.06 billion, equivalent to 40.4% of his undiluted stake at the listing. Venturo has sold more than $1.2 billion, representing over 35% of his original holding.”
https://www.zerohedge.com/markets/coreweave-founders-cashed-out-33-billion-meltdown
If it is so irrational to sell the stock, where is the press release from them indicating ALL insider selling will now stop, and the 10b5’s are cancelled? Diversification is no longer an excuse. They have taken enough money out. I will cut these guys a break. The stock peaked at $184. I will give them a break and allow them to include the term that no selling is allowed until the stock gets back to $150, which is still well below the all time high.
Position: Short CRWV (S)
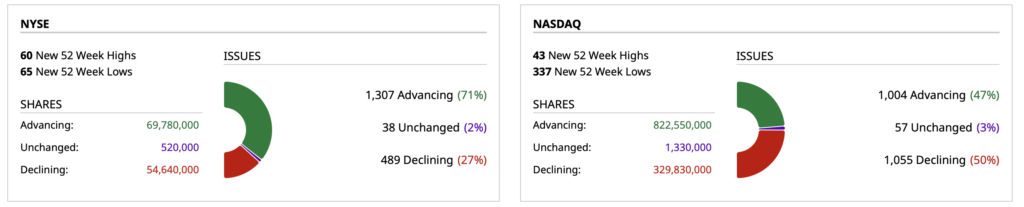
– NYSE volume 15% above its one-month average;
– Nasdaq volume 10% above its one-month average;
– VIX index: down 4.37% to 15.74
SOURCE: Barchart
SOURCE: Barchart
SOURCE: TheStreet Pro
SOURCE TheFly
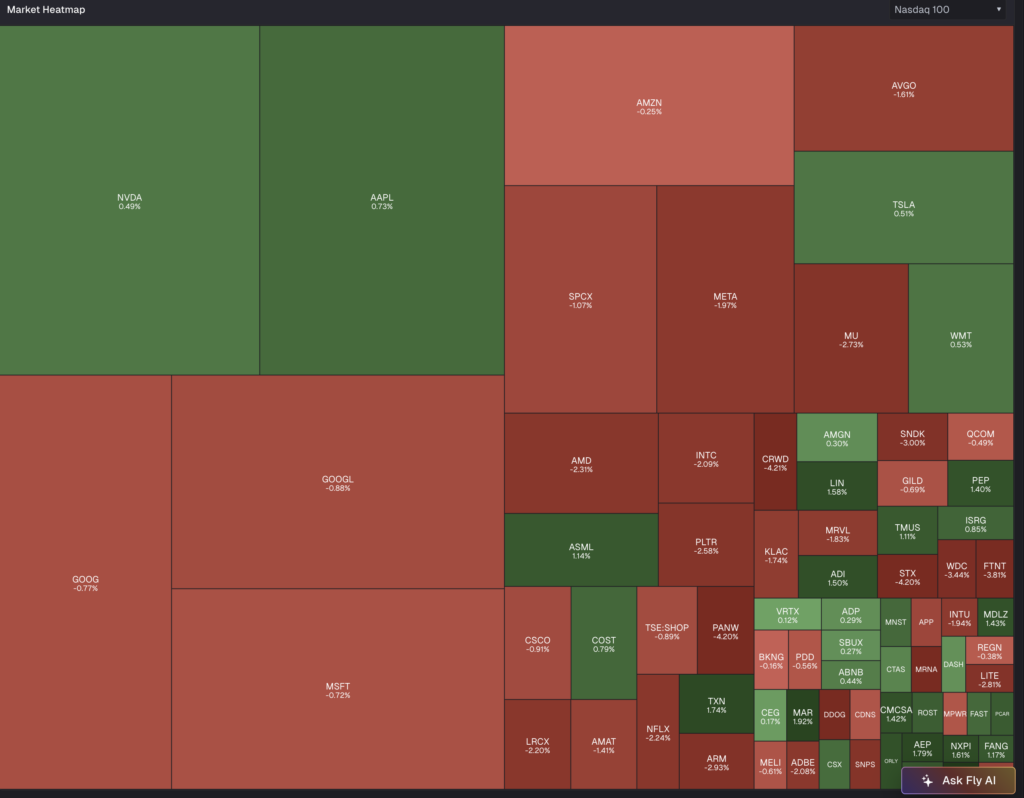
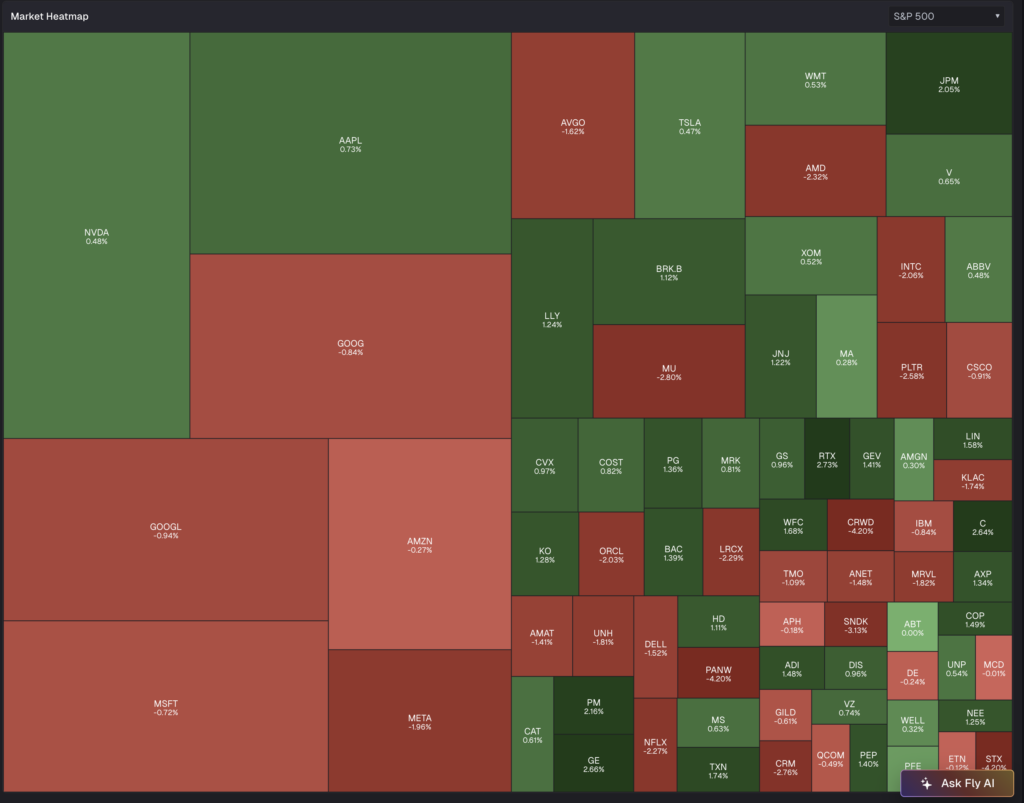
Chart from 10:07 a.m. ET
The following is from Peter Boockvar:
If there ever was a time since the GenAI tech trade started to accelerate in 2023 for investors to fully reevaluate their exposure, it is now. As large as the concentration is in this space in the indices, there is thus a large part that is not and that is ripe for opportunities and I’m talking globally. The question of whether the AI CapEx binge slows is not if but when and you can be sure that the stocks exposed to it peak well before the CapEx does. I still believe that from here, the benefits of the incredible technology being created will accrue to the rest of us and not to the infrastructure builders, similar to what we saw with the internet buildout.
My favorite two sectors that we own remain commodity stocks, particularly in energy, precious metals, ag and uranium and also the beaten and battered consumer staples stocks with some of the best dividend yields in the market. As I also believe the fate of the US dollar is in the hands of this AI trade, having international stock and bond exposure I think is important too with a lot of cheap stuff overseas, like in the UK, Brazil, Singapore, Vietnam, China and even France.
As expected, Kevin Warsh speaking in Thailand said nothing market moving and rate hike odds for October are now at just 14% with the December meeting still holding its high likelihood at 88%. While long rates are up today, I still think we’ve seen the peak short term. Longer term, I still expect us to be in a rising rate backdrop.
It is quiet elsewhere so we’ll just jump right to some earnings calls.
Manpower stock got slammed by 16% yesterday after they missed earnings expectations, and from them of note though they didn’t say much on the macro:
“Commercial staffing remained very positive, while professional staffing returned to growth during the quarter.”
In the US, “We saw continued solid demand across consumer goods, notably food manufacturing and logistics, as well as opportunities tied to automation and reshoring, which are driving demand for specialized technical talent.”
They have a French business too and “from what our clients are telling us and from what employers are doing, the labor market remains stable.”
From JB Hunt who slightly missed both earnings estimates while revenue beat and is down pre-market:
The top line jumped by 20% but operating income was only higher by 2%. “At an investor conference in September, we identified three primary cost headwinds this quarter, driver related investments, volatile fuel prices, and higher claims and medical cost. Driver related costs include recruiting, onboarding, training, sign-on bonuses, and targeted wage actions.”
“Capacity remains contrained, operating costs continue to move higher, and supply chains are seeking out providers that can deliver reliable capacity at scale. Most importantly, customers have gained a much clearer understanding of these realities.”
And helping to mitigate the jump in costs, “we’re asking for larger rate increases certainly than what we’ve shown so far… At the end of the day, our pricing has to outpace our inflationary costs or we have to find methods of taking costs out. I think as we went through 2025, we were very effective in our lowering our cost-to-serve initiatives and we saw success…So it is more about price at this point….Margin repair remains a top priority.”
From Prologis, the industrial warehouse owner:
“several long-term trends continue to drive demand for logistics real estate. E-commerce, advanced manufacturing, and the build out of the data center supply chain are all critical to the modern economy. Taken together, we expect demand to remain resilient even in a higher rate environment.”
“On the supply side, the bar for new development is going up. Construction costs are escalating, financing is more expensive, and return requirements are trending higher. That makes projects harder to pencil at today’s rents. All else equal, we expect fewer starts and a more favorable supply environment. That creates an attractive setup for rents.”
“Today, the rents needed to justify new construction have expanded to 27% above current market levels. That leaves meaningful room for rents to grow before new supply makes economic sense. That said, the capital markets backdrop has become more challenging. We think the recent move in rates will slow transaction activity and could put some pressure on values.”
This is what Commercial Metal, the steel maker, said on its end markets on their call:
“Beginning with infrastructure, demand remains elevated. Significant federal and state funding conditions to support a multi year pipeline of projects, and with a substantial portion of available funding yet to be spent, we have strong visibility into future activity.”
“Non-residential construction demand varies by market but remains a source of strength for CMC. Activity related to areas like data centers, power generation, utility infrastructure, semiconductor manufacturing, and institutional markets is solid and the Dodge Momentum Index remains near record levels, suggesting a robust and extensive project pipeline.”
They did mention, not surprisingly, that “residential remains mostly muted.”