A Democratic sweep of Congress supercharged the rotation trade, with hyperscalers joining a rally that lifted almost everything except semiconductors and AI power and data center names.
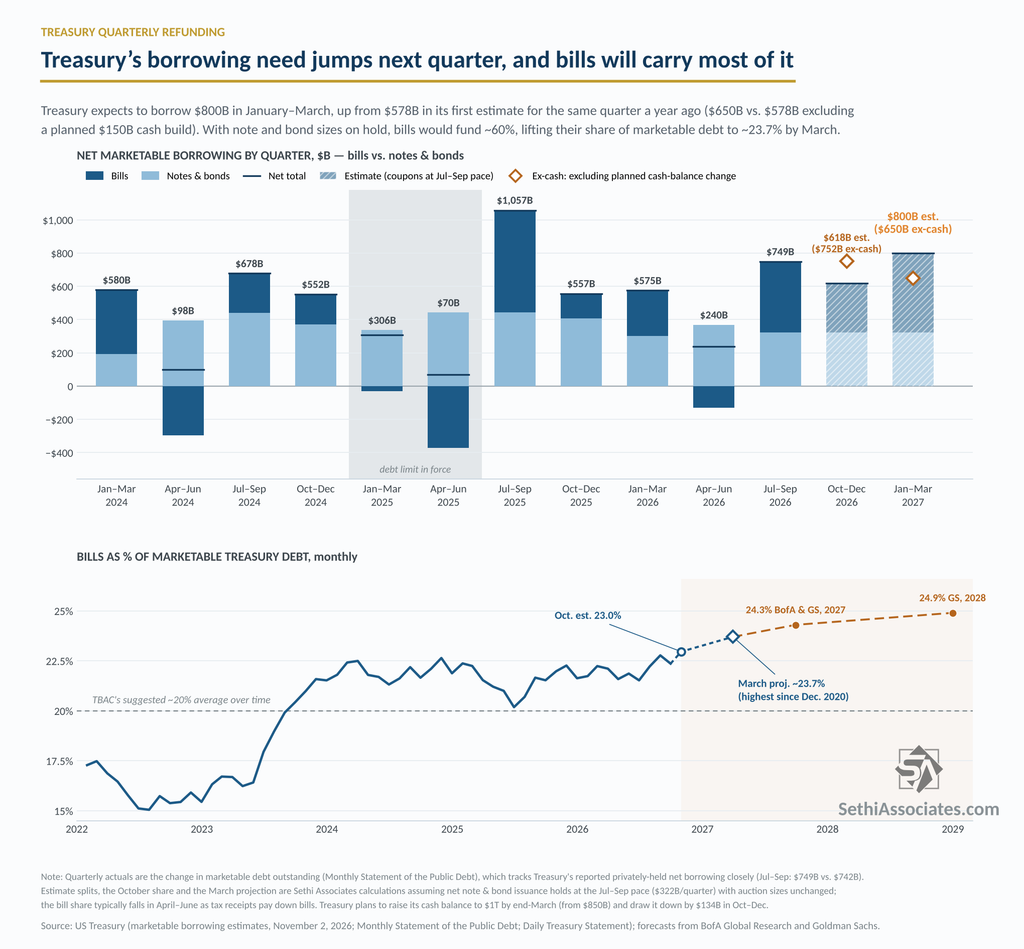
As an update to this morning’s post on the Treasury’s Quarterly Refunding (Mo’ Bills Mo’ Problems?), Treasury released its quarterly borrowing estimates this afternoon, and while the headline figure for this quarter edged lower due to a higher starting cash balance, the underlying need moved up and next quarter’s number is projected to be much larger, meaning an even greater reliance on bills if non-Bill borrowing remains constant or shrinks.
For the October–December quarter, the Treasury expects to borrow $618 billion in privately held net marketable debt, $10 billion less than it estimated in August. That cut came entirely from starting the quarter with $34 billion more cash than assumed ($984 billion versus $950 billion). Excluding the cash balance, borrowing is $24 billion higher than August’s estimate, meaning the deficit is running wider than expected.
For January–March, the Treasury expects to borrow $800 billion, up 38% from $578 billion in its first estimate for the same quarter a year ago. About $150 billion of that is a planned build in the cash balance to $1 trillion at the end of March, from $850 billion. Excluding that, the need is $650 billion, still up 12% from a year ago. Across both quarters, borrowing excluding cash-balance swings totals about $1.4 trillion, versus $1.19 trillion in last November’s estimates, an 18% increase.
Last quarter came in a little better than feared. The Treasury borrowed $742 billion in July–September versus its $739 billion estimate, but $34 billion of that went to a larger cash pile, so the underlying need was $30 billion below its August projection.
If note and bond auction sizes are held steady Wednesday, as noted this morning, bills will have to carry most of the increase. Net note and bond issuance ran $322 billion in the July–September quarter. At that pace, bills would fund roughly half of this quarter’s borrowing and about 60% of next quarter’s, or roughly $480 billion of net new bills. By Claude’s math, that would lift the bill share of marketable debt to about 23.7% by the end of March, with around $7.9 trillion of bills outstanding. That would be the highest share since December 2020. It’s also already close to Bank of America’s projection of 24.3% (about $8 trillion) by next September, as reported by the Financial Times, before any shift away from 20- and 30-year bonds.
The usual caveat applies: April tax receipts typically pay down bills, so March would likely mark a near-term high. Last April–June, bills outstanding fell $129 billion and the share dropped from 22.1% to 21.5%.
The Treasury will release its full refunding announcement at 8:30 a.m. ET on Wednesday, November 4.
At Wednesday’s Quarterly Refunding Announcement, Treasury will set note and bond auction sizes for the next quarter. That starts with next week’s refunding auctions, which would total $125B if sizes are unchanged: $58B of 3s, $42B of 10s and $25B of 30s. It will also update its guidance on future coupon sales.
Some on the Street are speculating that Treasury will shift supply away from the long end, particularly 20- and 30-year bonds, and toward T-bills. Citi expects cuts to 20s and 30s starting this month. BofA, Goldman, UBS and Barclays are among those looking for a change to the “at least the next several quarters” language in place since January 2024, although UBS sees no actual change in issuance until May. JPMorgan is the notable dissent. It expects the language to hold into 2027 and argues that cutting long bonds wouldn’t be prudent given the borrowing ahead and early signs that bill demand is stalling.
The motive is yields. The 30-year was still above 5.30% on Friday after long rates hit their highest in more than two decades in early October.
That shift though would push the T-bill share of debt further above the ~20% average the TBAC advised in 2024:
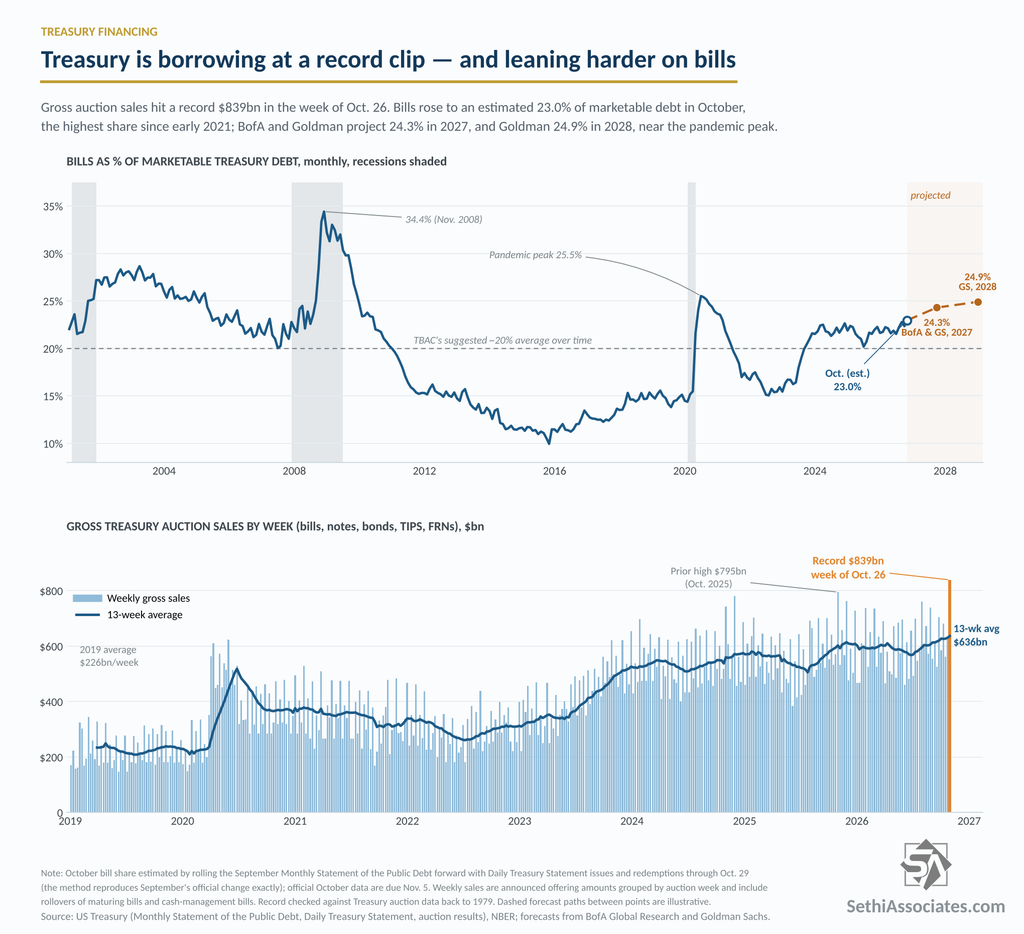
▪ Bills were 22.4% of marketable debt at the end of September. Rolling that forward with daily Treasury data puts October at ~23.0%, the highest since early 2021.
▪ BofA and Goldman already see 24.3% in 2027, and Goldman 24.9% in 2028, near the 25.5% pandemic peak. That’s before any shift out of the long end.
▪ For scale, Treasury sold ~$445B of nominal 20- and 30-year bonds over the past 12 months. Moving half of that into bills would add roughly 0.7 points a year to the bill share.
Heavier bill reliance is also why gross issuance is already at a record given they need to be rolled over frequently. Treasury auctioned $839B last week, the most in data back to 1979. The 13-week average is $636B, nearly 3x the 2019 average of $226B.
The downside of this moves to shorter maturities is that this leaves Treasury’s interest costs more exposed to swings in short-term rates, with the market pricing three more rate hikes from the Fed by the end of 2027. And while investors have piled into bills since the pandemic, there’s no assurance that demand will continue.
Bills outstanding have nearly tripled, from $2.6T in February 2020 to $7.1T in September. JPMorgan is already flagging early signs of stalling, and the stablecoin bid Treasury officials have touted has yet to show up at scale.
Treasury also updates its quarterly borrowing estimates this afternoon.
The rotation out of Tech continued last week. Now a packed week headlined by Apple on Monday, Tuesday’s midterm elections, and Friday’s jobs report test a market with thin gamma and CTAs near their sell triggers.
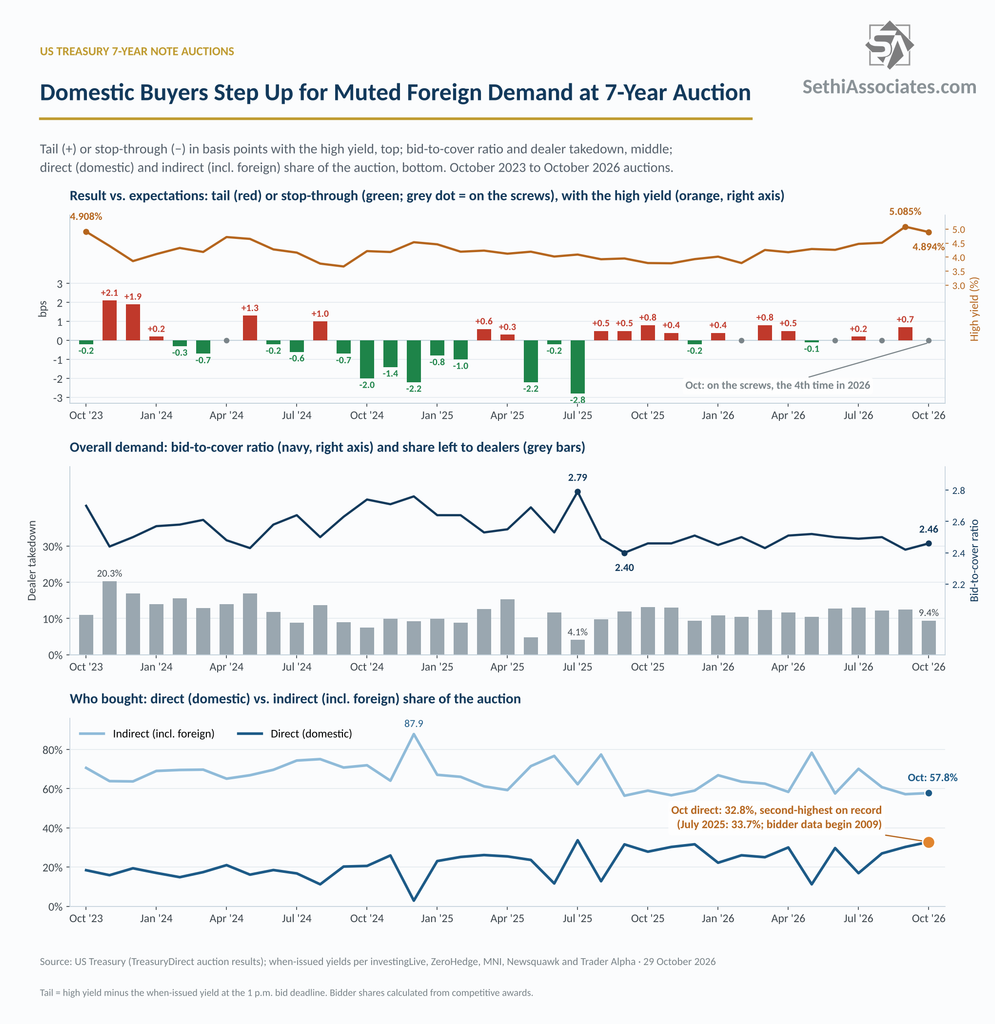
The last of this week’s three coupon (more than one year in maturity) Treasury auctions came today in $44 billion of 7-year notes, and it continued the week’s theme of domestic buyers picking up the slack from softer foreign demand.
At Monday’s 2-year, indirect bidders (which include foreign buyers) fell to the lowest since November 2021 as direct (domestic) bidders took a record share. Indirect demand recovered somewhat in Tuesday’s 5-year but was still below the six-month average, and today’s 7-year was a similar story but direct bidders took the second-largest share on record keeping the end result in line with expectations and leaving dealers with less than at either of the previous two auctions (9.4%, versus 13.0% at the 2-year and 10.6% at the 5-year)
The sale cleared at 4.894%, down from 5.085% in September (the highest on record for this maturity). It came in “on the screws” (right in line with expectations) against a when-issued of 4.894%, much better than the +0.7 basis point tail in September (the biggest since March), and versus a six-month average tail of +0.2 basis points. Interestingly, it was the fourth 7-year auction to price on the screws in 2026.
Looking at the rest of the metrics:
-Overall demand (bid/cover) rose to 2.46 from 2.42 in September, but stayed below the six-month average of 2.49.
-Indirect bidders (which include foreign buyers) edged up to 57.8% from 57.2% in September (the lowest since November 2025), but remained well below the six-month average of 63.7%.
-Direct (domestic) bidders jumped to 32.8%, the highest since July 2025 and the second-highest in Treasury data back to 2009 (after July 2025’s 33.7%), from 30.3% in September and well above the six-month average of 24.2%.
-That left dealers with 9.4%, the lowest since December 2025, down from 12.5% in September and below the six-month average of 12.1% (the record low was 4.1% in July 2025).
So at all three auctions this week, indirect bidders took a below-average share (45.7%, 60.0% and 57.8%), which was offset at least in part by direct bidders taking more (41.3%, 29.4% and 32.8%).
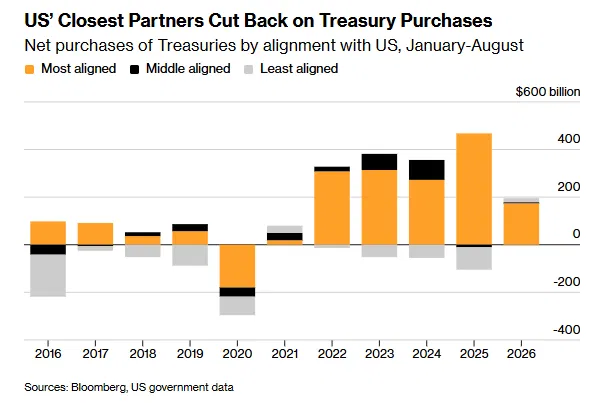
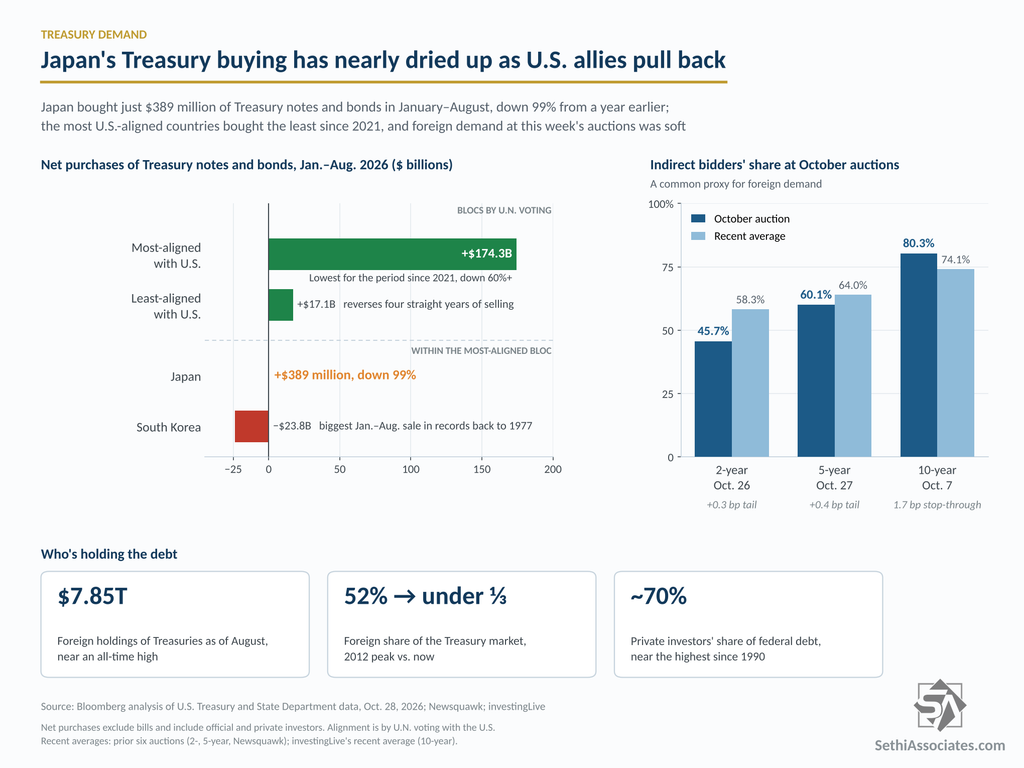
Countries most aligned with the U.S. bought a net $174.3 billion of Treasury notes and bonds in the first eight months of 2026, according to Bloomberg’s analysis of Treasury and State Department data. That’s the least for the period since 2021 and down more than 60% from a year earlier. Bloomberg ranks alignment by how often countries vote with the U.S. at the United Nations.
Asia led the retreat:
Japan, the biggest foreign holder, bought just $389 million, down 99% from a year earlier.
South Korea sold $23.8 billion, the most for the period in records going back to 1977.
Taiwan was also a net seller.
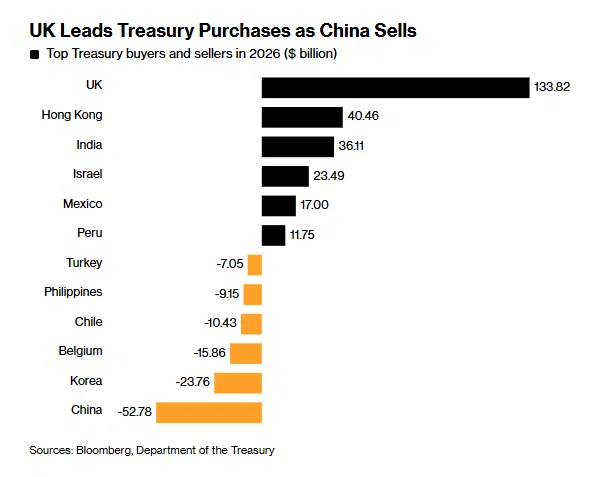
The least-aligned countries bought $17.1 billion, reversing four straight years of selling over the same period. China remained the biggest seller, while the UK, Hong Kong and India were the biggest buyers. The data cover both government and private investors, and Bloomberg notes that holdings can be credited to the country where they’re held through custodians rather than to the actual owner.
Bloomberg cites weak currencies, rising yields at home, growing demand for stocks and unease over U.S. policy as possible factors. The yen hit a four-decade low this year, and the won fell to its weakest since 2009.
“The Treasury market isn’t losing foreign buyers — it’s losing automatic buyers,” Masahiko Loo, a senior fixed-income strategist at State Street Investment Management, told Bloomberg.
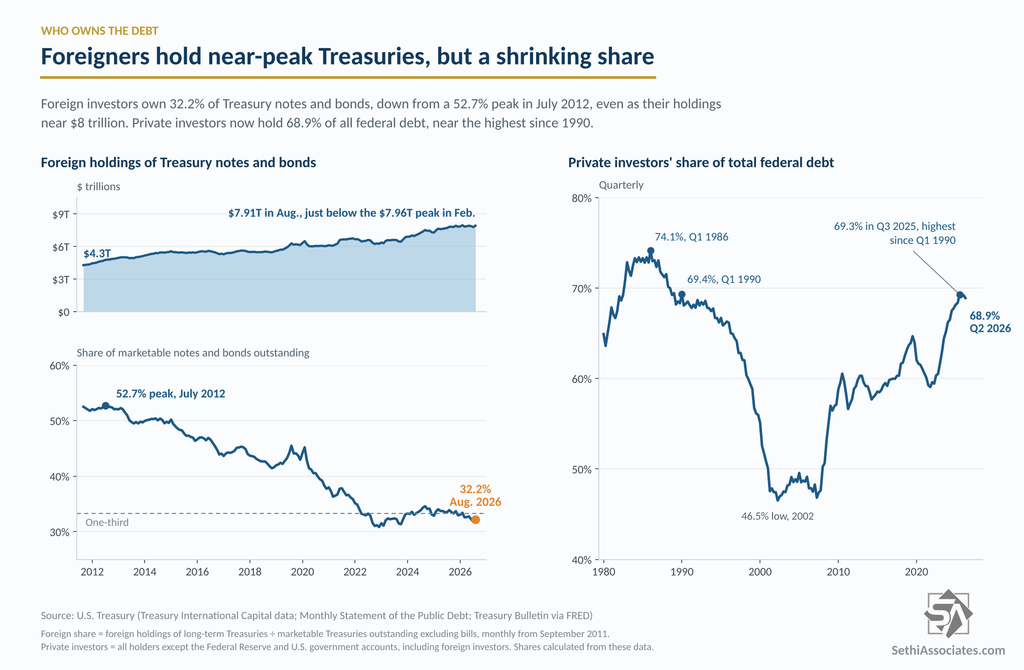
Private investors, including hedge funds, banks and mutual funds, have stepped in, lifting their share of federal debt to about 70%, near the highest since 1990. Foreigners still owned $7.85 trillion of Treasuries as of August, near a record. But their share of the market has shrunk to less than a third, from a peak of 52% in 2012.
The tradeoff is price. “The Treasury will fund itself — the question is the price and the volatility of the price,” said Shoki Omori, Deutsche Bank’s chief fixed-income strategist for Japan..
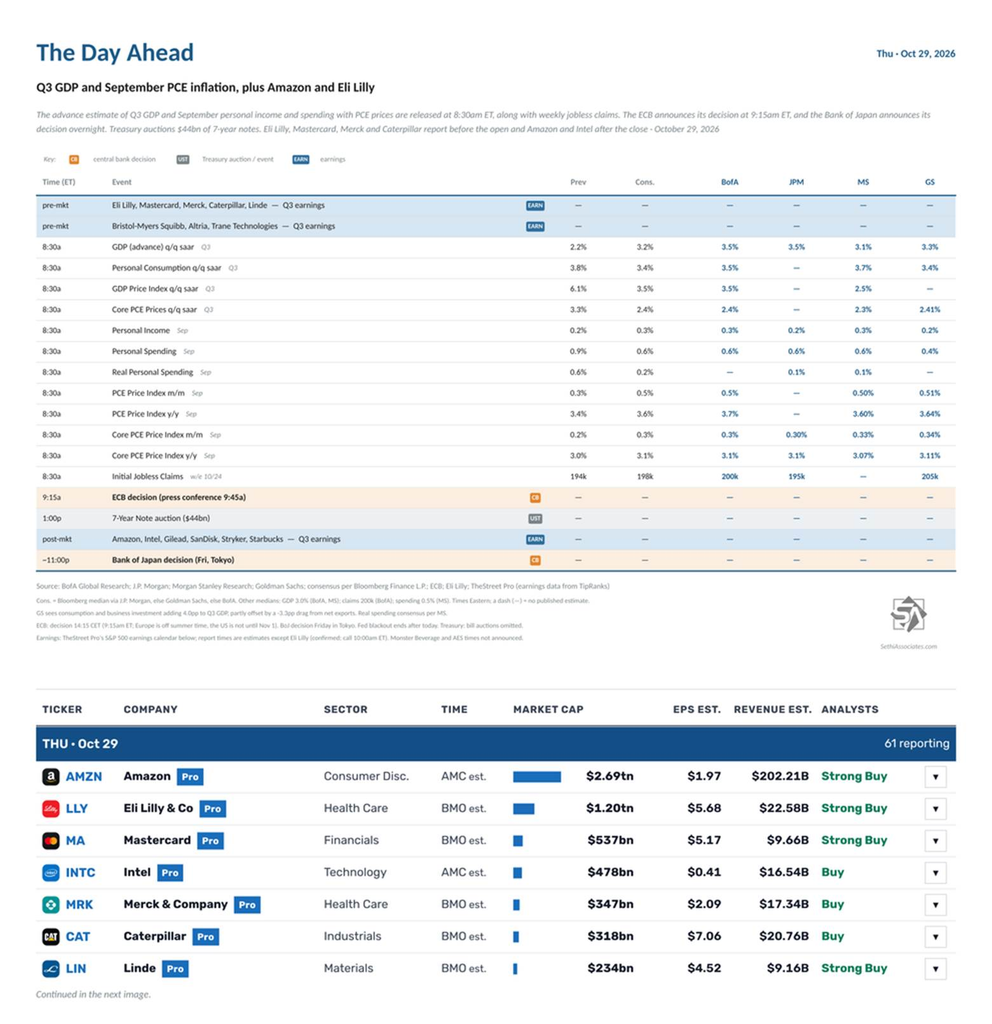
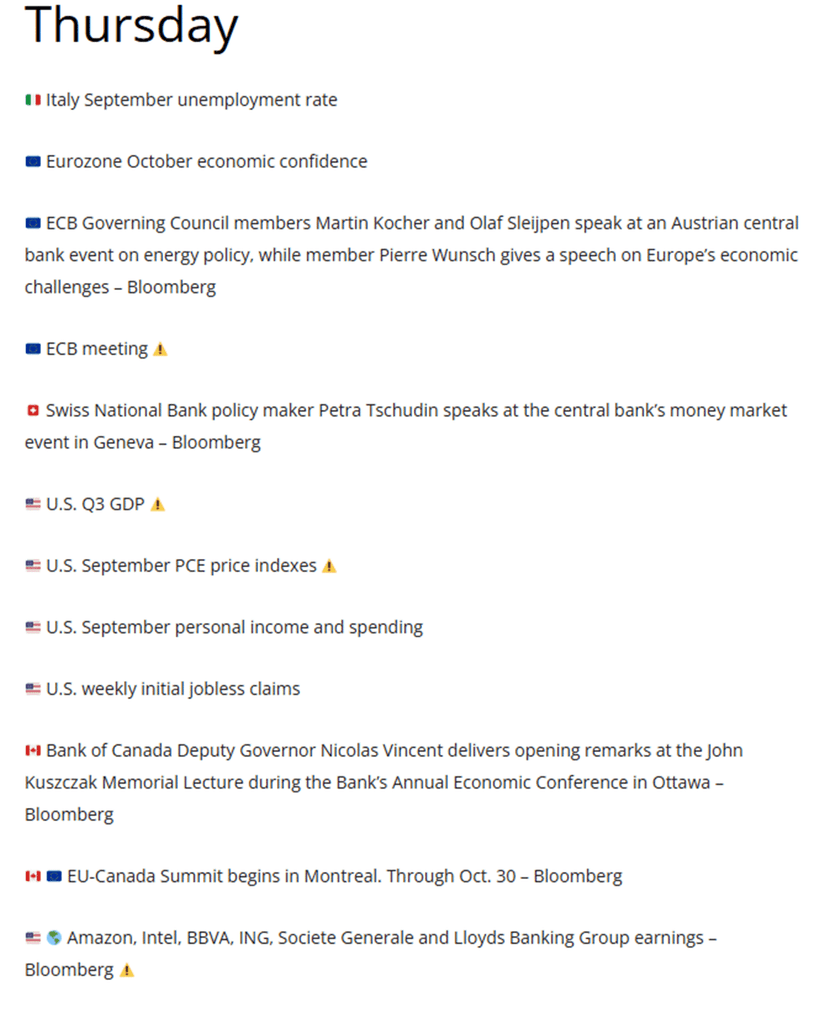
US economic data includes the advance estimate of Q3 GDP, which will incorporate September personal income and spending with PCE prices that will also be separately reported. We’ll also get weekly unemployment claims.
The Fed’s blackout period extends until midnight, with Fed speakers resuming Friday.
The non-Bill (>1yr in maturity) US Treasury auction is $44bn of 7-year notes.
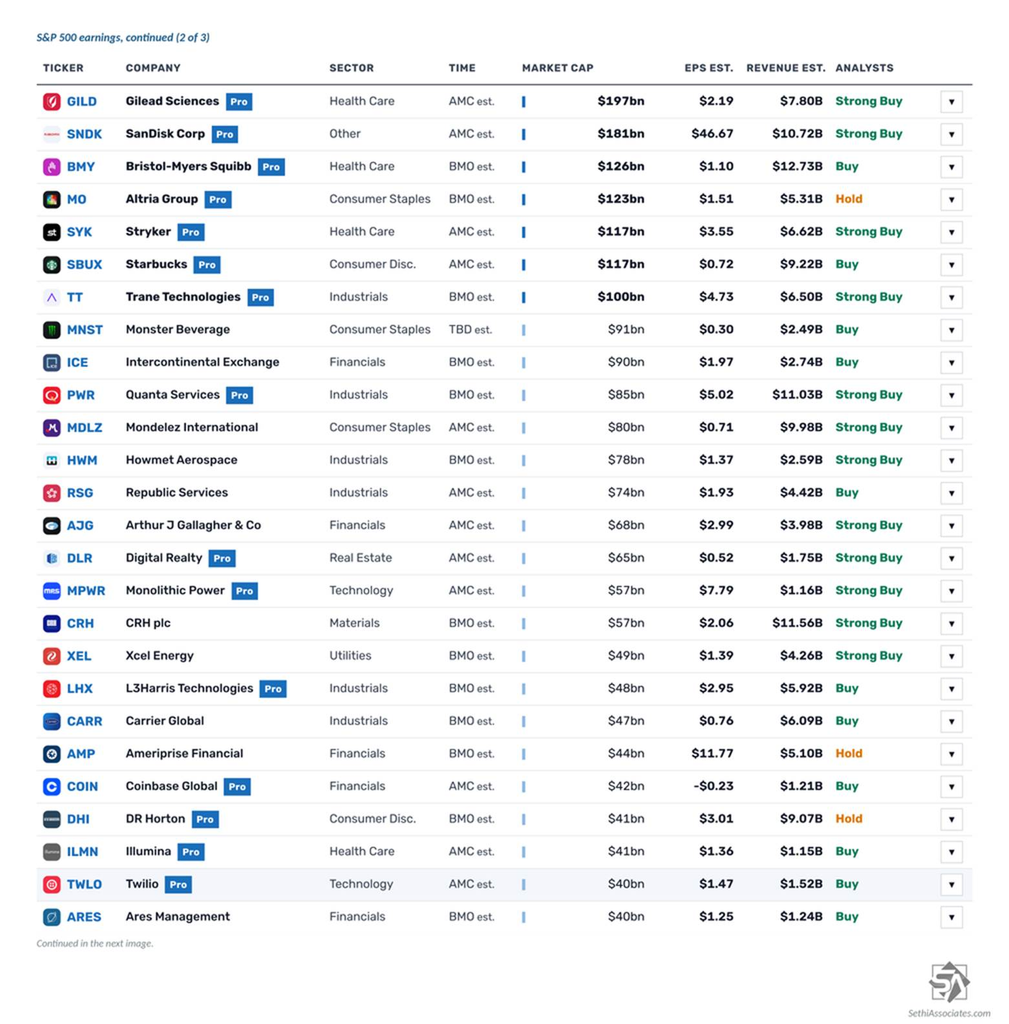
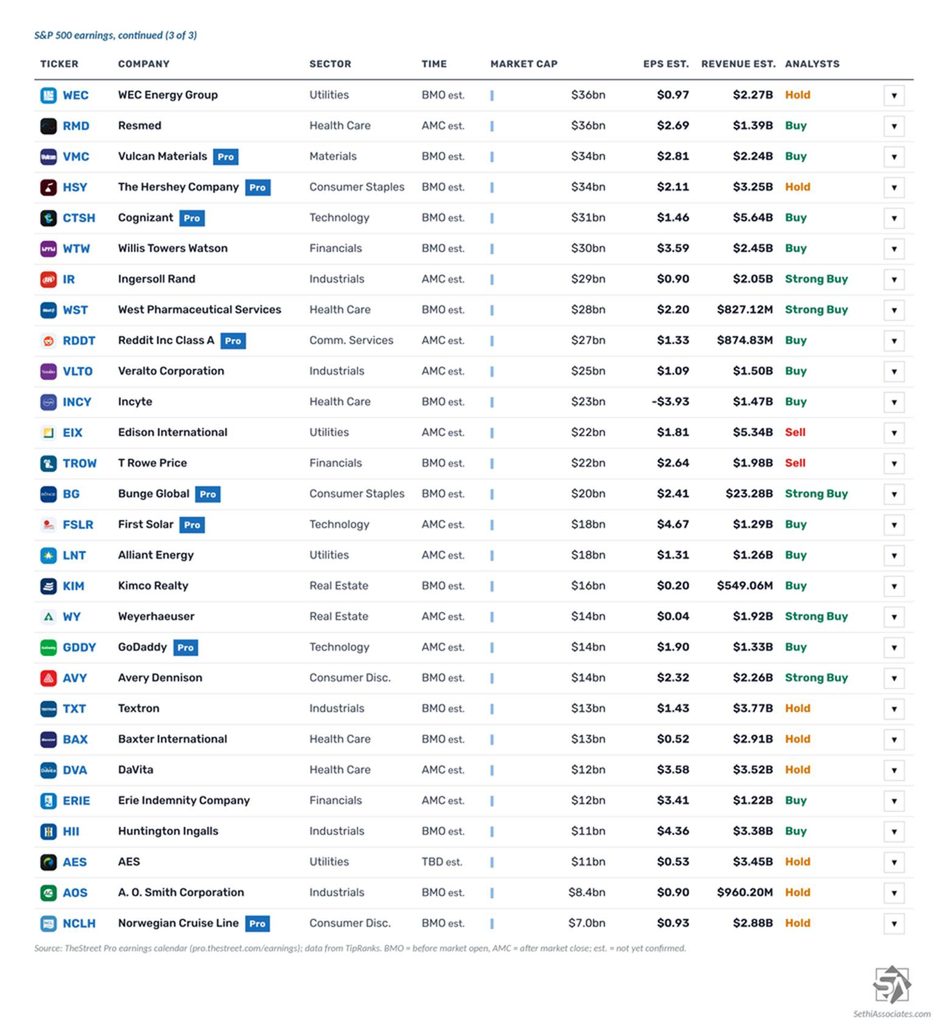
61 S&P 500 components report, 14 of them with market caps over $100bn:61 S&P 500 components report, 14 of them with market caps over $100bn:
Before the open: Eli Lilly ($LLY), Mastercard ($MA), Merck ($MRK), Caterpillar ($CAT), Linde ($LIN), Bristol Myers Squibb ($BMY), Altria ($MO), Trane Technologies ($TT), Intercontinental Exchange ($ICE), Quanta Services ($PWR), Howmet Aerospace ($HWM), CRH ($CRH), Xcel Energy ($XEL), L3Harris ($LHX), Carrier ($CARR), Ameriprise ($AMP), D.R. Horton ($DHI), Ares Management ($ARES), WEC Energy ($WEC), Vulcan Materials ($VMC), Hershey ($HSY), Cognizant ($CTSH), WTW ($WTW), West Pharmaceutical ($WST), Incyte ($INCY), T. Rowe Price ($TROW), Bunge ($BG), Kimco Realty ($KIM), Avery Dennison ($AVY), Textron ($TXT), Baxter ($BAX), Huntington Ingalls ($HII), A.O. Smith ($AOS) and Norwegian Cruise Line ($NCLH)
After the close: Amazon ($AMZN), Intel ($INTC), Gilead ($GILD), SanDisk ($SNDK), Stryker ($SYK), Starbucks ($SBUX), Mondelez ($MDLZ), Republic Services ($RSG), Arthur J. Gallagher ($AJG), Digital Realty ($DLR), Monolithic Power ($MPWR), Coinbase ($COIN), Illumina ($ILMN), Twilio ($TWLO), ResMed ($RMD), Ingersoll Rand ($IR), Reddit ($RDDT), Veralto ($VLTO), Edison International ($EIX), First Solar ($FSLR), Alliant Energy ($LNT), Weyerhaeuser ($WY), GoDaddy ($GDDY), DaVita ($DVA) and Erie Indemnity ($ERIE)
Time not announced: Monster Beverage ($MNST) and AES ($AES)
Outside the US, Shell ($SHEL), TotalEnergies ($TTE) and Volkswagen ($VWAGY) report.
Ex-US highlights include a policy decision from the ECB, UK September net consumer credit and M4, Japan October consumer confidence index, Italy September unemployment rate, October consumer confidence index, economic sentiment and manufacturing confidence, Eurozone October economic confidence and Sweden Q3 GDP indicator.
The Fed held rates steady with two hawkish dissents, Oracle’s aggressive long-term targets lifted AI names, but Alphabet fell about 9% after missing expectations.
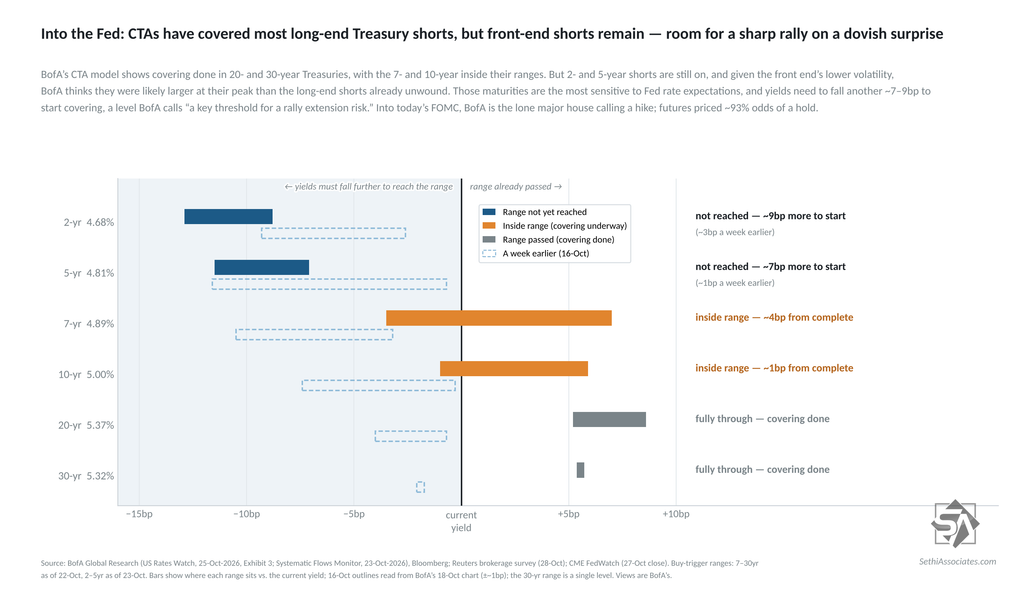
Into today’s FOMC, BofA’s CTA model shows while trend followers have mostly covered their long-maturity Treasury shorts, there remains a healthy amount of short-maturity shorts which could be at risk from a dovish Warsh:
▪ 20- and 30-year: covering done ▪ 7- and 10-year: inside their covering ranges, the 10-year ~1bp from finishing ▪ 2- and 5-year: shorts still on
The 2-year in particular is highly sensitive to Fed rate expectations. Because the front end is less volatile, BofA thinks those shorts were likely larger at their peak than the long-end ones already unwound. Yields there need to fall another ~7–9bp to start covering, a level BofA calls the “key threshold for a rally extension risk.”
So an unexpectedly dovish Fed could set off a sharp move lower in front-end yields, as covering adds to the rally.
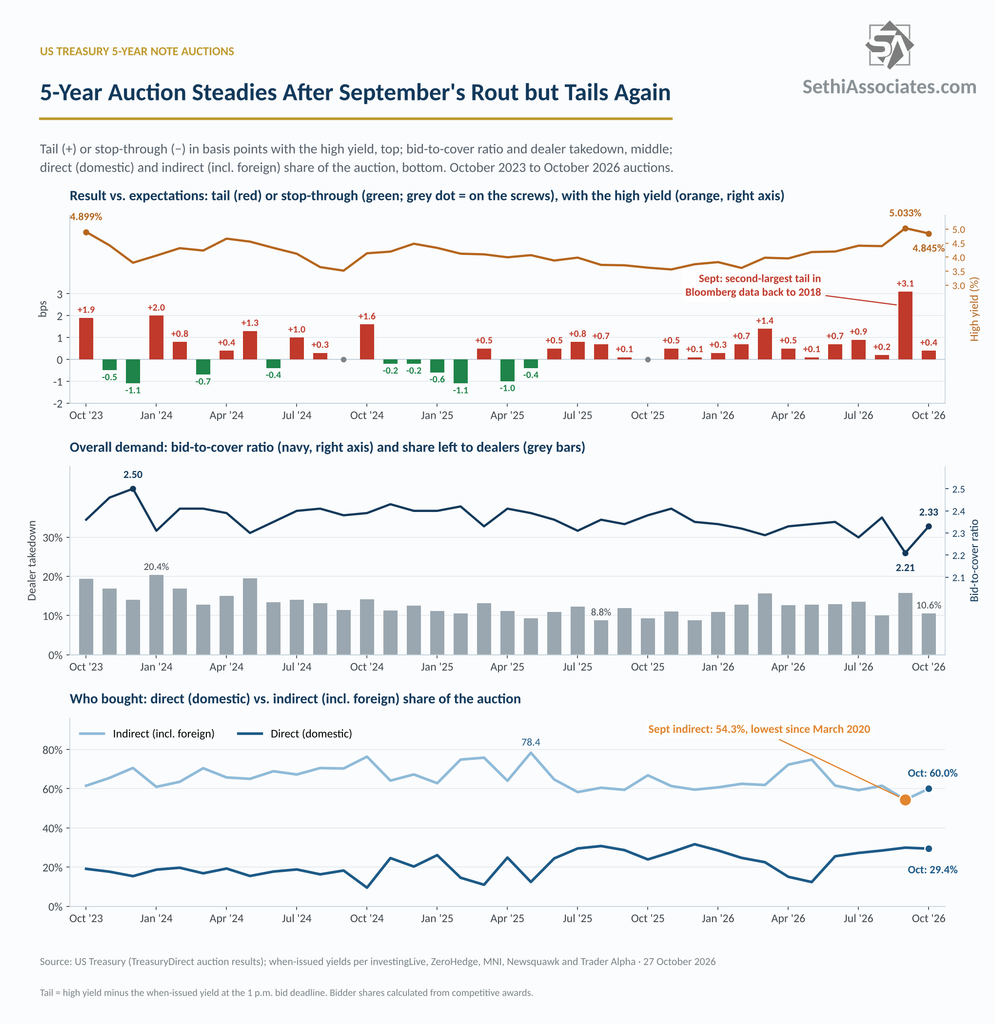
Foreign buyers weren’t interested in Monday’s 2-year Treasury auction, where indirect bidders (which include foreign buyers) fell to the lowest since November 2021 as direct (domestic) bidders took a record share. They were more so, though, in today’s $70 billion 5-year auction, the second of this week’s three coupon auctions (more than one year in maturity). That lead to better overall demand, even more so compared with September’s historically bad auction, even as the end result was the 12th straight tail (yield above expectations) for this maturity.
Looking at the specifics:
-The sale cleared at 4.845%, down from 5.033% in September (the first 5%-plus for this maturity since 2007), and tailed by +0.4 basis points. That was a big improvement from +3.1 basis points in September, the second-largest in Bloomberg data back to 2018, and better than the six-month average of +0.9 basis points. But it was still the 12th straight tail (the last auction that didn’t tail was October 2025, which priced “on the screws”) and the 17th straight auction without a stop-through (the last was May 2025).
-Overall demand (bid/cover) rose to 2.33 from 2.21 in September (the lowest since December 2018), slightly better than the six-month average of 2.31.
-Indirect bidders (which include foreign buyers) recovered to 60.0% from 54.3% in September (the lowest since March 2020), but stayed below the six-month average of 64.0%.
-Direct (domestic) bidders took 29.4%, down slightly from 29.9% in September (the highest since December 2025), but well above the six-month average of 23.1%.
-That left dealers with 10.6%, the lowest since August, down from 15.8% in September (the most since May 2024) and better than the six-month average of 13.0%.
Overall, it was clearly not a great auction given the tail, but it was better than Monday’s 2-year and much, much better than last month’s auction.