2-Year Auction Sees Foreign Bid Ease but Record Domestic Demand

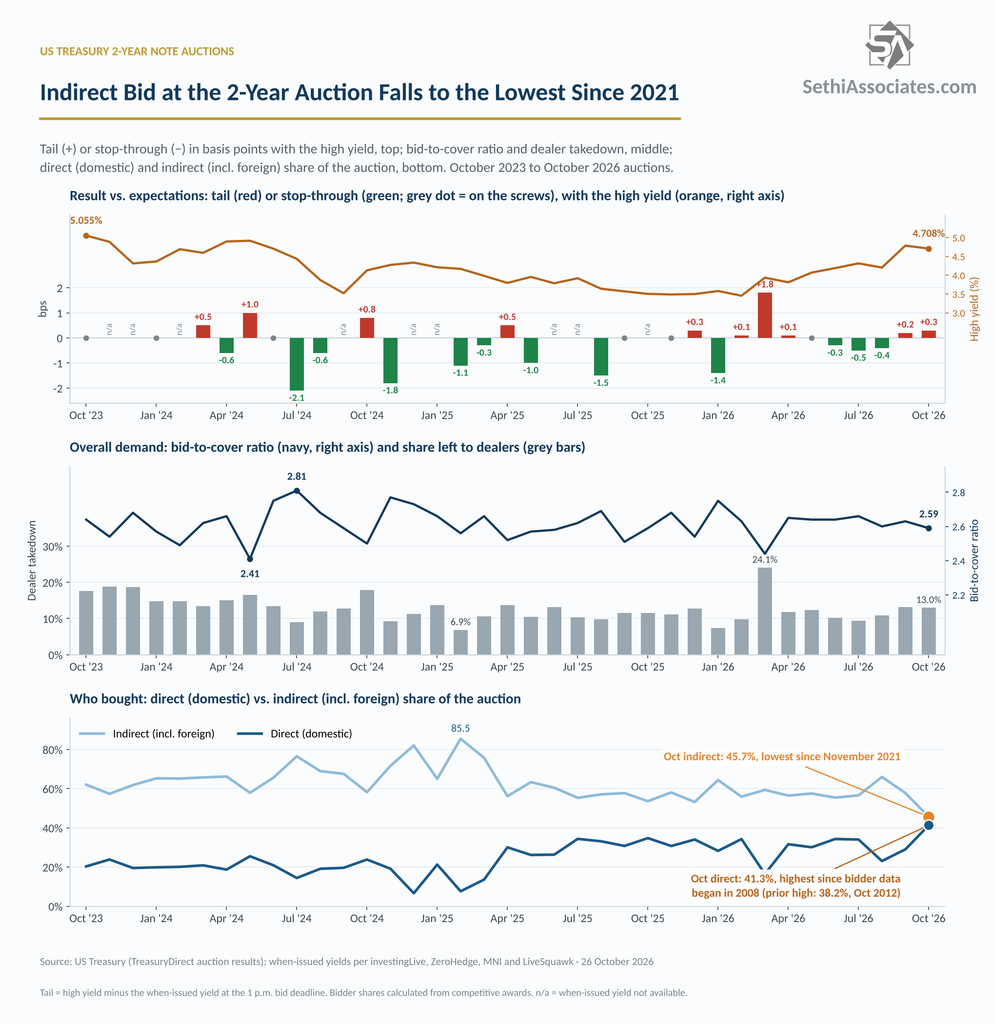
The first of this week’s three coupon (>1 year in maturity) Treasury auctions came today in $69 billion of 2-year notes, and while the end result was a bit soft, the mix of buyers stood out. Direct (domestic) bidders ended up with a record share after indirect bidders, a group that includes foreign buyers, fell to the lowest since November 2021.

The sale cleared at 4.708%, down from 4.787% in September, which was the highest since May 2024, and tailed (came in above expectations) by +0.3bps against a when-issued of 4.705%. That was the second straight tail, after +0.2bps in September, and compares with a 6-mth avg of a -0.2bps stop-through.

Looking at the rest of the metrics:

-Overall demand (bid/cover) fell to 2.59, the lowest since March, from 2.63 in September and below the 6-mth avg of 2.64.

-Indirect bidders (which include foreign buyers) dropped to 45.7%, the lowest since November 2021, from 57.8% in September and well below the six-month average of 58.3%.

-Direct (domestic) bidders jumped to 41.3%, the highest in Treasury data going back to 2008 (easily topping 38.2% in October 2012), from 29.0% in September and well above the six-month average of 30.4%.

-That left dealers (another metric of the strength of demand – the lower the better) with 13.0%, down from 13.2% in September but above the six-month average of 11.3%.

The indirect drop is worth watching, and comes on the heels of my post this morning about concerns that Japanese investors may be stepping back from Treasuries. Indirect bidders also include US funds, though, so Treasury’s investor-class data for October, released with a lag, will show how much of the pullback was actually foreign.
Is Japan Selling of Treasuries a Risk?

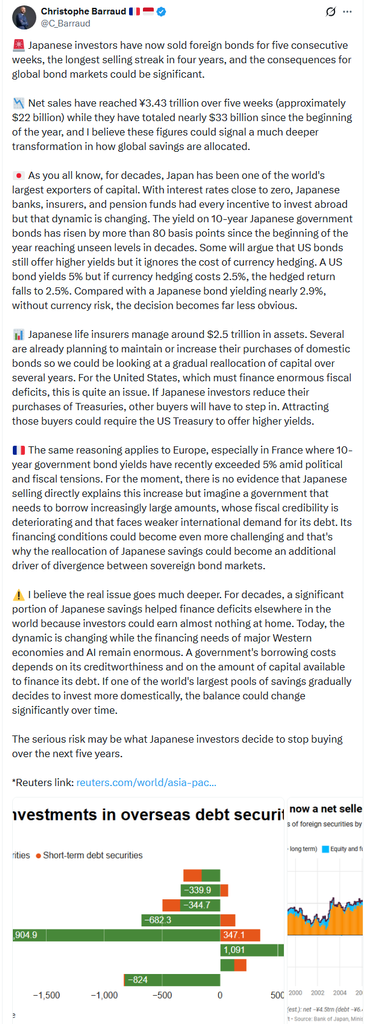
Economic analyst Christophe Barraud, Head of Discretionary Management and Research at LIOR GP, had an X post last week with his thoughts on the selling by Japanese investors in global bonds “for five consecutive weeks, the longest selling streak in four years.” [post at the bottom].

As he noted, “the consequences for global bond markets could be significant,” with Japanese yields now trading above US equivalents once hedging costs are taken into account.

“Japanese life insurers manage around $2.5 trillion in assets. Several are already planning to maintain or increase their purchases of domestic bonds so we could be looking at a gradual reallocation of capital over several years.”

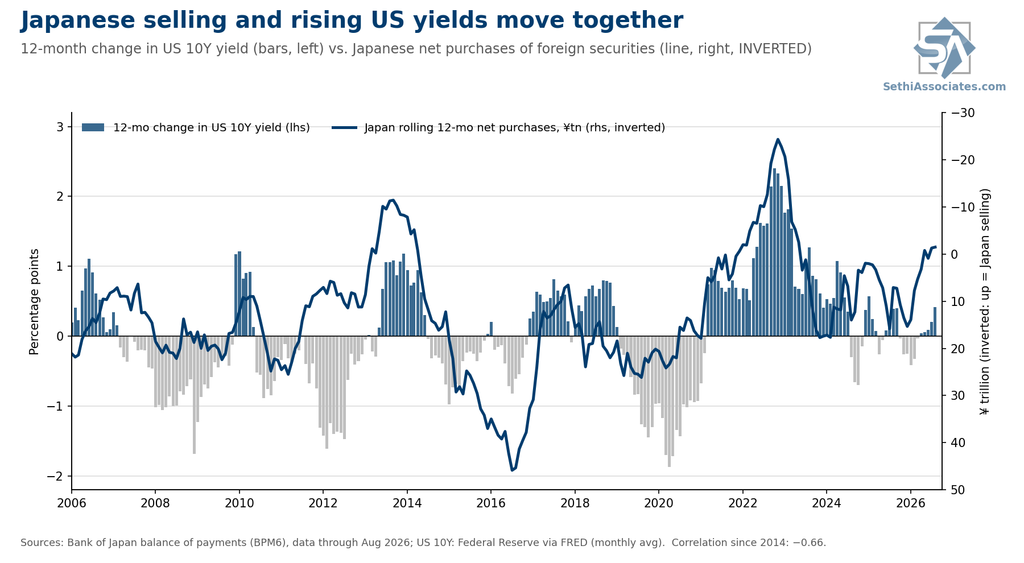
Given that backdrop, I had Claude do an analysis of how Japan’s flows line up with US 10-year yields, using Bank of Japan data on Japanese net purchases of foreign securities. Its takeaways were consistent with the risk Christophe flagged:

1. Japan flows do have a strong correlation with the change in 10-year yields. Comparing rolling 12-month net purchases to the 12-month change in the US 10Y results in a correlation of about −0.66 since 2014. That is consistent with Japanese selling driving yields. The 2013 taper tantrum and 2022 stand out.

2. Neither series, though, conclusively leads the other; the fit is tightest when both are measured over the same period. So while that’s consistent with Japanese selling pushing yields up (which makes a lot of sense), it is equally consistent with sharp rises/drops in yields and hedging costs pushing/pulling Japanese investors out/in. In 2022, the cost of hedging dollars back into yen went from roughly 0.2% to over 4%, and Japan sold a record amount of foreign bonds.

3. Flows have little correlation with a given level of 10-year yields. The correlation between Japan’s rolling 12-month net purchases and the US 10Y level is weak: about −0.14 since 1997 and −0.4 since 2014.

So it seems the reallocation risk is very real if higher Japanese yields do pull flows back home.

A Quiet Start to the Week

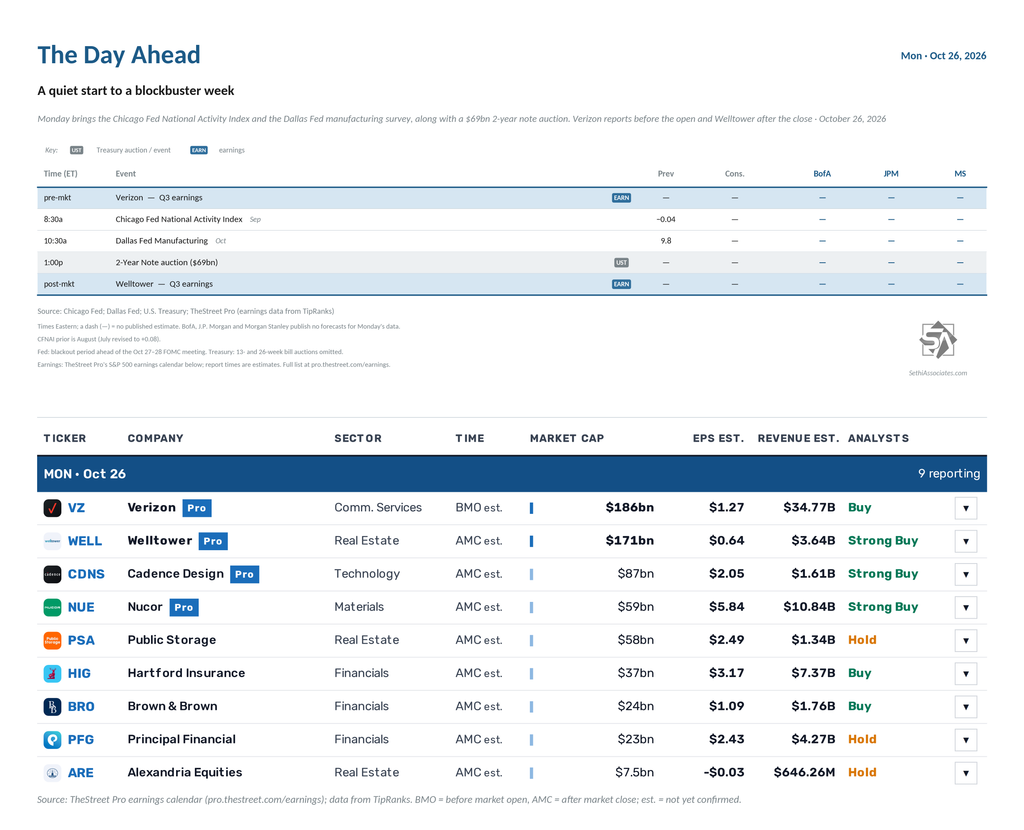
It’s a quiet start to a busy week for US economic data, with October’s Dallas Fed manufacturing survey and September’s Chicago Fed National Activity Index the only reports.

The Fed remains in its blackout period ahead of the October 27–28 FOMC meeting, so there are no Fed speakers.

Non-Bill (>1yr in maturity) US Treasury auctions include a $69bn 2-year note auction.

Nine S&P 500 components report, two of them with market caps over $100bn:

  • Before the open: Verizon ($VZ)
  • After the close: Welltower ($WELL), Cadence Design Systems ($CDNS), Nucor ($NUE), Public Storage ($PSA), The Hartford ($HIG), Brown & Brown ($BRO), Principal Financial ($PFG) and Alexandria Real Estate Equities ($ARE)

Tech Selloff Deepens as Market Rotation Continues

Another selloff in AI names broadened to encompass most of Tech, sending the Nasdaq-100 to its worst week since April 2025. Five sectors though would finish the week up 2% or more, as 30-year Treasury yields fell the most since April 2025.