Watch These Key Levels for the Nasdaq, Treasuries, Tesla, and Alphabet


On Thursday, the Dow Jones fell 1%, and the S&P 500 lost 1.2%. Not a good day, but not a disaster by any means.
However, the Nasdaq Composite, led lower by Alphabet ($GOOGL) and Tesla ($TSLA), suffered a 2.15% loss. Now technicians are pointing to an ominous pattern that is emerging on the Nasdaq’s chart. That pattern is a descending triangle (black lines), a bearish formation that suggests further downside for the tech-laden index.
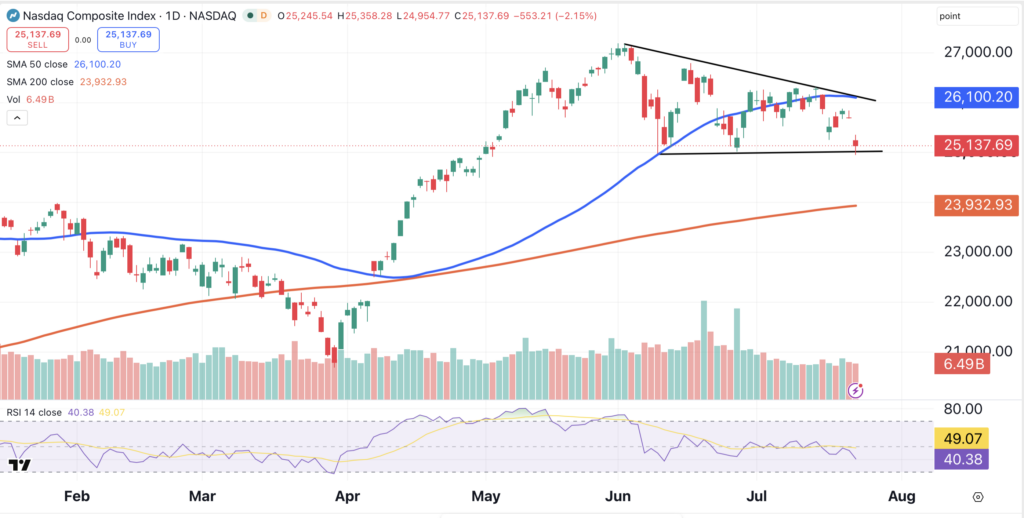
The Nasdaq has already closed beneath its 50-day moving average (blue) for six consecutive sessions. The bearish pattern suggests that the Nasdaq could soon pay a visit to its 200-day moving average (red), located just below 24,000.
Treasury Yields Keep Rising
In addition to rising crude oil prices, the yields on U.S. Treasuries are weighing on stocks.
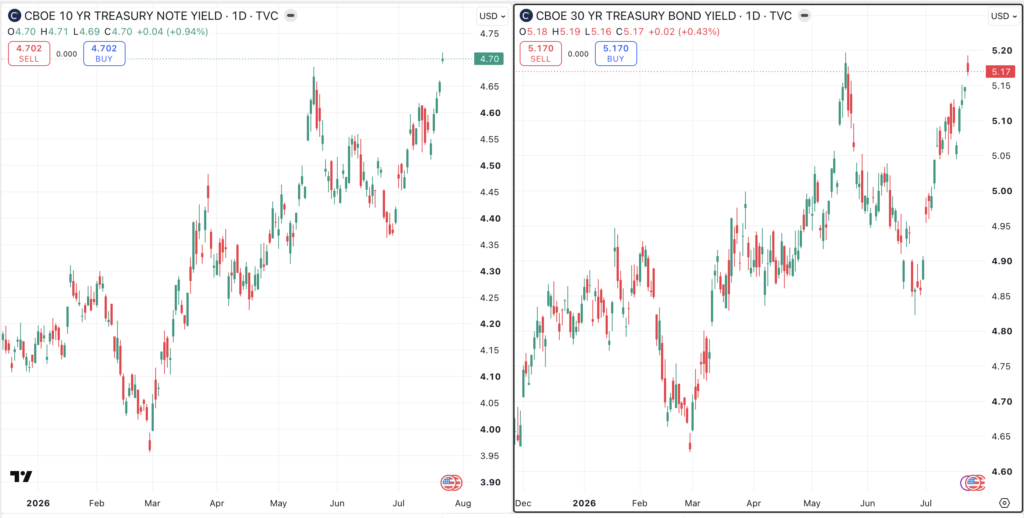
On the left side, we see the yield on the 10-year Treasury note at 4.70%, its highest yield in over a year. On the right, we see the yield on the 30-year Treasury bond flirting with multi-year highs.
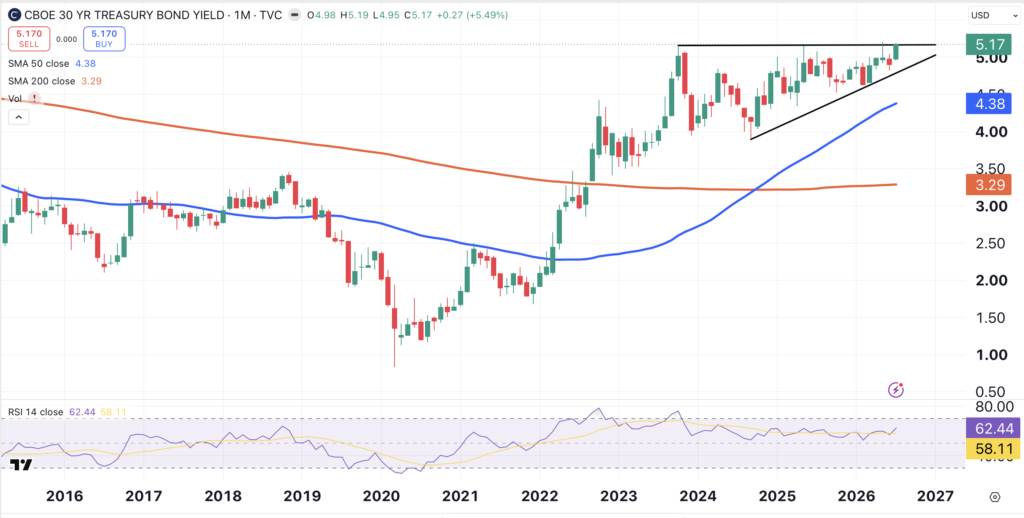
For some perspective on the 30-year T-bond’s yield, let’s go to the monthly chart. Here, we see a huge ascending triangle, three years in the making (black lines). The monthly chart suggests we could be on the verge of a breakout in the 30-year’s yield.
Tesla Stalls Out
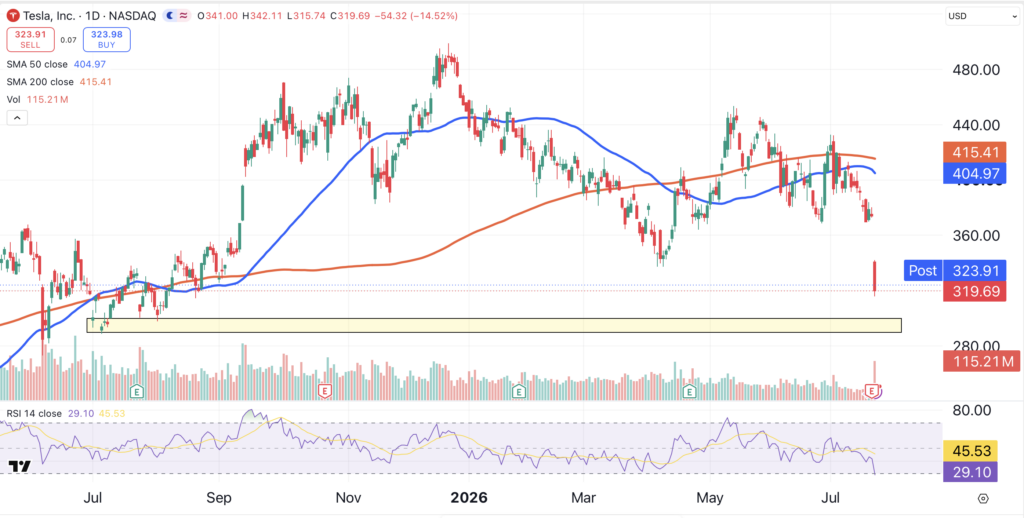
Tesla was crushed on Thursday for a 14.5% loss. I consider Tesla a long-term hold, even though the stock is now trading at its lowest level in nearly a year.
Is this Tesla selloff a buying opportunity? I’d be patient. We can’t ignore the huge turnover on Thursday’s decline, as Tesla saw its highest volume of the year so far. That volume spike indicates that institutional investors are lightening up on the stock.
Where will Tesla shares find support? I’ve got my eye on the area between $287 and $300 (shaded yellow). If the stock stabilizes in that area, I’ll consider adding to my Tesla position.
Alphabet Opportunity Upcoming?
Tesla wasn’t the only tech titan that took it on the chin on Thursday, as shares of Alphabet fell by nearly 7%. As a result, Alphabet closed below its 200-day moving average (red) for the first time in over a year (circled).
This stock may find support in the $275 area, the site of a bounce in late March (arrow). We might use that area for an entry point, depending on the stock’s price action as well as overall market behavior.
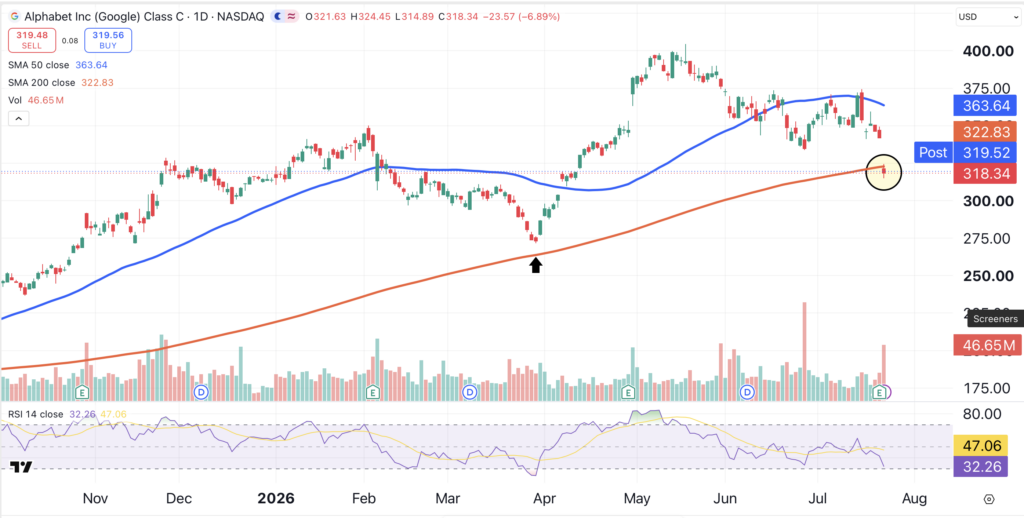
In a sense, Alphabet is a victim of its own success. The stock’s 66% return over the past 12 months means Alphabet is currently stretched well above meaningful support.
At the time of publication, Ponsi was long TSLA.
