7-Year Auction: Foreign Demand Stays Soft but Domestic Demand Steps Up

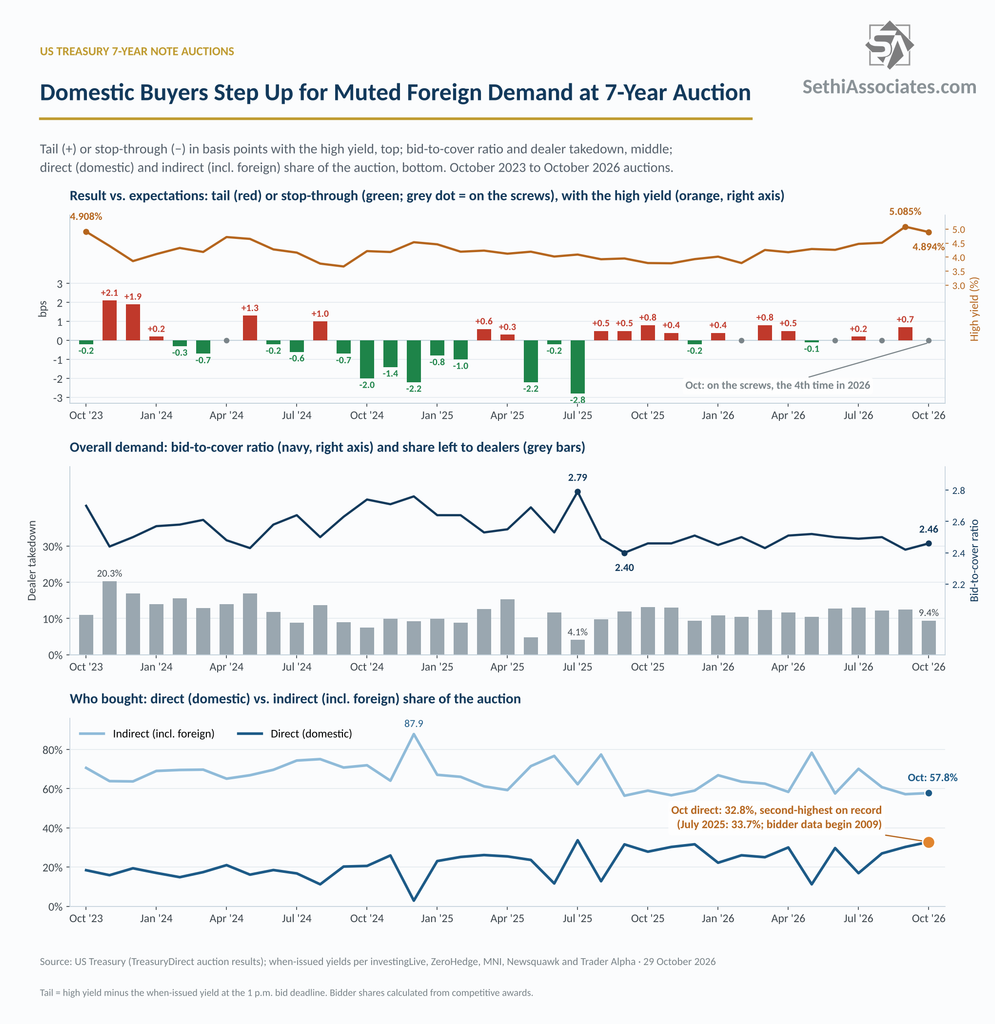
The last of this week’s three coupon (more than one year in maturity) Treasury auctions came today in $44 billion of 7-year notes, and it continued the week’s theme of domestic buyers picking up the slack from softer foreign demand.

At Monday’s 2-year, indirect bidders (which include foreign buyers) fell to the lowest since November 2021 as direct (domestic) bidders took a record share. Indirect demand recovered somewhat in Tuesday’s 5-year but was still below the six-month average, and today’s 7-year was a similar story but direct bidders took the second-largest share on record keeping the end result in line with expectations and leaving dealers with less than at either of the previous two auctions (9.4%, versus 13.0% at the 2-year and 10.6% at the 5-year)

The sale cleared at 4.894%, down from 5.085% in September (the highest on record for this maturity). It came in “on the screws” (right in line with expectations) against a when-issued of 4.894%, much better than the +0.7 basis point tail in September (the biggest since March), and versus a six-month average tail of +0.2 basis points. Interestingly, it was the fourth 7-year auction to price on the screws in 2026.

Looking at the rest of the metrics:

-Overall demand (bid/cover) rose to 2.46 from 2.42 in September, but stayed below the six-month average of 2.49.

-Indirect bidders (which include foreign buyers) edged up to 57.8% from 57.2% in September (the lowest since November 2025), but remained well below the six-month average of 63.7%.

-Direct (domestic) bidders jumped to 32.8%, the highest since July 2025 and the second-highest in Treasury data back to 2009 (after July 2025’s 33.7%), from 30.3% in September and well above the six-month average of 24.2%.

-That left dealers with 9.4%, the lowest since December 2025, down from 12.5% in September and below the six-month average of 12.1% (the record low was 4.1% in July 2025).

So at all three auctions this week, indirect bidders took a below-average share (45.7%, 60.0% and 57.8%), which was offset at least in part by direct bidders taking more (41.3%, 29.4% and 32.8%).
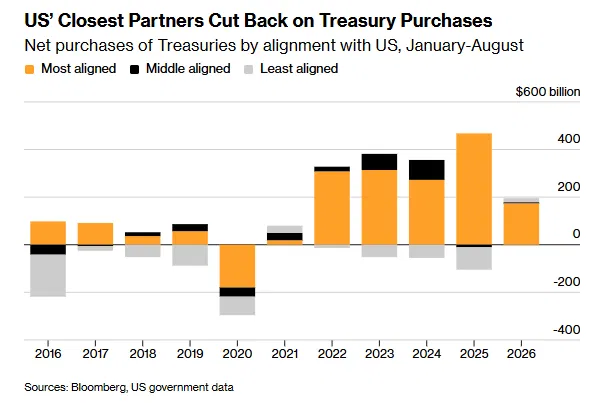
Japan’s Treasury Buying Nearly Dries Up as America’s Allies Pull Back

On Monday, I asked whether Japanese selling of Treasuries is a risk. Today, Bloomberg reported that the risk may be much broader than just Japan.

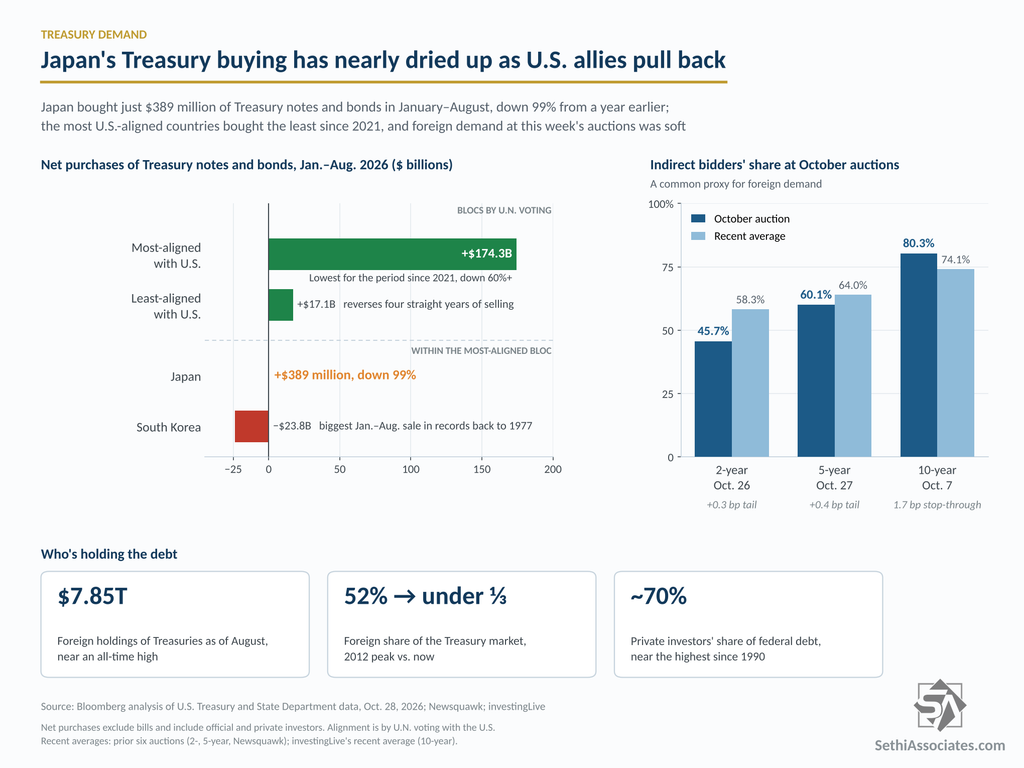
Countries most aligned with the U.S. bought a net $174.3 billion of Treasury notes and bonds in the first eight months of 2026, according to Bloomberg’s analysis of Treasury and State Department data. That’s the least for the period since 2021 and down more than 60% from a year earlier. Bloomberg ranks alignment by how often countries vote with the U.S. at the United Nations.

Asia led the retreat:

  • Japan, the biggest foreign holder, bought just $389 million, down 99% from a year earlier.
  • South Korea sold $23.8 billion, the most for the period in records going back to 1977.
  • Taiwan was also a net seller.

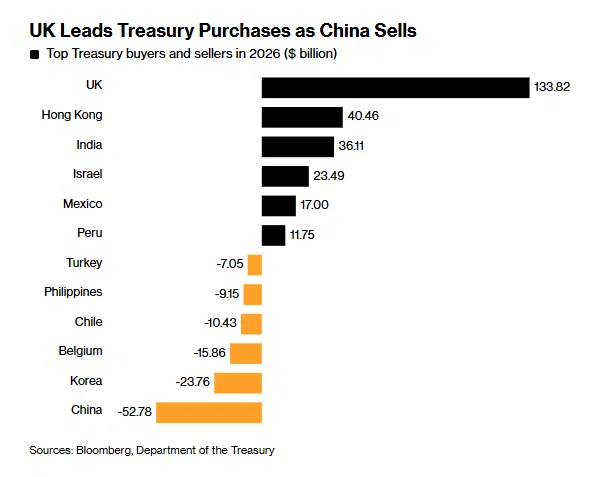
The least-aligned countries bought $17.1 billion, reversing four straight years of selling over the same period. China remained the biggest seller, while the UK, Hong Kong and India were the biggest buyers. The data cover both government and private investors, and Bloomberg notes that holdings can be credited to the country where they’re held through custodians rather than to the actual owner.

Bloomberg cites weak currencies, rising yields at home, growing demand for stocks and unease over U.S. policy as possible factors. The yen hit a four-decade low this year, and the won fell to its weakest since 2009.

“The Treasury market isn’t losing foreign buyers — it’s losing automatic buyers,” Masahiko Loo, a senior fixed-income strategist at State Street Investment Management, told Bloomberg.

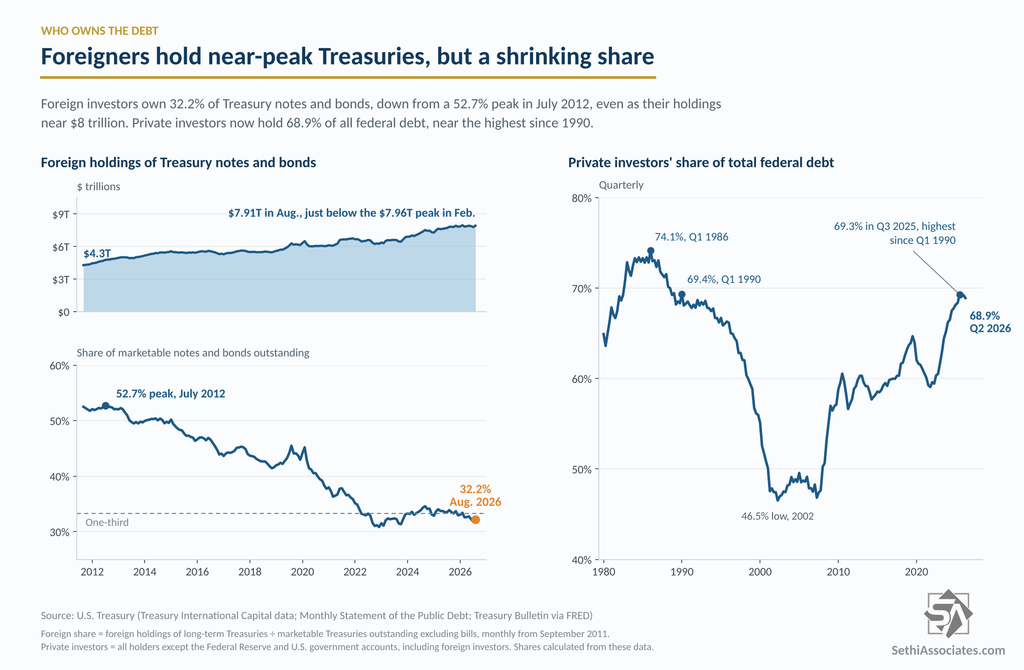
Private investors, including hedge funds, banks and mutual funds, have stepped in, lifting their share of federal debt to about 70%, near the highest since 1990. Foreigners still owned $7.85 trillion of Treasuries as of August, near a record. But their share of the market has shrunk to less than a third, from a peak of 52% in 2012.

The tradeoff is price. “The Treasury will fund itself — the question is the price and the volatility of the price,” said Shoki Omori, Deutsche Bank’s chief fixed-income strategist for Japan..

2-Year Treasury Shorts at Risk?

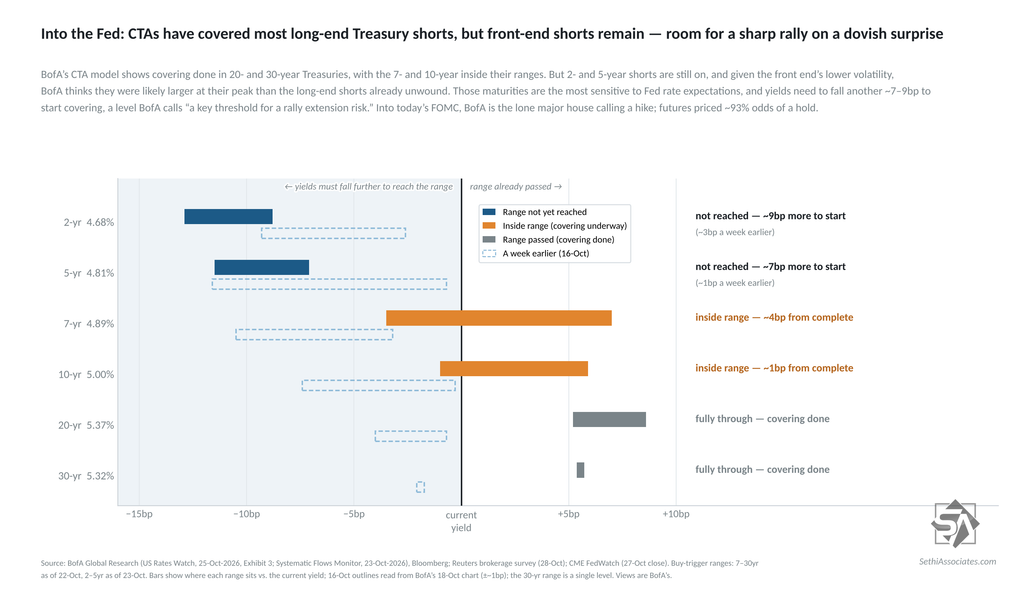
Into today’s FOMC, BofA’s CTA model shows while trend followers have mostly covered their long-maturity Treasury shorts, there remains a healthy amount of short-maturity shorts which could be at risk from a dovish Warsh:

▪ 20- and 30-year: covering done
▪ 7- and 10-year: inside their covering ranges, the 10-year ~1bp from finishing
▪ 2- and 5-year: shorts still on

The 2-year in particular is highly sensitive to Fed rate expectations. Because the front end is less volatile, BofA thinks those shorts were likely larger at their peak than the long-end ones already unwound. Yields there need to fall another ~7–9bp to start covering, a level BofA calls the “key threshold for a rally extension risk.”

So an unexpectedly dovish Fed could set off a sharp move lower in front-end yields, as covering adds to the rally.

5-Year Auction Tails but Big Improvement from September’s Rout

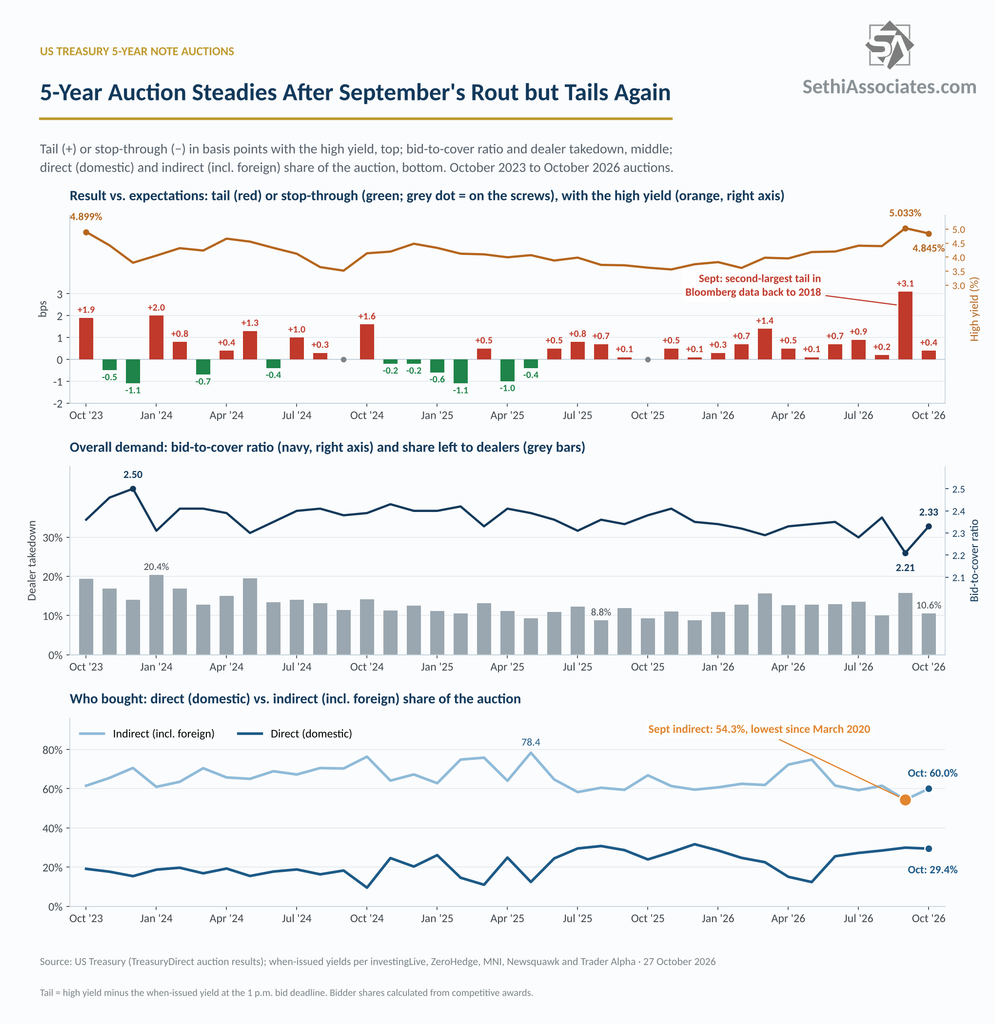
Foreign buyers weren’t interested in Monday’s 2-year Treasury auction, where indirect bidders (which include foreign buyers) fell to the lowest since November 2021 as direct (domestic) bidders took a record share. They were more so, though, in today’s $70 billion 5-year auction, the second of this week’s three coupon auctions (more than one year in maturity). That lead to better overall demand, even more so compared with September’s historically bad auction, even as the end result was the 12th straight tail (yield above expectations) for this maturity.

Looking at the specifics:

-The sale cleared at 4.845%, down from 5.033% in September (the first 5%-plus for this maturity since 2007), and tailed by +0.4 basis points. That was a big improvement from +3.1 basis points in September, the second-largest in Bloomberg data back to 2018, and better than the six-month average of +0.9 basis points. But it was still the 12th straight tail (the last auction that didn’t tail was October 2025, which priced “on the screws”) and the 17th straight auction without a stop-through (the last was May 2025).

-Overall demand (bid/cover) rose to 2.33 from 2.21 in September (the lowest since December 2018), slightly better than the six-month average of 2.31.

-Indirect bidders (which include foreign buyers) recovered to 60.0% from 54.3% in September (the lowest since March 2020), but stayed below the six-month average of 64.0%.

-Direct (domestic) bidders took 29.4%, down slightly from 29.9% in September (the highest since December 2025), but well above the six-month average of 23.1%.

-That left dealers with 10.6%, the lowest since August, down from 15.8% in September (the most since May 2024) and better than the six-month average of 13.0%.

Overall, it was clearly not a great auction given the tail, but it was better than Monday’s 2-year and much, much better than last month’s auction.

Is Japan Selling of Treasuries a Risk?

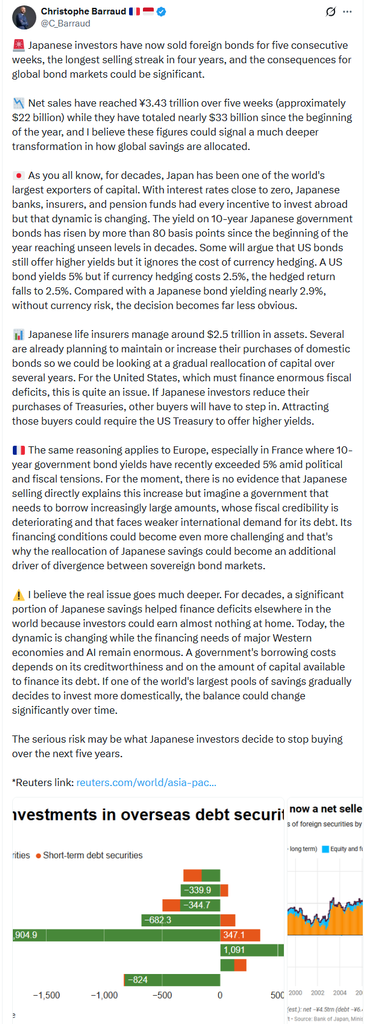
Economic analyst Christophe Barraud, Head of Discretionary Management and Research at LIOR GP, had an X post last week with his thoughts on the selling by Japanese investors in global bonds “for five consecutive weeks, the longest selling streak in four years.” [post at the bottom].

As he noted, “the consequences for global bond markets could be significant,” with Japanese yields now trading above US equivalents once hedging costs are taken into account.

“Japanese life insurers manage around $2.5 trillion in assets. Several are already planning to maintain or increase their purchases of domestic bonds so we could be looking at a gradual reallocation of capital over several years.”

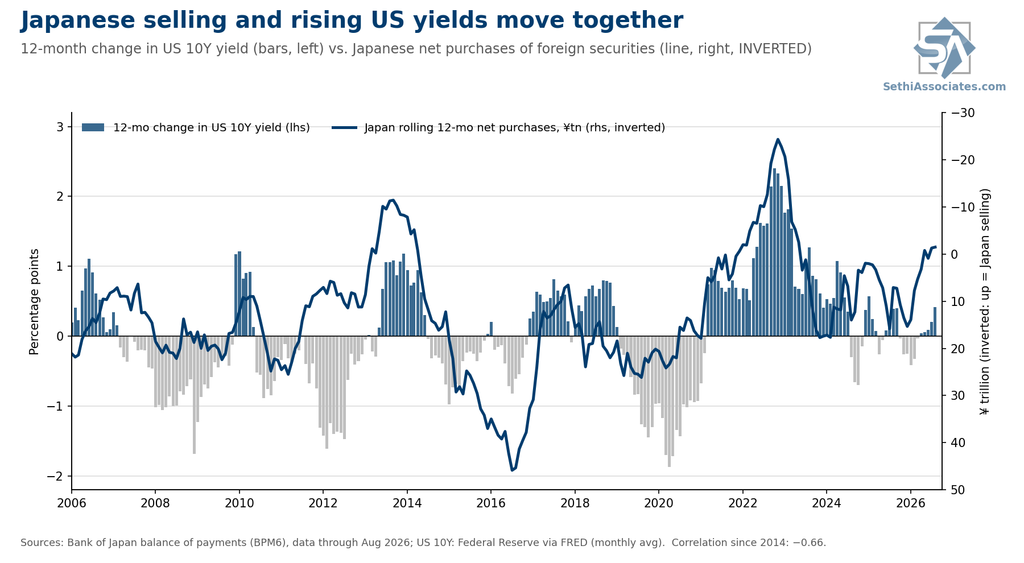
Given that backdrop, I had Claude do an analysis of how Japan’s flows line up with US 10-year yields, using Bank of Japan data on Japanese net purchases of foreign securities. Its takeaways were consistent with the risk Christophe flagged:

1. Japan flows do have a strong correlation with the change in 10-year yields. Comparing rolling 12-month net purchases to the 12-month change in the US 10Y results in a correlation of about −0.66 since 2014. That is consistent with Japanese selling driving yields. The 2013 taper tantrum and 2022 stand out.

2. Neither series, though, conclusively leads the other; the fit is tightest when both are measured over the same period. So while that’s consistent with Japanese selling pushing yields up (which makes a lot of sense), it is equally consistent with sharp rises/drops in yields and hedging costs pushing/pulling Japanese investors out/in. In 2022, the cost of hedging dollars back into yen went from roughly 0.2% to over 4%, and Japan sold a record amount of foreign bonds.

3. Flows have little correlation with a given level of 10-year yields. The correlation between Japan’s rolling 12-month net purchases and the US 10Y level is weak: about −0.14 since 1997 and −0.4 since 2014.

So it seems the reallocation risk is very real if higher Japanese yields do pull flows back home.

Tech Selloff Deepens as Market Rotation Continues

Another selloff in AI names broadened to encompass most of Tech, sending the Nasdaq-100 to its worst week since April 2025. Five sectors though would finish the week up 2% or more, as 30-year Treasury yields fell the most since April 2025.