Stocks Snap Four-Day Skid Despite Hot CPI, Attention Turns to the FOMC


US equities see broad gains led by megacaps despite markets locking in a September rate hike with at least two more priced over the next year.
US equities see broad gains led by megacaps despite markets locking in a September rate hike with at least two more priced over the next year.
I remain of the view that equities are overvalued — perhaps materially so.
I also remain of the view that, given the market structure dynamic and continued optimism on the part of most market participants (“the buy on the dip mentality continues uninterrupted”) that a sharp and extended market decline is unlikely (but not improbable).
Instead, a sawtooth pattern lower is my baseline expectation.
For now, my objective is to take advantage of specific/unique trading opportunities. I don’t see many high-confidence buy-and-hold ideas (particularly on the long side). That said, some of my short holdings have been on my books for several years — and will remain there.
In this backdrop and over the balance of the year, opportunistic trading seems the most appropriate tactical approach to delivering alpha. I am currently long about 12 positions and short approximately 18 positions.
While the proximate causes for the recent market weakness are sticky inflation and higher interest rates, I continue to see other substantial headwinds that argue against new highs in equities this year:
* The likelihood that the unprecedented AI capital spending spree fails to return the cost of capital (See my More Tales From Nvidia series)
* Undisciplined fiscal policy
* Improvisational geopolitical policy that may have adverse economic reprecussions
* An equity risk discount (the ERP measures the relationship of earnings to the risk free rate of return)
* Historically high valuations
* Today’s market structure and leverage risks have not been seen in prior market cycles
As noted recently we have rejected the notion of market broadening so popularly transmitted by Perma Bulls on Fin TV. See Mr. Market Is Not Broadening Out from August 31 in which I made the following points (H/T The Divine Ms M):
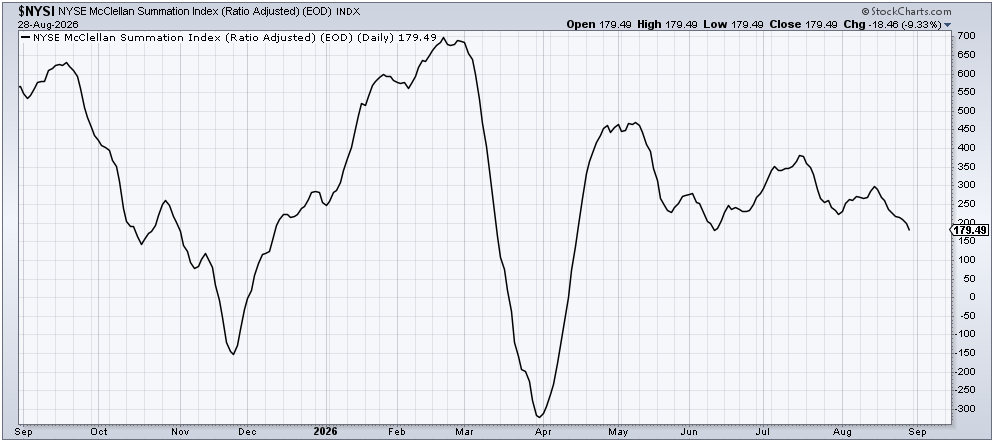
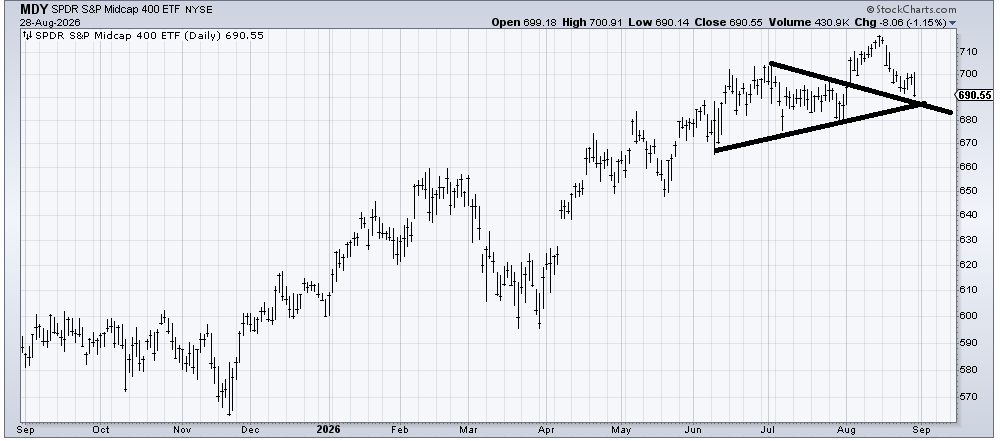
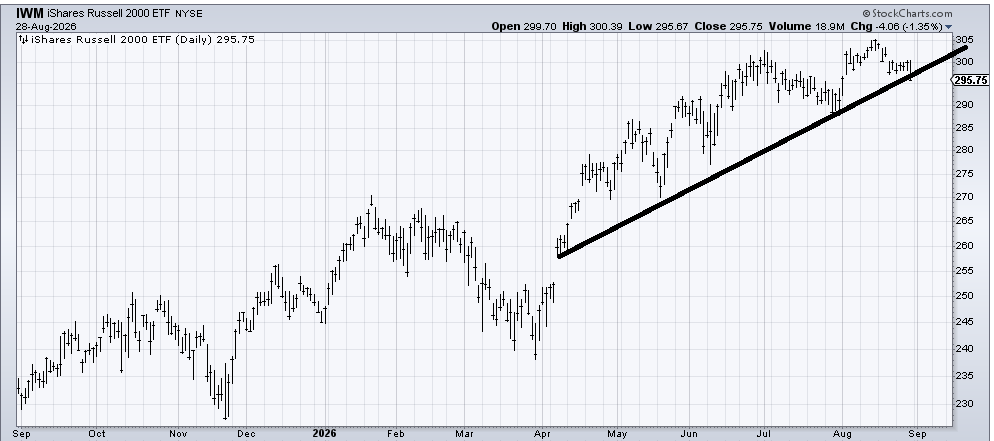
* The McClellan Index (NYSI) is faltering, the Mid Cap Index (MDY) is weakening, the Russell Index (IWM) is not “crowing” nor is the equal weighted S and P Index (RSP) participating in the markets’ recent advance…
Contrary to the near universally bullish narrative of most of the “talking heads” in the business media, the market is not broadening out — at least not as measured by the McClellan Summation Index, the Mid Cap Index, Russell and Equal Weighted S&P Indices.
Let’s look at the facts and charts, delivered by The Divine Ms M (Helene Meisler) on TheStreetPro this morning…
Since that column, the $IWM has declined from $300 to $288 and the $RSP has dropped from $222 to $214!
That said, there remains a non-trivial chance that a sharp decline could materialize at any time. After all, the massive shift from active to passive management means that machines and algos rule the day. And those machines have no sense of value (but think they know everything about price). Accordingly, “buyers live higher and sellers live lower.” So a clear momentum change lower (and I am not talking three trading sessions!) could develop into a deeper drop that I currently expect.
For now I am emphasizing tactical trading (shorting strength and buying weakness) — especially in shorting/covering the Indices. (I went delta neutral on my short $SPY position with the S&P cash -50 handles yesterday).
Be forewarned.
Position: None
Another leg higher in oil, on top of a firm inflation backdrop, lifted Treasury yields to multi-year highs, hardening Fed rate-hike bets into next week’s meeting, and driving a fourth straight day of equity losses.
My even market wrap-up is a summary of everything you should know for successful trading.
Now I know why the RSP doesn’t look like any breadth indicators I follow.
End of day rundown of all that you should know for September 8th.
* Equities are not broadening out
* Several time-tested valuation models point to downside risk dwarfing upside reward…
Yesterday I quoted from portions of The Divine Ms M’s column in which she delivered an important message that the market WAS NOT BROADENING OUT (contrary to those in the business media who have said the opposite).
Today I will touch on several valuation models (the Gordon, Greenspan and the Equity Risk Premium models) that are being ignored and that highlight the markets’ possible overvaluation.
Divine’s pearls of wisdom (and charts) were important enough to repeat in its entirety:
*The McClellan Index (NYSI) is faltering, the Mid Cap Index ($MDY) is weakening, the Russell Index ($IWM) is not “crowing” nor is the equal weighted S and P Index ($RSP) participating in the markets’ recent advance…
Contrary to the near universally bullish narrative of most of the “talking heads” in the business media, the market is not broadening out — at least not as measured by the McClellan Summation Index, the Mid Cap Index, Russell and Equal Weighted S&P Indices.
Let’s look at the facts and charts, delivered by The Divine Ms M (Helene Meisler) on TheStreetPro this morning:
When we look back at the month of August, you might recall I had been of the mind that the ‘others’ would have a difficult month. It did not pan out as I envisioned. However, indicator-wise, you can see perhaps it has. Look at the McClellan Summation Index, which I think shows us what the majority of stocks are doing. It has been trending down for more than two weeks already, and if you squint hard enough, you can see it has made a lower low than late July and is closing in on the early June low.
If we look at the chart of the Mid Caps, we can see they are pretty much down on the month. The chart shows that rise early in the month that has been leaking without much fanfare for the last two weeks. It is coming into some decent support in the 685 area.
The IWM hasn’t escaped the same type of leakage. It too is back where it was in early August, having given up the gains that got folks so excited early in the month. It is also back where it was in June.
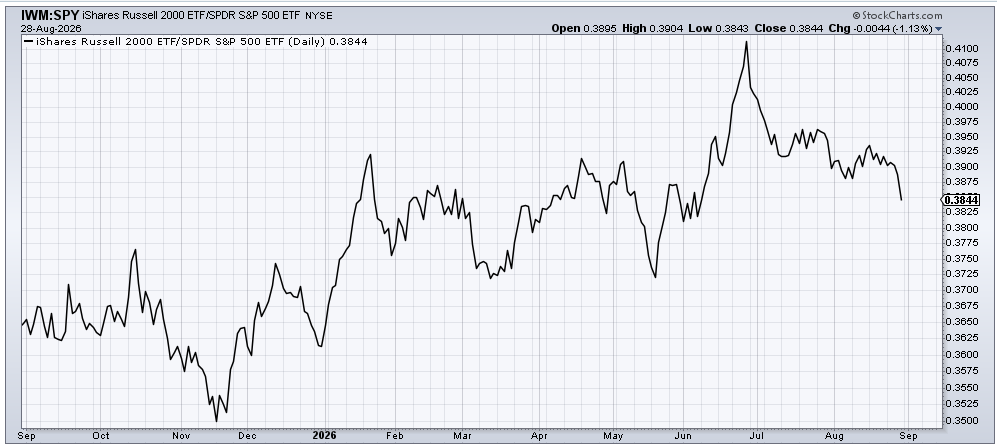
For all the hootin and hollerin about how great small caps were (are?) relative to large caps, the ratio of IWM to SPY says that narrative is wrong. That ratio peaked two months ago and just made a minor lower low. You can see it accelerated in the last week.
And what of everyone’s new favorite ETF, the RSP (equal-weight S&P)? Aside from the fact that the ratio peaked back in late February, notice all that supposed broadening out peaked in late July—exactly when the SOX/tech stocks made their lows. This ratio turned south last week as well.
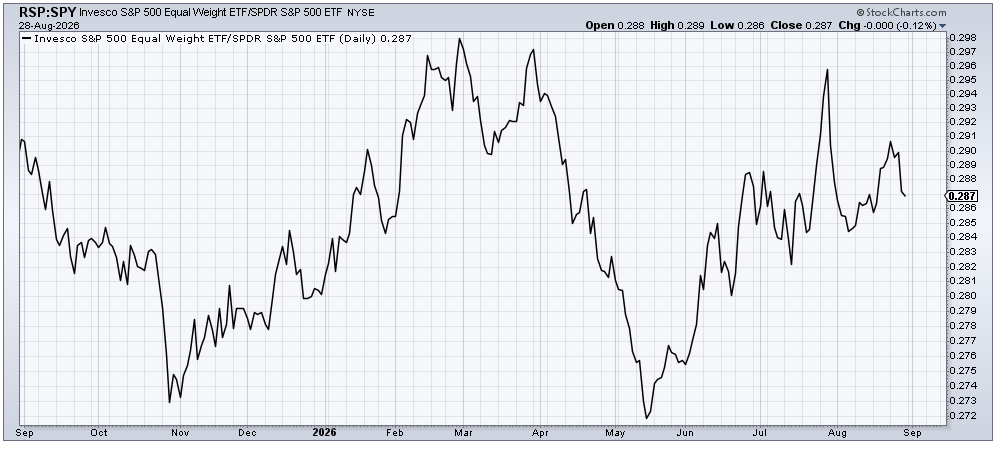
When you see these charts, you can understand why in the very short term, the market seems oversold. But you can also see that the Either/Or Market remains intact.
BY Doug Kass · Aug 31, 2026, 7:30 AM EDT
Position: None
We initiated three positions, added to several others, and locked in massive gains along the way.
* The McClellan Index (NYSI) is faltering, the Mid Cap Index ($MDY) is weakening, the Russell Index ($IWM) is not “crowing” nor is the equal weighted S and P Index ($RSP) participating in the markets’ recent advance…
Contrary to the near universally bullish narrative of most of the “talking heads” in the business media, the market is not broadening out — at least not as measured by the McClellan Summation Index, the Mid Cap Index, Russell and Equal Weighted S&P Indices.
Let’s look at the facts and charts, delivered by The Divine Ms M (Helene Meisler) on TheStreetPro this morning:
When we look back at the month of August, you might recall I had been of the mind that the ‘others’ would have a difficult month. It did not pan out as I envisioned. However, indicator-wise, you can see perhaps it has. Look at the McClellan Summation Index, which I think shows us what the majority of stocks are doing. It has been trending down for more than two weeks already, and if you squint hard enough, you can see it has made a lower low than late July and is closing in on the early June low.
If we look at the chart of the Mid Caps, we can see they are pretty much down on the month. The chart shows that rise early in the month that has been leaking without much fanfare for the last two weeks. It is coming into some decent support in the 685 area.
The IWM hasn’t escaped the same type of leakage. It too is back where it was in early August, having given up the gains that got folks so excited early in the month. It is also back where it was in June.
For all the hootin and hollerin about how great small caps were (are?) relative to large caps, the ratio of IWM to SPY says that narrative is wrong. That ratio peaked two months ago and just made a minor lower low. You can see it accelerated in the last week.
And what of everyone’s new favorite ETF, the RSP (equal-weight S&P)? Aside from the fact that the ratio peaked back in late February, notice all that supposed broadening out peaked in late July—exactly when the SOX/tech stocks made their lows. This ratio turned south last week as well.
When you see these charts, you can understand why in the very short term, the market seems oversold. But you can also see that the Either/Or Market remains intact.
Position: None
$SPY +0.44%
$QQQ +0.26%
$IWM -0.58%
$RSP -0.04%
Position: Short SPY (M)