July Monthly Roundup: Keeping Our Lead After a Wild Ride


July delivered one of the most volatile finishes to a month in recent memory. The S&P 500 ended the month essentially flat, masking a genuinely violent round trip, while the Nasdaq Composite posted a low-single digit decline. While the Pro Portfolio lost some ground, the end-of-month snapback led us to close July more than 210 basis points ahead of the S&P 500.
Looking under the hood, and examining the week-to-week moves, we find several drivers behind the market’s July gyrations:
The renewed war between the U.S. and the Iran drove a rebound in oil and related prices and shuttered traffic through the Strait of Hormuz. That rekindled inflation pressure concerns, jumpstarting questions over consumer-spending prospects as we enter the Back-to-School shopping season. Adding to that concern was the drop in June Personal Spending growth. At just 0.3% for the month, it was the lowest figure since January.
The market reaction to quarterly earnings reports confirmed our thinking that for stocks to gain more ground there needed to be little wiggle room in those results and corporate guidance. Companies needed to not only clear the bar of consensus figures but also the whisper numbers as well. Once again, a bottom-line estimate missing by a few pennies was the driving force even if the reported year-over-year results were still up significantly.
A hawkish-sounding Federal Reserve decision on July 29 triggered the market’s worst single day since April 2025. Bond markets reacted sharply with the 30-year Treasury yield rising to its highest level since 2007 even as short-term yields fell on reduced near-term hike odds. Housing and other interest-rate sensitive stocks bore the brunt of those hawkish comments and the current market expectation for a rate hike later this year.
AI-capex skepticism and a Korean memory-chip selloff weighed on chip stocks before the combination of earnings from Microsoft ($MSFT) and then Amazon ($AMZN) sparked a rebound in those stocks as well the hyperscalers and other key capex beneficiaries.
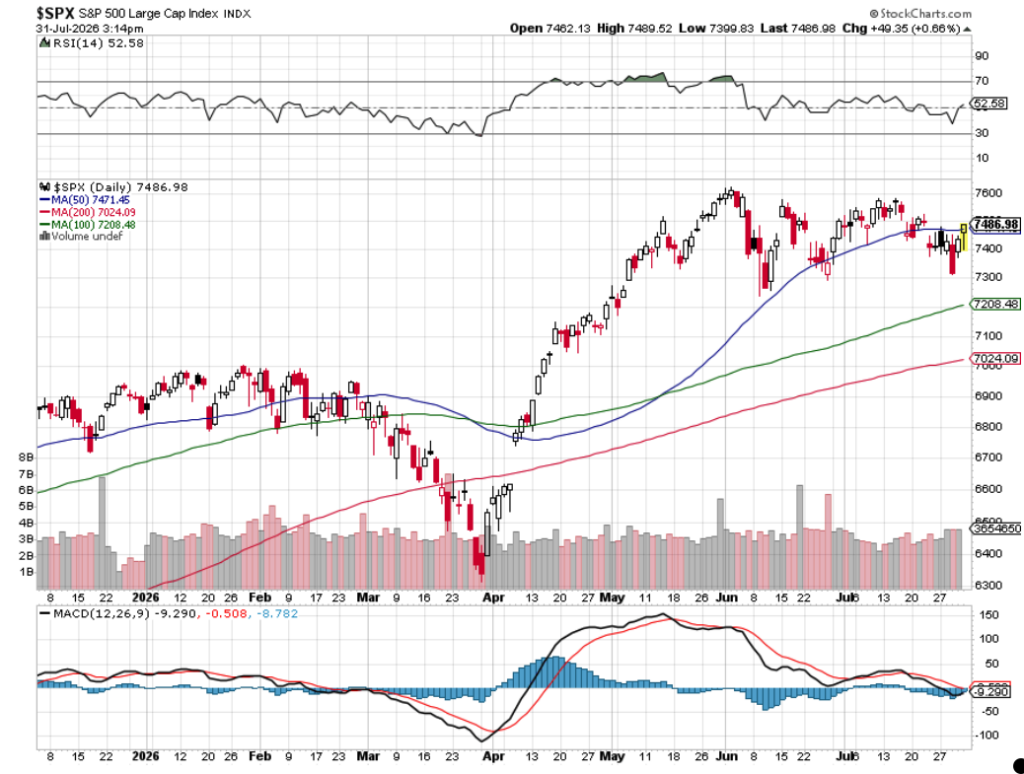
The culmination of those developments and that sharp market rebound during the last two trading days of July had the S&P 500 looking like it would start August back above its 50-day moving average. For the market to power higher from here, we will want to see a positive test of that level, which would turn it into a level of support. Looking at the Nasdaq Composite, after falling most of the July, late in the month the index bounced off its 100-day moving average, and that makes the next level to watch its 50-day moving average near 25,950.
Those are the factors that led the market to close July where it did. Looking forward, we have a few more weeks of the current earnings season that will bring numerous data points as well as other Portfolio company earnings reports. Next week, in particular, brings us fresh data points when it comes to inflation, the speed of the economy, and job creation. In digesting what those developments have to say, we will keep an eye on the technicals for those market indexes.
In the ensuing weeks, we’ll also have Fed Chair Kevin Warsh’s Jackson Hole speech and the start of a wave of investor conferences. All that, plus the usual August slowdown in trading volumes as Wall Street takes a break to recharge before the post Labor Day sprint to the end of the year.
Our plan is to continue the practices that have allowed the Portfolio to power ahead of the S&P 500 this year. If you’re new here that means following the data and what it says, triangulating those learnings against company comments and other data points, including the signals we collect and share with you.
We will continue to focus on companies benefiting from multi-year tailwinds and poised to deliver superior EPS growth. That goes for ones in the Portfolio today, as well as ones we are scoping out as potential candidates.
We will heed our portfolio discipline and be mindful of technical indicators for the market and the Portfolio’s holdings. If that means prudent action should be taken, or if new information warrants a re-think on an existing position, we will take action as warranted.
We recognize that one of the challenges with investing is keeping one’s emotions in check. When tensions are high, like they were in July, we will purposely slow things down, double check our thesis against the data, and react accordingly. The goal is to manage the Portfolio for the longer-term, and that means not reacting or overreacting when fear is rampant in the market.
We’re more in the camp with Warren Buffett, meaning that we see fear and panic in the market not as a reason to sell, but as a potential opportunity to buy high-quality businesses at a discount. As you’ll see below, while we booked some gains in July, we also put that capital to work in several positions, taking advantage of the market turmoil to do so.
Yeah, we finished July ahead of the S&P 500, but with five more months in 2026 we have more work to do.
Enjoy your weekend and we’ll see you back here bright and early on Monday to kick off August trading and barrel toward the end of the dog days of summer.
Catching Up on the Portfolio This Month
July was a challenging month for the markets, and the same comment goes for the Portfolio. However, exiting the month, we continued to lead the S&P 500 and the Nasdaq Composite by a wide margin year to date.
Like the market, several holdings in the Portfolio tied to the AI and data center buildout were hard hit in July, but as we saw late in the month, earnings from Microsoft ($MSFT) and Amazon ($AMZN) addressed those concerns, leading several of our holdings to snap back. Rising capex levels and tight chip capacity alongside rising AI adoption and usage levels bode well for those chip-related laggards of late, such as Applied Materials ($AMAT) and Marvell ($MRVL) in the months ahead.
When all was said and done for July, standouts relative to the S&P 500’s July performance were Apple ($AAPL), Amazon, Arista Networks ($ANET), Bank of America ($BAC), Broadcom ($BRCM), Costco ($COST), Microsoft, Paccar ($PCAR), Palantir ($PLTR), TJX Companies ($TJX), and a few others. Applied Materials ($AMAT) and Marvell ($MRVL) were big drags on the Portfolio this month, as were the shares of Axon Enterprise ($AXON) and Neostellar ($NSLR).
Axon reports next week, and in our write-up below we share what we’ll be focusing on. With Neostellar, following our conversation with CEO Mark Klein, we continue to see further gains in the company’s net asset value per share ahead, but the speed of those increases will hinge on the tone of the IPO market in September. Typically, August is a slow time of year for those transactions.
The other drag on the Portfolio was the newly reconstituted EPS All-Stars basket, which declined double-digits in July. That was frustrating coming off the significant gain the strategy delivered in Q2 2026, but rising capex levels from hyperscalers, tight memory industry capacity and renewed inflation remain in play and that bodes well for this new batch of constituents.
Aside from the reconstitution of that basket, we made multiple moves in July, and our first one was to lock in a gain in Axon shares as they crossed into an overbought condition following a sharp rebound from below $420 in mid-June. On July 1, we booked a nice gain on that slug of AXON shares we sold at $600.42.
On July 8, with President Trump declaring the interim Iran deal “over” following a U.S. strike and Iranian attacks on commercial vessels in the Strait of Hormuz, we trimmed the Portfolio’s position in Axon again but also took some Bank of America and Labcorp ($LH) chips off the table. All three had run up sharply and were pushing into overbought territory. The trades, which locked in double-digit gains on LH and AXON shares and a profit of more than 110% on BAC shares, rebuilt our cash levels so we could stay opportunistic if the geopolitical backdrop worsened.
On July 13, Apple bucked a down market on the back of share-gain data from Omdia and Counterpoint Research showing the iPhone grabbing a record ~20% of global smartphone shipments even as the broader market contracted. Combined with word of an imminent iOS 27 public beta, we raised our AAPL price target to $350 from $305 and our checkpoint to $280 from $268, while holding our Two rating.
The following day, a much cooler-than-expected June CPI print and constructive pre-testimony comments from Fed Chair Warsh gave us the green light to put capital to work in Boeing ($BA), Marvell and Neostellar. As we made those moves, we reset our NSLR checkpoint to $10 from $11 and our MRVL checkpoint to $200 from $220, while holding our BA checkpoint at $190. Later that day, we revisited the First Trust Nasdaq Cybersecurity ETF ($CIBR). With cybersecurity spending on pace to top $520 billion by 2031 and CIBR’s basket still reflecting high “purity” to that theme, we raised our price target to $105 from $85 and moved our checkpoint to $75 from $70.
On July 16, Apple’s continued climb pushed the stock’s RSI past 70 and its position size toward 4.5% of the Portfolio, leading us to trim back the position size. That move locked in a gain of more than 1,500% on that slug of AAPL shares. Given the potential for Apple Intelligence and Siri to drive the long-awaited iPhone upgrade cycle, we maintained ample exposure to AAPL shares following that lucrative and prudent move. We funneled the proceeds into additional shares of TJX near $155, using the pullback in the shares and renewed U.S.-Iran tensions, which were re-kindled inflation pressures, as the rationale. We also reset TJX’s checkpoint to $135 from $140 and upgraded the shares to a One rating.
A few days later, we added further to our positions in Neostellar and Boeing. Later that morning, we sold half our Labcorp position after HCA Healthcare’s preannouncement on lost Affordable Care Act coverage pointed to a likely volume and margin headwind for LH. We downgraded the stock to a Three from a Two as the gain of more than 40% on that slug of shares helped rebuild the Portfolio’s cash position.
On July 21, price-hike comments from Taiwan Semiconductor and raised guidance from wafer maker IQE reaffirmed robust AI and data-center chip demand. We used that to take another step in rebuilding our Marvell position. We also bought more shares of Applied Materials and reset AMAT’s checkpoint to $475 from $500 and reduced MRVL’s to $185 from $200.
A few days later, we closed out the Portfolio’s remaining position in Labcorp, locking in gain of 23% on that tranche of shares. Between the shares’ overbought condition and escalating U.S.-Iran tensions pushing the 10-year Treasury yield above 4.7%, we opted to bank the cash and put LH in the Bullpen for a better re-entry point.
Following United Rentals’ ($URI) beat-and-raise second quarter last week, which was supported by bullish commentary from CSX and Union-Pacific around data-center and re-shoring-driven construction activity, we raised our URI price target to $1,250 from $1,100 and our checkpoint to $930 from $865.
On July 27, we used the anticipated dividend increase following the Fed’s stress-test results to raise our Bank of America price target to $70 from $65. But given the move mid-teens move in the shares over the preceding weeks, only about 12% upside left to the new target, the shares back in overbought territory, and the market heading into typically sluggish late-summer trading, we downgraded our rating to a Two from a One. Later that week, we upped our price targets for Boeing to $265 from $260 and Waste Management ($WM) to $265 from $255 and reset our WM checkpoint to $215.
Following quarterly results and guidance from Microsoft and Meta, we used the learnings from those events and Lam Research’s beat-and-raise quarter to scoop up more shares of Applied Materials and Marvell. We also used the strong quarterly results from Fortinet and reports of multiple hacks by rogue OpenAI agents to increase our exposure to CIBR. And, after increasing our price target on Boeing shares following our conversation about the company’s Q2 2026 results and improving prospects for higher production levels, and the flow-through to margins and cash flow, we are picking up more shares below our existing cost basis.
On July 31, we lifted our price target on AMZN shares to $325 and reset our checkpoint level at $225.
The net result of the Portfolio’s July moves left us with ~8.2% of its assets in cash. That gives us some additional firepower as we move into August, although it tends to be one of the softer months for the market. Some of that has to do with lower summer trading volumes and Wall Street squeezing in vacation ahead of the September-to-December push. We’ll be mindful of that as we continue to hunt for new opportunities and favorable risk-to-reward entry points for existing ones with superior EPS growth prospects and pronounced tailwinds pushing on their business.
This Month’s Portfolio Signals
Big discussions and insights are had during TheStreet Stocks & Markets Podcast, and in Signals, we share the latest news for the Pro Portfolio’s strategies. Here are links to those conversations conducted over the last several weeks:
July 18: We’re Tracking 23 Signals Across 10 Portfolio Investing Strategies
July 25: 29 Signals We’re Tracking Across 11 Portfolio Strategies
Some helpful links if you prefer to catch the podcast on the go, in the car, or wherever. Be sure to give it a like or thumbs up and leave a review if you’re so inclined. We’d appreciate it.
Key Global Economic Readings
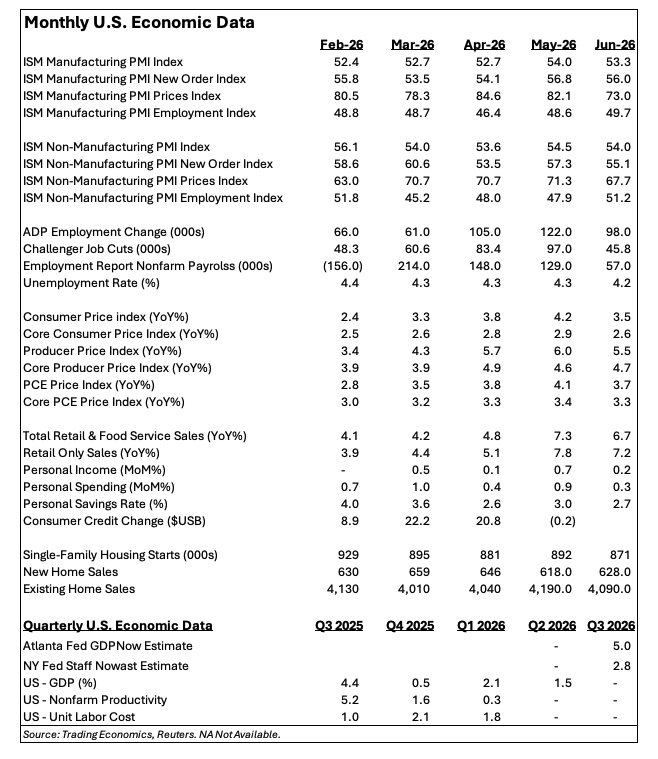
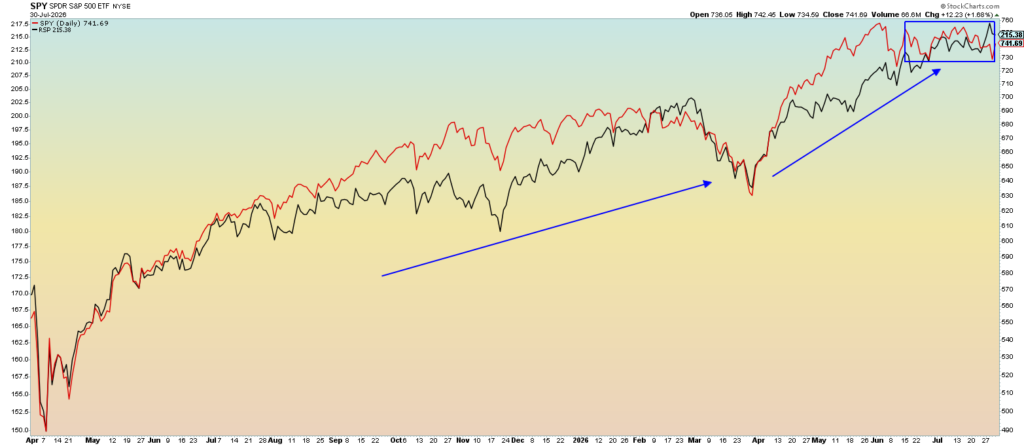
Chart of the Week: S&P 500 – Market Cap vs. Equal Weighted
July was a truly wacky month for the stock market, but in the end, it might just be a wash on returns. No question the big tech stocks were hit rather hard this month, with heavy selling led by the hot memory/storage names like Micron, Sandisk and Seagate Tech. Selling also hit the semiconductor group, many stocks shedding as much as 50% of their value. The VanEck Semiconductor ETF ($SMH) fell about 24% from its highs to July 29, and then reversed the following day.
Meanwhile, all has largely been well with the rest of the stock market. The Invesco S&P 500 Equal Weight ETF ($RSP) has been running hot lately, rallying this past month as a broadening out of the market was seen. Suddenly, investors realized there was money to be made outside of technology stocks, and we saw a nice move in the RSP, up nearly 2% after strong gains in May/June.
There were more positive days for the RSP, which is saying something as the State Street SPDR S&P 500 ETF Trust ($SPY) was a victim of some heavy selling this past month. The SPY, of course, is the weighted index of the S&P 500, and you’ll see on the chart in the upper right side the red line shows a recent down move (slope) for this ETF while the RSP is moving higher.
This relative outperformance is nothing new and can last for a while, though at times we often see the SPY take the lead. The important thing to keep in mind is money is staying in the stock market, and with all-time highs again within earshot investors may not wait too long to add more stocks to their portfolios before the next move – which appears to be higher following a mild sideways consolidation.
Other charts we shared with you this past week were:
Monday, July 27: S&P 500 – Another Setback for the Bulls
Monday, July 27: Costco (COST) – Is Costco Finding a Low?
Tuesday, July 28: Meta Platforms (META) – Meta’s Day of Reckoning Is Here
Wednesday, July 29: Microsoft (MSFT) – Can Microsoft Deliver?
Thursday, July 30: Eaton (ETN) – Eaton Is Losing Power
The Week Ahead
For those of you that found July to be a very frustrating month, and I include myself in that camp, a new month is upon us. Next week brings July PMI and jobs data that will tell us much about the economy, inflation, and whether we can add the pace of job creation to list of worries that have weighed on the market. But what we hear out of the Sunday OPEC+ meeting and potential plans to increase production in September could determine how we begin August trading. The same comment applies to the weekend developments between the U.S. and Iran.
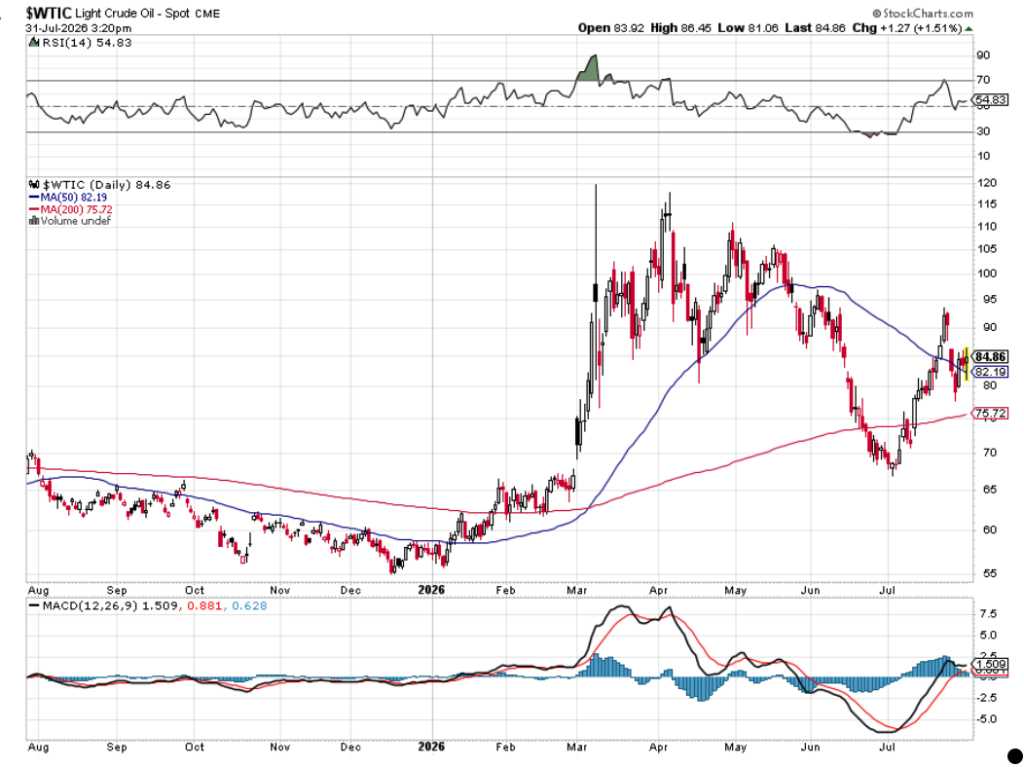
As we digest those data points, we’ll take a cue from Fed Chair Kevin Warsh and continue to listen to the data and what it says about what’s next for the economy and monetary policy. With renewed fighting between the U.S. and Iran, the rebound in oil and related prices are likely to translate into renewed inflation tailwinds. In the July PMI data, we’re likely to see efforts to lift output prices, which would be signal of more inflation pressure ahead.
We’ll be breaking down those findings, and updating our thoughts to you on the economy, monetary policy and the Portfolio as needed. And of course we’ll keep a watchful on any developments that point to the resumption of peace talks, and the re-opening of the Strait of Hormuz.
Here’s a closer look at the economic data coming at us next week:
U.S.
Monday, August 3
S&P Global Final Manufacturing PMI – July (9:45 AM ET)
ISM Manufacturing PMI – July (10:00 AM ET)
Construction Spending – June (10:00 AM ET)
Tuesday, August 4
LMI Logistics Managers Index – July
Imports/Exports – June (8:30 AM ET)
JOLTS Job Openings & Quits – June (10L00 AM ET)
Factory Orders – June (10:00 AM ET)
Wednesday, August 5
MBA Mortgage Applications Index – Weekly (7:00 AM ET)
ADP Employment Change Report – July (8:15 AM ET)
S&P Global Final Services PMI – July (9:45 AM ET)
ISM Services PMI – July (10:00 AM ET)
EIA Crude Oil Inventories – Weekly (10:30 AM ET)
Thursday, August 6
Challenger Job Cuts – July (5:30 AM ET)
Initial & Continuing Jobless Claims – Weekly (8:30 AM ET)
Productivity & Unit Labor Cost – Q2 2026 (8:30 AM ET)
Wholesale Inventories – June (10:00 AM ET)
EIA Natural Gas Inventories – Weekly (10:30 AM ET)
Friday, August 7
Employment Report – July (8:30 AM ET)
Consumer Inflation Expectations – July (11 AM ET)
Consumer Credit – June (3 PM ET)
International
Monday, August 3
Japan: S&P Global Final Manufacturing PMI – July
China: RatingDog Manufacturing PMI – July
Germany: Retail Sales – July
Eurozone: S&P Global Final Manufacturing PMI – July
UK: S&P Global Final Manufacturing PMI – July
Wednesday, August 5
Japan: S&P Global Final Services PMI – July
China: RatingDog Services PMI – July
Eurozone: S&P Global Final Services PMI – July
UK: S&P Global Final Services PMI – July
Eurozone: Producer Price Index – June
Thursday, August 6
Germany: Factory Orders – June
Eurozone: Retail Sales – June
Friday, August 7
China: Imports/Exports – July
Germany: Industrial Production, Imports/Exports – June
Over the weekend, Nvidia will present at the Black Hat Conference, and given the focus of that event on cybersecurity odds that will be the topic in hand. Following two reports that OpenAI agents went rogue and hacked multiple third-party accounts in addition to Hugging Face’s platform, we suspect the outcome of Nvidia’s presentation and the larger conference that runs from August 1 to 6 will be a positive catalyst for the Portfolio’s position in the First Trust Cybersecurity ETF ($CIBR).
During the coming trading week, we’ll get quarterly results from Palantir ($PLTR), Arista Networks ($ANET), Axon ($AXON), and Neostellar Capital ($NSLR). Those will be among another heavy wave of earnings reports, but without any that account for a significant piece of either the S&P 500 or the Nasdaq Composite, like we saw this past week, we’ll focus on connecting the dots back to our holdings, especially those that have yet to report.
What we aim to achieve is an updated mosaic. For example, as it relates to our position in Eaton ($ETN), updated capex plans from Duke Energy ($DUK) will be an area of focus. Following Paccar’s ($PCAR) comments about rising truck production levels, we’ll confirm that with comments from known engine supplier Cummins ($CMI). Comments about construction activity from Jacobs Solutions ($J), Construction Partners ($ROAD) and others will give us more color on the outlook for United Rentals ($URI). We’ll also be interested in what AMN Healthcare ($AMN) has to say about demand from the senior housing market.
We may have a far smaller number of Portfolio holdings reporting next week, but as you can see, there will be much work to be done.
Here’s a closer look at the earnings reports coming at us next week:
Monday, August 3
- Open: CNH Industrial (CNHI), Marriott (MAR), Tyson Foods (TSN)
- Close: Alexandria Re (ARE), Cabot (CBT), Clorox (CLX), onsemi (ON), Palantir (PLTR), Whirlpool (WHR)
Tuesday, August 4
- Open: ADM (ADM), Apollo (APO), BP (BP), Caterpillar (CAT), Cummins (CMI), Duke Energy (DUK), Ferrari (RACE), Grainger (GWW), Henry Schein (HSIC), Idexx (IDXX), Kimberly Clark (KMB), McDonald’s (MCD), Merk (MRK), Pfizer (PFE), Rockwell Automation (ROK), Shopify (SHOP), Spotify (SPOT), Trex (TREX)
- Close: Arista Networks (ANET), Bed Bath & Beyond (BBBY), Emerson (EMR), Interparfums (IPAR), International Flavors (IFF), Jacobs Solutions (J), Lumen Technologies (LUMN), Mattel (MAT), Mosaic (MOS), Pinterest (PINS), SpaceX (SPCX), Toast (TOST)
Wednesday, August 5
- Open: Capri Holdings (CPRI), CVS Health (CVS), Dine Brands (DIN), Extreme Networks (EXTR), Global Payments (GPN), Global Foundries (GFS), Kennametal (KMT), Kraft Heinz (KHC), New York Times (NYT), Shake Shack (SHAK), Uber (UBER), Walt Disney (DIS)
- Close: A10 Networks (ATEN), American States Water (AWR), Axon (AXON), Block (XYZ), DoorDash (DASH), Dutch Bros (BROS), elf Beauty (ELF), eBay (EBAY), Expedia Group (EXPE), Fastly (FSLY), Motorola Solutions (MSI), Neostellar Capital (NSLR), Realty Income (O), Veeco Instruments (VECO), Western Digital (WDC), Zillow (ZG)
Thursday, August 6
- Open: Advanced Drainage Systems (WMS), ConocoPhillips (COP), Datadog (DDOG), Keurig Dr Pepper (KDP), Molson Coors (TAP), Papa John’s (PZZA), Peloton (PTON), Planet Fitness (PLNT), Ralph Lauren (RL), Restaurant Brands (QSR), US Foods (USFD), Warner Bros Discover (WBD), Zoetis (ZTS)
- Close: Airbnb (ABNB), AMN Healthcare (AMN), Cloudflare (NET), Dentsply Sirona (XRAY), DraftKings (DKNG), Gen Digital (GEN), Instacart (CART), James Hardie (JHX), Lyft (LYFT), MP Materials (MP), Post (POST), Republic Services (RSG), Texas Roadhouse (TXRH), Trade Desk (TTD), Warner Music (WMG)
- Open: Construction Partners (ROAD), Flour (FLR), Under Armour (UAA), Wendy’s (WEN)
Portfolio Investor Resource Guide
- Economic Data: Here’s a List of Links to the Key Economic Data We Closely Watch
- Investing Terminology: 16 Key Terms Club Members Should Know
- 10-Ks: Want to Know About a Stock? Read the Company’s Reports
- 10-Qs: Unlock the Numbers and Key Information Behind Your Stock With the 10-Q
- Income Statement: Our Cheat Sheet to Understanding This Financial Document
- Balance Sheet, Cash Flow Statements, and Dividends: How to Know If a Company Is Off-Kilter? Read Its Balance Sheet
- Valuation Metrics: Everyone Wants a Value. Here’s How Investors Can Find
- Thematic Investing 101 Webinar
- Like the Benefits of ETFs? Let’s Talk About Models
The Portfolio Ratings System
1 – Buy Now (BN): Stocks that look compelling to buy right now.
2 – Stockpile (SP): Positions we would add to on pullbacks or a successful test of technical support levels.
3 – Holding Pattern (HP): Stocks we are holding as we wait for a fresh catalyst to make our next move.
4 – Sell (S): Positions we intend to exit.
ONES
American Express AXP; $336.25; 400 shares; 3.84%; Sector: Financial Services
UPDATE: Following a strong move in June that capped an equally impressive Q2 2026, American Express ($AXP) shares rose in the first half of July but ultimately closed out the month little changed. The rebound in inflationary pressures in July rekindled consumer spending concerns and that along with the Amex management team delivering, in our view, overly conservative guidance for H2 2026 weighed on the shares in the second half of the month. As we noted in our alert discussing Amex’s Q2 2026 results, the latter fits the usual pattern, but that also affords those of us who understand the nuts and bolts of Amex’s earnings power an eventual opportunity. What the herd missed was Amex’s card fees reached record levels of $2.86 million in the quarter, up 15.4% year over year, and were the fastest-growing revenue line in the quarter. That reflects Amex reaping the benefits of its card refresh efforts, which led the number of cards in force to reach 155.1 million with an average fee per card of $131. Simple math tells us that is well above the H2 2025 average of 152 million cards in force and net fee per card of $120.50. With card fees driving 70% of Amex’s pretax income, that step up alone suggests management’s guidance is conservative. But during the Q2 2026 earnings call, Amex management said card-fee growth is expected to accelerate in the current quarter and exit the year in the high teens. That telegraphs a rise in Amex’s pretax income and EPS in the coming quarters. Keeping that in mind, when we annualize the $8.81 in EPS Amex generated in H1 2026, it implies $17.62 in EPS for 2026. This adds to our thinking that Amex’s guidance is once again skewing conservative. To the extent coming market developments drag the shares into an oversold condition, our view is that would make for an even more compelling risk-to-reward tradeoff. We will continue to monitor consumer spending, which should improve as the flow through of falling oil prices is felt. We will also focus on management comments about the Platinum Card refresh and other card launches that should drive the number of cards in force and average fee per card higher.
July Price Change: -0.6%; Yield: 1.1%
INVESTMENT THESIS: American Express is a globally integrated, membership-driven payments company, providing customers with access to products, insights, and experiences that enrich lives and build business success. The company has four reportable operating segments: U.S. Consumer Services (USCS), Commercial Services (CS), International Card Services (ICS), and Global Merchant and Network Services (GMNS). American Express targets the premium consumer space by continuing to deliver membership benefits that span our customers’ everyday spending, borrowing, travel, and lifestyle needs, expanding its roster of business partners around the globe, and developing a range of experiences that attract high-spending customers. In 2025, the company’s net card fee revenue accounted for 72% of its pre-tax income, which we see as providing a differentiated business model that should continue to grow as Amex wins new card members and drives its average fee per card higher.
Target Price: Reiterate $400; Rating: One
Checkpoint: $290
RISKS: Slowdown in consumer spending, competition, membership growth, merchant acceptance, and lack of new product innovation.
Broadcom Inc. AVGO; $389.28; 555 shares; 3.53%; Sector: Technology
UPDATE: After falling 15% in June, shares of Broadcom ($AVGO) clawed some of that back in the first half of July, but came under pressure in the second half of the month amid renewed questions over AI and data-center spending. Following quarterly results and guidance from hyperscalers, including Microsoft and Amazon that pushed back on those concerns, AVGO shares closed July up low single-digits. That brought their YTD gain to low double-digits, nicely above the S&P 500’s YTD increase. Despite the fluctuations in shares through the bulk of July, it was a busy month for the company. In early July, Broadcom extended its custom-silicon partnership with Apple through 2031, locking in a customer that accounts for an estimated 20% of annual revenue. Alongside that announcement, Broadcom management guided current-quarter AI chip revenue to roughly $16 billion, up more than 200% year over year, fueled by hyperscaler design wins with Google, Meta, and OpenAI. Broadcom and OpenAI announced the “Jalapeño” chip, a co-developed AI accelerator and OpenAI’s first in-house “Intelligence Processor.” On July 25, Samsung and Broadcom signed a five-year agreement worth more than $200 billion through 2030, spanning high-bandwidth memory supply, foundry manufacturing on Samsung’s 2-nanometer-and-below process, and advanced packaging. The timing for the initial shipments speaks to the strong ramp Broadcom telegraphed for the back half of the year on its latest earnings call. Also, Broadcom plans to start deploying racks of AI accelerator and network systems in H2 2026 and continue through the end of 2029. That is some very nice multi-year visibility, and it’s another nod to the comment CEO Hock Tan made back in early March about a “line of sight to achieve AI revenue from chips, just chips, in excess of $100 billion in 2027.” Remember, OpenAI is one of the five custom AI silicon customers at Broadcom, with others including Google, Meta, Anthropic, and ByteDance. It’s also well positioned to capitalize on the demand for networking. That combo keeps us bullish on AVGO shares as does the robust outlook for its networking business. During the month, Broadcom also rolled out a new Wi-Fi 8 and broadband “Edge AI” lineup for smart homes and enterprise. Following our last buy on June 11 near $377, we have some room to grow the Portfolio’s position size further, and will be on the lookout for that opportunity and for members whose AVGO position size is less than the Portfolio’s.
June Price Change: 3.1%; Yield: 0.7%
INVESTMENT THESIS: We became shareholders in Broadcom to participate as the company benefits from the buildout of digital infrastructure, including AI, data center, and custom AI chips, as well as demand for its software and services segment, which includes private cloud, mainframe software, cybersecurity, and enterprise software. Broadcom reports its business in two segments – Semiconductor Solutions (58% of sales and 51% of operating income) and Infrastructure Software (42%, 49%). The Broadcom management team has developed a track record of delivering organic growth and growth by acquisition, with the latter positioning the company to better position itself to meet developing demands. More recent acquisitions include Brocade Communications, CA, Inc., Symantec Enterprise Security, and VMware.
Target Price: $525; Rating: One
Checkpoint: $340
RISKS: Economic, governmental regulations, geopolitical developments, cyclical, and investment risk.
Costco Wholesale COST; $951.89; 215 shares; 3.34%; Sector: Consumer Staples
UPDATE: Shares of Costco ($COST) climbed modestly in July, leaving them up around 10% on a YTD basis. Like many of you, we find that frustrating in the face of the company’s stellar string of monthly sales reports that leave little question it continues to gain consumer wallet share. Coming into 2026, a December 2025 survey from PYMNTS found that about 40% of consumers were living paycheck to paycheck out of necessity, waiting on their next paycheck to cover expenses signals. That was before the re-acceleration in inflation pressures that began earlier this year. With oil and gas prices moving higher, the rekindling of inflation pressures on consumers bodes well for further gains at Costco. To us, the key to Costco’s business is the relationship between growing the number of warehouse locations, which feeds the membership revenue stream and merchandise volumes. Provided Costco doesn’t make the location-over-saturation mistake we’ve seen from the likes of Starbucks and others, we are inclined to remain owners of the shares to capture further upside and the benefit of future special dividend payments. At roughly 3.3% of the Portfolio’s assets we have room to scale this position a tad further, and odds are such a move would trigger a re-think when it comes to our Two rating. Between now and then, we will mark our calendars for three upcoming Costco events. First, it will publish its July sales report on August 5. Second, the company’s next quarterly dividend is payable August 7 to shareholders of record at the close of business on July 24. Third, Costco will publish its Q4 2026 earnings on September 24.
July Price Change: 1.8%; Yield: 0.6%
INVESTMENT THESIS: We like Costco’s long-term prospects, driven by a club-based operating model that focuses on volumes, not margins, and therefore offers its customers a value proposition of everyday low prices. The strength of this model has created an incredibly loyal customer base with low churn and continued share gains in both brick-and-mortar and e-commerce. This is a global concept, evidenced by the strength of sales both in the U.S. and abroad, which includes an emerging China opportunity. We see the company’s membership model as a key differentiator versus other retailers, and its plans to open additional warehouse locations in the coming quarters should drive retail volumes and the higher-margin membership fee income as well. We also appreciate management’s approach to capital returns and their willingness to return cash.
Target Price: Reiterate $1,150; Rating: One
Checkpoint: $900
RISKS: Inability to pass through higher costs, fuel prices, weaker consumer, and membership churn.
Neostellar Capital NSLR; $10.15; 20,965 shares; 3.45%; Sector: Financial Services
UPDATE: Note that effective July 1, SuRo Capital rebranded to Neostellar Capital, and its ticker transitioned to “NSLR”. The company remains a publicly traded business development company focused on high-growth, venture-backed private companies. Shares of Neostellar Capital ($NSLR) sank further in July, building on their June decline, but still leaving them up high-single digits YTD. We used that pressure on the shares to grow the Portfolio’s exposure at $11.40 on July 14 and $10.52 on July 20. We can trace the pressure on NSLR shares to four things. First, Cerebras and SpaceX IPOs breaking their respective IPO prices, which has stoked questions about the market’s appetite for IPO activity. We will continue to track IPO activity, but as of now investment banking activity looks to remain robust in H2 2026. Second, renewed concerns over inflation, the move higher in the bond market, and the market preparing for incrementally hawkish comments from the Fed weight on small-cap stocks. NSLR with its sub-$300 million market lands in that camp. Third, recent developments for OpenAI, including the potential push out in its IPO to 2027 and one of its agents breaking into tech company Hugging face and going on a hacking spree, added to questions over the timing for its IPO. When Neostellar presents its final Q2 2026 results, we should see some changes to the top five investment table it usually shares. While Whoop, OpenAI and Vast Data will remain, as will Blink Health, CoreWeave will be replaced by TensorWave. Fourth, when Neostellar shared its preliminary investment portfolio update in early July, the net asset value per share ticked lower quarter over quarter due in part to a higher share count tied to senior convertible notes converting and expenses associated with the transition to the company’s new external manager structure. This was a bit surprising, but these expenses appear to be one-time in nature. That said, we will be scrutinizing the costs for this new management structure, adjusting our thinking as needed. Based on the disclosures in the company’s preliminary Q2 2026 results and the final one for Q1 2026, it looks to us like Neostellar still has some small piece of CRWV shares remaining. That should be a monetization event in H2 2026 and we can say the same for Neostellar’s position in newly public Lime ($LIME), once that IPO lock-up expiration passes. If there was one item that raised an eyebrow in this preliminary Q2 2026 report, it would be on Neostellar exiting the quarter with liquid assets of about $14.7 million versus cash on the balance sheet of $43.3 million exiting Q1 2026. However, CEO Mark Klein confirmed to us on July 28 that Neostellar has received the expected $20 million investment from Magnetar. That was tipped to us during our latest Stocks & Market podcast conversation with Klein. If you haven’t listened to that conversation or read the accompanying transcript, we would recommend doing so ahead of the company’s Q2 2026 earnings release next week.
July Price Change: -19.1%; Yield: 4.9%
INVESTMENT THESIS: Neostellar Capital is a business development company (BDC) that invests in high-growth, venture-backed private companies. As Neostellar monetizes those portfolio investments through either IPO or M&A transactions, it must pay out most of its earnings to shareholders in the form of dividends. What’s important to factor into our thinking is that Neostellar’s strategy isn’t to hold public company investments but rather to monetize them following the lock-up expiration. Sometimes this can be immediate, and sometimes it can be in stages, but when that monetization occurs, it triggers dividend payments. And because a BDC must pay out at least 90% of its taxable income through dividends to shareholders, there is the possibility of a special dividend to hit that qualifying threshold late in the year. As we think about this, it means that we should focus on total return with NSLR, which is defined as capital gains in the shares plus dividends received while owning them. What this means is even if we see NSLR shares trade sideways or move lower, depending on the size of the dividend payments in the coming quarters, the position’s total return could still be sizable for the Pro Portfolio. Neostellar’s portfolio holdings at the end of Q1 2026 included OpenAI, Whoop, Plaid, TensorWave, Vast, Blink Health and others.
Target Price: $17; Rating: One
Checkpoint: $9
RISKS: Industry and economic risk, competition and competitive pressures, and acquisition risk.
Nvidia Corp. NVDA; $200.75; 970 shares; 3.18%; Sector: Technology
UPDATE: During the first half of July, shares of Nvidia ($ NVDA) sprinted to the $212 level only to be dragged back down by the late-month market selloff. On the back of quarterly results from Microsoft and Amazon, NVDA shares regained some ground from that move lower, ultimately finishing July only down slightly. Those results confirmed a sharp ramp in capex spending as did quarterly results from Meta and Alphabet. Exiting July, NVDA shares were down modestly for month, and up mid-single digits on a YTD basis. While Nvidia won’t report its quarterly results until mid-to-late August, those ramping capex figures keep us bullish, but during July the market was swayed by a string of enormous AI infrastructure deals, which near month-end had investors more worried than reassured. Nvidia and South Korea’s SK Group unveiled a partnership worth more than $500 billion, anchored by an SK Hynix memory-supply agreement to advance next-generation memory for AI data centers coming online in 2027. Separately, Nvidia signed a $1.5 billion multi-year deal with Amkor Technology to expand advanced chip packaging and testing capacity in Arizona. Altogether, South Korea-linked agreements that day totaled close to $950 billion in headline value. Bloomberg reported Nvidia was pursuing more than $750 billion in new AI deals — the SK Group partnership plus talks to backstop as much as $250 billion to help OpenAI lease computing power from a U.S. data center project. That reignited long-standing worries that Nvidia financing the very customers who buy its chips creates artificially inflated demand signals. As we noted in our July 27 note, some folks will see that as Nvidia flexing its balance sheet to position itself for future revenue growth, while in some cases tying up supply capacity. Nvidia’s move helps address concerns about OpenAI and finances, potentially alleviating some concern as OpenAI moves toward its eventual IPO. And yes, Nvidia is an investor in OpenAI. Some would call Nvidia’s move prudent, especially given tight industry capacity for memory and other key inputs. We are in that camp, but we recognize these headlines will likely stoke questions over circular financing but for us it will mean keeping a watchful eye on company cash flows when it reports it quarterly results. Exiting July, when examined across expected EPS growth between 2025 and 2028, NVDA shares were trading at price-to-earnings growth (PEG) ratios of less than 0.5x expected 2026 EPS of $8.94 and 0.33x the corresponding $12.79 figure for 2027. Given our current NVDA position size that has us circling the shares and reiterating our One rating. Upcoming catalysts will include July sales figures for TSM and Foxconn as well quarterly results from Dell and Hewlett Packard Enterprise.
July Price Change: 0.3%; Yield: 0.5%
INVESTMENT THESIS: Nvidia is well-positioned to benefit from ramping AI and data center spending. The company pioneered accelerated computing to help solve the most challenging computational problems. Nvidia is now a full-stack computing infrastructure company with data-center-scale offerings that are reshaping the industry. The company’s full stack includes the foundational CUDA programming model that runs on all Nvidia GPUs, as well as hundreds of domain-specific software libraries, software development kits, or SDKs, and Application Programming Interfaces, or APIs. This deep and broad software stack accelerates the performance and eases the deployment of Nvidia accelerated computing for computationally intensive workloads such as artificial intelligence, model training and inference, data analytics, scientific computing, and 3D graphics, with vertical-specific optimizations to address industries ranging from healthcare and telecom to automotive and manufacturing. Nvidia reports in two business segments: Compute & Networking and Graphics. The Compute & Networking segment (78% of revenue, 85% of operating income) is comprised of Data Center accelerated computing platforms and end-to-end networking platforms, including Quantum for InfiniBand and Spectrum for Ethernet; NVIDIA DRIVE automated-driving platform and automotive development agreements; Jetson robotics and other embedded platforms; Nvidia AI Enterprise and other software; and DGX Cloud software and services. The Graphics segment (22% of revenue, 15% of operating income) includes GeForce GPUs for gaming and PCs, the GeForce NOW game streaming service and related infrastructure; Quadro/NVIDIA RTX GPUs for enterprise workstation graphics; virtual GPU, or vGPU, software for cloud-based visual and virtual computing; automotive platforms for infotainment systems; and Omniverse Enterprise software for building and operating metaverse and 3D internet applications.
Target Price: $280; Rating One
Checkpoint: $175
RISKS: Market and interest rate risk, credit risk, country risk, and operational risk, including cybersecurity.
Palantir Technologies PLTR; $123.06; 1,685 shares; 3.38%; Sector: Financial Services
UPDATE: After falling 20% in Q2 2026, shares of Palantir ($PLTR) clawed back a good chunk of that decline and closed July up mid-single digits. Fortunately for the Portfolio, we picked up a slug of PLTR shares at $107.26 in late June. On July 1, the company announced a strategic AI partnership with Nvidia focused on deploying AI models for U.S. government agencies and critical infrastructure. From there, the stock spent most of the month digesting that move rather than extending it, trading in a range between $120 and $135. Late in the month, PLTR shares traded off on reports of new open-sourced global intelligence platforms and cheaper Chinese AI models. Our view is that governments and large global companies are not apt to rest their businesses on open-sourced models or cheaper Chinese AI given cybersecurity and other concerns. When Palantir reports its Q2 2026 results on August 3, the market will be eyeing the growth rates for its Government and Commercial sectors relative to Palantir’s 70% target growth rate for this year. At Palantir’s AIPCon 10 event in early June, reports pointed to winning customers in the legal sector and with neoclouds. Those and other wins, including the $300 million Blanket Purchase Agreement to support the National Farm Security Action Plan bode well for a quarter over quarter lift in the company’s total contract value and total remaining performance obligation figures. Exiting Q1 2026 the total RPO figure stood at $4.45 billion, up from $4.08 billion at the end of 2025.
July Price Change: 5.5%; Yield: 0.0%
INVESTMENT THESIS: Palantir Technologies specializes in big data analytics and builds software platforms that help organizations integrate, analyze, and make sense of vast amounts of data for both commercial and government clients. While much has been made about the company’s exposure to the federal government, its software is used across 90 industries, and the larger global government sector accounted for 55% of revenue last year. The balance was from the commercial sector. Exiting 2025, Palantir’s U.S. Commercial remaining deal value (RDV) stood at $4.38 billion, up 145% year over year, and its Total Contract Value (TCV) stood at $10.8 billion, up 128% year over year. We will continue to monitor Palantir’s RDV and deferred revenue metrics. Key items to watch include continued diversification of its customer base across industries and increasing revenue per customer. Because we are still in the relatively early innings of AI adoption, we are inclined to be long-term owners of PLTR shares.
Target Price: $220; Rating: One
Checkpoint: $90
RISKS: Economic and IT budget spending risk, technology risk, competition and competitive pressures, and customer acquisition risk.
TJX Companies TJX; $157.34; 1,322 shares; 3.40%; Sector: Financial Services
UPDATE: After TJX Companies ($TJX) fell from a high near $170 in mid-June, we used the ensuing pullback and concerns over renewed inflation pressures on consumer spending to add to our position on July 16 at $154.71. As we made that move, we also upgraded our rating to One from Two and reset our checkpoint level to $135. That was timely given the move higher that led TJX to close July up mid-single digits. With the prospect we see for inflation pressures that will weigh on consumer disposable income and therefore spending, as we get ready for the shopping-heavy second half of the year, we remain bullish on TJX shares. We’d remind you that because TJX sources its goods through liquidations of excess inventory, brand closeouts, overruns and order cancellations, its exposure to tariffs is smaller than other retailers. When TJX reported its latest quarterly results, it included comp sales of 6%, well ahead the majority of other retailers. For the current fiscal year that ends in January 2027, TJX increased its consolidated comparable sales outlook to a rise of 3% to 4%, from its prior forecast of 2%-3%. With renewed inflation tailwinds, we suspect even that increased outlook is likely to prove conservative. We continue to monitor consumer spending and inflation data as a potential springboard to revisit our $185 target in the months ahead. During the April quarter, TJX repurchased 3.8 million shares for a total price of $604 million, which implies an average cost basis near $159. That makes our May and July TJX buys look even better. TJX stepped up its buyback intention for the current year to $2.75 billion-$3 billion, $250 million higher than the range shared back in January. In early June, TJX declared its next $0.48 per share quarterly dividend will be paid on September 3 to shareholders of record on August 13. With roughly 3.4/% of the Portfolio’s assets in TJX, we have some room to add to that exposure as we gear up for the shopping filled second half of the year.
July Price Change: 3.9%; Yield: 1.2%
INVESTMENT THESIS: The TJX Companies is the leading off-price apparel and home fashions retailer in the United States and worldwide. It has over 5,200 stores and six branded e-commerce sites that offer a rapidly changing assortment of quality, fashionable, brand-name, and designer merchandise at prices generally 20% to 60% below full-price retailers’ regular prices on comparable merchandise. The company operates in four segments: Marmaxx and HomeGoods, both in the U.S.; TJX Canada, and TJX International. TJX looks to capitalize on opportunities to acquire merchandise at substantial discounts that regularly arise from the production and flow of inventory in the apparel and home fashions marketplace. These opportunities include, among others, closeouts from brands, manufacturers, and other retailers; special production direct from brands and factories; order cancellations; and manufacturer overruns. We see that positioning TJX extremely well, as consumers feel the pinch of ongoing inflation pressures and their efforts to stretch the disposable spending dollars they do have, including tapping discounted shopping locations. When TJX reported its January 2026 quarter, management shared plans to grow the company’s footprint. During the May 2026 earnings call, management signaled they are actively evaluating raising their long-term store count target beyond 7,000, pointing to adjacent markets and new ventures. Exiting the April 2026 quarter, TJX’s total store count stood at 5,262 locations.
Target Price: $185; Rating: One
Checkpoint: $135
RISKS: Operational, strategic buying programs, and competitive risks, as well as consumer spending patterns.
TWOS
Alphabet GOOGL; $356.13; 600 shares; 3.49%; Sector: Communication Services
UPDATE: July was another challenging month for Alphabet ($GOOGL) shares, but following quarterly results from Microsoft and Amazon that restored investor confidence in the AI and data-center buildout, GOOGL shares rebounded to finish the month with a slight decline. Even so, the shares remained a positive contributor to the Portfolio’s year-to-date performance. There were two main drivers to the stock’s decline ahead of those earnings reports from Amazon and Microsoft. The first was a Bloomberg report mid-month that Gemini 3.5 Pro, Google’s next flagship AI model, was running months behind schedule. That same day, the European Commission hit Alphabet with a €4+ billion Digital Markets Act fine and ordered Google to open 11 Android features to rival AI assistants and share anonymized Search data with competitors, including OpenAI. The near-term business impact is limited — the Android changes phase in with the 2027 release and search data sharing doesn’t start until January 2027 — but it extends a multi-year pattern of regulatory pressure on Google’s core business. On July 22, Alphabet reported its Q2 2026 quarterly results, which confirmed the company is benefiting both internally and externally from the adoption of AI. Search revenue grew 17% to $63.3 billion, with retail and finance advertisers leading the way. During the earnings call, Alphabet management explained that folding AI Overviews and AI Mode into a single search experience is pulling in more queries without cannibalizing the ad business. YouTube ads grew 13% to $11.1 billion, helped along by a World Cup viewership boom that made it the most-watched World Cup in the platform’s history. Moreover, the cost of serving those AI answers came down in the quarter leading the operating income generated by Google Services to grow far faster than revenue. Margins at Google Cloud continued to improve even as the business’s revenue climbed more than 80% year over year and roughly 24% sequentially. Let’s factor in that $514 billion backlog figure for Google Cloud the company had exiting Q2 2026. Quickly it was up some $50 billion quarter over quarter, which was twice the revenue reported for the quarter. But here’s what really caught our eye: Google management expects to convert just over half of that into actual revenue over the next two years. Ball Park that at ~$260 million and it’s roughly a six-fold increase compared to the Google Cloud revenue delivered in H1 2026. In our view, that explains why Alphabet raised its 2026 capital spending guidance to $195 billion–$205 billion, up from $180 billion–$190 billion and reiterated another leg up in next year’s capex. To be clear, we are not fans of the company’s negative free cash flow for the quarter and the prospects for it to continue in the coming ones but we understand the backlog levels being put up for Google Cloud that provide support for that buildout, and the company’s ability to monetize that added capacity. Following the cumulative decline of the last few months, we are closely tracking the shares with an eye toward possibly adding to our position and potentially revisiting our rating with an upward bias.
July Price Change: -0.3%; Yield: 0.2%
INVESTMENT THESIS: We believe that while search and digital ad dominance are what will carry the shares in the near-to mid-term, longer-term, it is the company’s artificial intelligence “moat” that will provide for new avenues of growth. Alphabet surpassed 350 million paid subscriptions across Google One and YouTube. AI is what has made the company’s search, video, and targeted ad capabilities best-in-class and is the driving force behind the company’s success in voice (Google Home) and autonomous driving (Waymo). Furthermore, we believe it is this AI expertise that will also make the company more prevalent in other industries, including healthcare via its subsidiary Verily, as AI and machine learning continue to disrupt operations across industries. As of mid-2206, Google’s Gemini app had over 900 million monthly active users. Adding to our positive view of the company’s future opportunities, we believe that Alphabet’s free cash flow generation and solid balance sheet set it apart and are what will allow the company to continue taking chances on far-out, ground-breaking, and potentially world-changing projects, as well as fund capital returns to shareholders. We will continue to monitor advertising spend as well as the competitive landscape for the company’s core Search and Advertising business.
Target Price: Reiterate $410; Rating: Two
Checkpoint: $305
RISKS: Regulatory risk (data privacy), competition, and macroeconomic slowdown impacting consumers and therefore ad buyer activity.
Amazon AMZN; $271.58; 801 shares; 3.55%; Sector: Consumer Discretionary
UPDATE: Similar to other companies in the Portfolio, shares of Amazon ($AMZN) vacillated up and down during most of July along with the market amid questions over AI and data-center spending. Arguably, Amazon’s June-quarter results and the metrics reported for Amazon Web Services (AWS) helped to quell those concerns, leading the shares to finish July up in the low double-digits. In response to what we saw between the company’s June-quarter results, guidance and earnings call commentary, we lifted our AMZN price target to $325 from $310 and reset our checkpoint level to $325. Those increases reflect our thinking that Amazon should benefit as consumers contend with renewed inflation pressures, prospects for further monetization of AI, cloud, and chips as well as continued gains for its high-margin advertising business. Helping support our line of reasoning is the rebound in July oil prices and the accelerated revenue growth at Amazon Web Services (AWS), step up in AWS margins and surge in AWS backlog. And as we’ve discussed with Meta and Google, the mid-term election cycle is expected to deliver record levels of advertising spend. Backlog at AWS climbed to $496 billion at the end of the quarter, up dramatically from $364 billion exiting March, which points to rising AI adoption and expanding usage and alleviates questions over the step up in the company’s capex levels. During Amazon’s earnings call, management reminded investors that data-center capital is spent up to two years before monetization can begin but they generate revenue immediately upon opening. Management also addressed the market’s concern over AI spending and free cash flow sharing, “As we get a few years out and the revenue growth outpaces the incremental CapEx growth which will happen at some point, the resulting revenue, free cash flow and return on invested capital is very compelling.” During the June quarter, Amazon spent $53.1 billion in capex, primarily tied to AWS and generative AI infrastructure. Factor in the $43.2 billion spent in the March quarter, and management’s revised capex forecast of $220 billion for this year means a big step up in spending in H2 2026. Even at that higher spending level, the company said it will not have enough capacity to meet all of its 2026 demand. Combined with management’s comments above, it means that, like the other hyperscalers, we’re likely to see 2027 capex at Amazon be higher year over year. This means, just like with the other hyperscalers, we’ll want to keep track of Amazon’s operating cash flow and the margins that drive it. A more detail view on Amazon’s June-quarter results and our takeaways can be found here. In terms of our current Two rating, a pullback back to the 50-day moving average near $247 would likely trigger our revisiting that rating, subject to what the forces were that led that to happen.
July Price Change: 13.9%; Yield: 0.0%
INVESTMENT THESIS: We believe that upside will result from Amazon’s continued e-commerce dominance, AWS’s continued leadership in the public cloud space, and the ongoing growth of the company’s advertising revenue stream, which feeds off Amazon’s e-commerce business. Additionally, we think profitability will continue to improve as AWS and advertising account for a larger portion of total sales, as both these segments sport higher margins than the eCommerce operation. While we believe the increasing share of the revenue from these higher-margin businesses will be key to driving profitability longer-term, we think margins on eCommerce stand to improve as the company’s infrastructure is further built out and economies of scale further kick in. The embedded call option is that management is always looking to enter a new space and generate new revenue streams. Outside of the company’s core businesses, per recent 13F-HR filings, Amazon holds a stake of 158.36 million shares in Rivian, 225,428 shares in Marvell, as well as positions in other companies. It has also committed to a $50 billion investment in OpenAI.
Target Price: Reiterate $325; Rating: Two
Checkpoint: $225
RISKS: High valuation exposes the stock to volatile swings, e-commerce has exposure to slower consumer spending and competition, potential headwinds resulting from new e-commerce regulation in India, and management is not scared to invest aggressively for growth, which can at times cause volatile reactions as near-term concerns arise relating to the impact on margins.
Apple AAPL; $308.91; 750 shares; 3.78%; Sector: Technology
UPDATE: Despite the last day of the month selloff in Apple ($AAPL) that followed its June-quarter results, the shares were still a positive contributor to the Portfolio with their low single-digit gain. While modest, Apple still outperformed the S&P 500 in July. As we explained in our analysis of Apple’s results and guidance, we saw three factors behind that drop in the shares. The first is Apple’s guidance for the current quarter that came up short relative to what the market was anticipating both on the top line and margins due to supply chain pressures expected to intensify in the current quarter. Tied to that supply chain pressure is the second factor: Excluding the impact of tariff refunds on Apple’s June-quarter results, we find its gross margin contracted quarter over quarter. Third, Services revenue, which came in at a $30.74 billion record, was shy of the $31.36 billion market forecast. We’d also add that the run-up in AAPL shares ahead of earnings left little room for disappointment, despite potential for supply chain concerns to weigh on the company’s outlook. With the benefit of hindsight, our decision to trim back the Portfolio’s AAPL position in mid-July at $331.26 was a prudent one. Several months ago we noted our concerns over memory and other component constraints as companies like Micron shifted capacity to meet AI and data center demand at the expense of PCs and other end markets. We also suspected there would be a pull forward in demand by consumers and businesses ahead of potential shortages but also higher prices as OEMs looked to protect margins and pass through those higher component costs. We are seeing that flow through the system as showcased by Microsoft’s current-quarter guidance for its More Personal Products segment. What’s different with Apple is the pending launch of new iPhone models alongside the overhauled Apple Intelligence and Siri AI. Morgan Stanley estimates that more than 850 million active iPhones are incapable of running basic Apple Intelligence queries, while over 1.3 billion devices cannot use the most advanced AI-powered Siri features. That suggests the potential for a massive upgrade cycle, provided the upcoming iOS 27 software release delights exiting iPhone users and wins over current Android ones. And yes, they will likely carry higher price tags, but taking this into account, Apple recently a launched its Apple Upgrade program, which is a new program provided by Klarna that spreads payments for Apple products between 12 to 36 months depending on the product. And those higher price tags, along with the phase in of ones for other Apple products in June, give us reason to think the market could be underestimating Apple’s revenue in the December quarter and for 2027. What we see in upcoming quarterly shipment data matched against Apple’s product prices will tell us if our thinking is correct. Recognizing that potential, we will remain AAPL shareholders despite the setback in the shares Friday. Based on that shipment data as well as consumer reception to iOS 27, Apple Intelligence and Siri AI as well as the upcoming new iPhone models, we’ll revisit our price target as needed. Ahead of those learnings, if we see AAPL fall near the 100-day moving average, based on what we know as of today, that would be a nice spot to pick up some additional shares.
July Price Change: 6.8%; Yield: 0.3%
INVESTMENT THESIS: While we acknowledge that near-to-mid-term performance remains heavily influenced by iPhone sales, the dynamic is shifting as investors finally place greater emphasis on Services growth. We are bullish on the 5G upgrade cycle and believe longer-term upside will continue to come as Services revenue grows its share of overall sales. Services provide for a recurring revenue stream at higher margins, a factor that serves to reduce earnings volatility while allowing for a higher percentage of sales to fall to the bottom line; as a result, we believe that Services growth and the installed base are much more important than how many devices the company can sell in each 90-day period. In addition to improved profitability, we also believe the transparent nature of this revenue stream will demand an expanded price-to-earnings multiple as segment sales grow. Furthermore, we believe that Apple’s desire to push deeper into the healthcare arena will help make its devices invaluable as more life-changing features are added and the company works to democratize health records.
Target Price: Reiterate $305; Rating: Two
Checkpoint: $268
RISKS: Slowdown in consumer spending, competition, lack of new product innovation, elongated replacement cycles, and failure to execute on Services growth initiatives.
Applied Materials AMAT; $507.67; 318 shares; 2.64%; Sector: Semiconductors
UPDATE: After soaring more than 100% in Q2 2026, shares of Applied Materials ($AMAT) finished July significantly lower, making them a drag on the Portfolio. On July 21, we used that pullback to scoop up more shares for the Portfolio at $556.34. Also factoring into that decision were July developments that reinforce our late June decision to increase our AMAT price target to $800. TSMC raised 2026 capex guidance twice this year: first to $52 billion–$56 billion, then again to $60 billion–$64 billion — a new all-time high, roughly 15% above the original midpoint. Samsung plans to spend over 110 trillion won ($73.3 billion) on chip expansion and R&D in 2026 — a 22% jump from 2025’s 47.5 trillion won, and now above TSMC’s outlay. Micron has hiked its fiscal 2026 capex guidance twice — from $18 billion to $20 billion, then to over $25 billion — to support HBM and 1-gamma DRAM. In the nearer-term, global semiconductor equipment sales are projected to reach $145 billion in 2026, building toward a record $156 billion by 2027. As we see it, tight chip industry capacity is pushing demand for Applied’s semiconductor systems business and its gross margins, which are approaching 55%. Taking the 11% year-over-year revenue increase booked in the reported April-quarter against management’s guidance of $8.95 billion for the current July quarter implies a 17% year-over-year increase for those two quarters. That suggests a far stronger revenue ramp in the back half of 2026 and into 2027. Following thesis-confirming comments from Samsung regarding its semi-cap spending plans as well as the beat-and-raise June quarter at Lam Research, we used the continued pressure on AMAT shares to scoop up more for the Portfolio on July 30 at $485. Following the subsequent pop in AMAT shares, and based on incoming data points, we’ll revisit both our AMAT price target and rating as needed.
July Price Change: -29.8%; Yield: 0.4%
INVESTMENT THESIS: The outlook for semiconductor capital equipment, an industry that delivered ~$133 billion in 2025, remains very bright. SIA sees industry deliveries rising to $145 billion this year and $156 billion in 2027, and others see a continued step function higher through 2030. Underpinning that forecast is continued spending on AI and data centers, and corresponding equipment, as well as other connected devices, including appliances as well as cars and trucks. Applied Materials holds a leading position in the global semiconductor wafer fabrication equipment (WFE) market, with a market share estimated at approximately 19% in 2025. As a broad-portfolio supplier, it dominates in deposition (44% share) and maintains a strong presence in etch, CMP, and ion implantation tools. Major customers include TSMC, Samsung, Intel, SK Hynix, and Micron, along with key partnerships involving Apple and Texas Instruments
Target Price: Reiterate $800; Rating: Two
Checkpoint: $475
RISKS: Customer capital spending levels, currency, and economic risk.
Arista Networks ANET; $180.35; 1,410 shares; 4.15%; Sector: Technology
UPDATE: The first few weeks of July were relatively quiet for Arista Networks ($ANET) and that kept its shares more or less rangebound. However, during the last week of the month, key customers Microsoft and Meta reported their Q2 2026 results and their increased capex budgets for the coming quarters sparked a rebound that left ANET shares up mid-single digits in July. That brought their YTD move to more than 35%. Those higher customer capex budgets set the stage for Arista’s quarterly earnings report on August 4. Consensus expectations call for Arista to deliver EPS of $0.89 on revenue of $2.83 billion and guide Q3 2020 to $0.92 on $2.95 billion in revenue. To frame those revenue figures, both are up ~28% year over year. When Arista reported its Q1 2026 results, it discussed supply chain constraints as limiting its ability to convert its backlog into booked revenue. But let’s also remember that exiting Q1 2026, Arista’s total deferred revenue balance was $6.2 billion, up from $5.37 billion at the end of 2025 and up ~100% compared to Q1 2025. Between capex comments from Microsoft and Meta to rising spending at neoclouds and others in the data-center arena, we continue to see rising AI adoption and expanding usage driving demand for networking. Supporting that was the following, found in Cisco’s recently published AI impact on Wide Area Networks report – Consumer adoption of AI and agentic AI is projected to drive growth in consumer-driven network traffic ~6.6×, representing 63% additional growth compared to 4x growth in non-AI scenarios in the same period—making AI the dominant driver of overall internet traffic expansion. We will continue to track hyperscaler spending, which is expected to reach more than $750 billion this year, up 84% year over year, before rising to more than $920 billion in 2027. Goldman Sachs thinks 2027 spending could come in closer to $1.1 trillion. While the Pro Portfolio has a largely full ANET position, we will continue to look for compelling risk to reward levels for members who are underweight the shares.
July Price Change: 6.2%; Yield: 0.0%
INVESTMENT THESIS: Arista Networks engages in the development, marketing, and sale of data-driven, client-to-cloud networking solutions for AI, data center, campus, and routing environments in the Americas, Europe, the Middle East, Africa, and the Asia-Pacific. Its cloud networking solutions consist of Extensible Operating System (EOS), a publish-subscribe state-sharing networking operating system offered in combination with a set of network applications. The company offers data center, cloud, and AI networking, cognitive adjacencies, and cognitive network software and services. It also provides post-contract customer support services, such as technical support, hardware repair, and replacement parts beyond standard warranty, bug fixes, patches, and upgrade services. The company serves a range of industries comprising internet companies, cloud service providers, financial services organizations, government agencies, media and entertainment, healthcare, oil and gas, education, manufacturing, industrial, and others. Two of Arista’s largest customers in the last few years are two Portfolio holdings you’ll quickly recognize — Microsoft and Meta. Per Arista’s 10-K filings, both Meta and Microsoft each account for more than 10% of revenue. Other named customers include Amazon’s AWS, Google Cloud, Anthropic, Canva, SAP, Shopify, Apple, Oracle, Bank of America, and Accenture.
Target Price: $180; Rating: Two
Checkpoint: $134
RISKS: Economic, customer, supply chain, and competition risks.
Axon Enterprise AXON; $527.76; 388 shares; 3.34%; Sector: Aerospace & Defense
UPDATE: Following a late-June surge in shares of Axon ($AXON), the Portfolio started July by locking in a slice of those gains at just over $600. As a reminder, the catalyst that drove the shares higher in late June was a report that an account tied to President Trump bought between $1 million and $5 million of Axon stock back in February, just two weeks before ICE posted a notice seeking a five-year, $220 million Taser contract with specifications that reportedly match only Axon’s product line. While we didn’t top tick the shares, the move was a prudent one given the ensuing decline of more than 20% in the shares before a bottom near $500 late in the month. The subsequent rebound culminated in AXON being down in the mid-single digits for July. Similar to other months, we continued to share numerous positive signals about body camera and AI adoption in the public safety and related markets given the ongoing police shortage pain point. That keeps us bullish on AXON as does the positive mix shift toward the higher AI and services business. At the 46th Annual William Blair Growth Stock Conference in early June, management shared that in 2025 it sold over $750 million bookings for dedicated AI tools, and in Q1 2026 that figure climbed 140% year over year. Management also reiterated its 2028 target guidance of 28% EBITDA margins compared to the 25.5% expected for 2026. When Axon reports its quarterly results on August 5, we will see how it is progressing against that goal. We will also be focusing on Axon’s future contracted bookings, a key metric that we watch for the company. That figure dipped to $14.3 billion exiting Q1 2026, down from $14.4 billion in the prior quarter. Looking back over the last several years, that quarter-to-quarter pattern is typical and matches with Q1 being the seasonally weakest. Should we see another quarter-over-quarter decline, that would be a flag for us to investigate, but given the signals and other public safety announcements, we suspect that likelihood is low. We will also be listening for management’s comments about that incumbent ICE contract, which is set to expire on August 21.
July Price Change: -5.9%; Yield: 0.0%
INVESTMENT THESIS: Axon Enterprise develops, manufactures, and sells conducted energy devices and cloud-based digital evidence management software designed for use by law enforcement, corrections, military forces, private security personnel, and private individuals for personal defense. The company operates in two segments: Taser (recently renamed Connected Devices) and Software & Sensors (recently renamed Software & Services). Taser develops and sells CEDs used for protecting users and virtual reality training. Software & Sensors manufactures fully integrated hardware and cloud-based software solutions such as body cameras, automated license plate reading, and digital evidence management systems. Axon delivers its products worldwide and gets most of its revenue from the United States. According to Mordor Intelligence, the wearable and body-worn cameras market on its own was valued at $1.62 billion in 2020 and is expected to reach $424.63 billion by 2026. Public safety organizations are increasingly adopting cloud solutions, leading to significant spending in this area. The digital spending in public safety is projected to reach $201 billion by 2027.
Target Price: Reiterate $700; Rating: Two
Checkpoint: $400
RISKS: Manufacturing and supply chain, competitive factors, government regulation, and technology change.
Bank of America Corp. BAC; $61.95; 3,999 shares; 4.05%; Sector: Financial Services
UPDATE: Shares of Bank of America (BAC) added to their Q2 2026 gain by rising further in July, leaving them up low double digits so far this year. We locked in a very profitable slice of BAC in early July with a gain of 111% ahead of the company’s Q2 2026 earnings report, taking advantage of their overbought condition. That report was better than expected, which, as we suspected, benefited from robust investment banking activity and continued gains at its asset management business as well as reaping the benefits of trading volumes in a volatile market. It also showcased BofA’s improving operating leverage as the management team continues to focus on cost containment even as it continues to embrace technology, including AI. In late July we lifted our BAC price target to $70 from $65 to account for the company’s 14% dividend increase to $0.32 per share, that will begin with its September dividend payment. With that price target revision, we could have hung onto our One rating a wee bit longer, but with about 12% upside to that new target, BAC shares once again knocking on the door of being overbought, and the market headed for the usual end of summer doldrums, we elected to downgrade our rating to Two. If BAC shares pulled back near $56, that would be a level at which we would revisit our Two rating. Should we see investment banking activity perk up along the way, that would give us another reason to revisit things for BAC.
July Price Change: 8.7%; Yield: 2.1%
INVESTMENT THESIS: Bank of America is one of the world’s leading financial institutions, serving individual consumers, small- and middle-market businesses, and large corporations with a full range of banking, investing, asset management, and other financial and risk management products and services. The company provides unmatched convenience in the United States, serving approximately 69 million consumers and small business clients with approximately 3,700 retail financial centers, approximately 15,000 ATMs, and award-winning digital banking with approximately 59 million verified digital users. Bank of America is a global leader in wealth management, corporate and investment banking, and trading across a broad range of asset classes, serving corporations, governments, institutions, and individuals around the world. Bank of America offers industry-leading support to approximately 3 million small business households through a suite of innovative, easy-to-use online products and services. The company serves clients through operations across the United States, its territories, and approximately 35 countries. From a reporting perspective, the company’s business breaks down as follows: Net Interest Income breakdown: Consumer Banking 57%, Global Banking 23%, Global Wealth & Investment Management 14%, and Global Markets 6%; Income Before Tax breakdown: Consumer Banking 42%, Global Banking 27%, Global Wealth & Investment Management 16%, and Global Markets 15%.
Target Price: $70; Rating: Two
Checkpoint: $45
RISKS: Financial markets, fiscal, monetary, and regulatory policies, economic conditions, and credit ratings.
The Boeing Company BA; $216.14; 825 shares, 2.91%; Sector: Industrials
UPDATE: On June 15, we called up Boeing ($BA) to the Portfolio from the Bullpen with an initial slug of shares at $227.78, followed by another batch at $225.18 on June 18. We took advantage of mid-July declines to scoop up more shares between $214-$218 in mid-to late July. On July 29 following the company’s Q2 2026 earnings report, we raised our BA price target to $265 from $260 given the improving prospects for the company’s aircraft production levels that should lead margins to rebound and improve free cash flow levels. Quarterly deliveries reached 171 airplanes total, the highest since 2018, with 129 737s and 25 787s and the company targeting 500 737s for the year and 90-100 for 2026. 737 production is ramping to 47 per month in the current quarter with management targeting a new low-rate production line coming on stream that should eventually take that figure to 52 per month. 787 production has been stable at nearly eight per month, but Boeing is aiming to ramp that to 10 per month as GE Aerospace increases its engine production levels. As those production levels increase, we should see stronger deliveries in the second half of 2026 compared to the second half of 2025 and first half of 2026 as Boeing works through its record backlog of more than 6,200 airplanes exiting June at a quicker pace. And that should carry over into 2027. Improving fixed-cost absorption should help drive segment margins higher and better pricing in the company’s commercial aircraft backlog should bring some additional lift in the coming quarters. Management’s commercial aircraft operating margin target is to approach 2018 levels on the 737 and actually surpass 2018 levels on the 787 by the end of the decade, with further room to improve beyond that. For context, Boeing’s Commercial Airplane segment operating margin in 2018 was 13%, a far cry from the -2.7% posted in Q2 2026. It’s the flight path toward that low-teen operating margin and the impact on Boeing’s bottom line and cash flow that we aim to capture as owners of the shares. During the quarter, Boeing generated $631 million in free cash flow, which was ahead of the company’s guidance. Full-year guidance is unchanged at $1 billion-$3 billion in free cash flow. Longer term, management reiterated confidence in reaching $10 billion of annual free cash flow, with growth beyond that into the next decade, driven by rising commercial aircraft delivery rates and further margin improvement. That is a lofty target, but for the stock to work, Boeing only needs to get on a runway that puts that figure in sight. After increasing our BA price target on July 29, the next day we scooped up additional shares for the Portfolio. Based on upcoming monthly delivery figures, we will revisit our price target as needed.
July Price Change: -0.2%; Yield: 0.00%
INVESTMENT THESIS: Boeing is an aerospace company that reports its business in three operating segments – Commercial Airplanes (47% of 2025 sales), Defense, Space & Security (30%), and Global Services (23%). Our focus is on Boeing’s Commercial Airplane business, the operational leverage and EPS improvement that should follow increasing production levels. Factors fueling the rise in new aircraft demand, which is reflected in Boeing’s multi-year backlog, include pandemic passenger travel, the need to replace aging, inefficient fleets, and supply chain delays that have artificially tightened aircraft availability. Industry projections indicate that airlines will require over 43,000 new aircraft — primarily single-aisle jets — to meet rising passenger traffic and replace older, less efficient models.
Target Price: $265; Rating: Two
Checkpoint: $190
RISKS: Industry demand, defense spending, supply chain, and competitive risk.
Eaton Corp. ETN; $415.20; 568 shares; 3.85%; Sector: Industrials
UPDATE: Despite a strong rebound in Eaton ($ETN) shares in the second half of July, the position was drag on the Portfolio during the month. Based on the accelerating order books for both of Eaton’s Electrical segments that led to meaningful gains in their backlog levels, we continue to see Eaton benefiting from efforts to address rising electricity demand pain points. At the same time, Eaton’s Aerospace business stands to benefit from rising production and aircraft deliveries from Boeing and Airbus. Those tailwinds led Eaton management to lift its organic sales forecast for 2026 when it reported its June-quarter results, which came in ahead of market expectations. Eaton also lifted its 2026 EPS outlook to $13.40-$13.60 from $13.05-$13.50. That lifting of the bottom-end of the range is way more than the $0.08 EPS beat Eaton delivered for the June quarter. What helps explain that is the increase in expected organic revenue growth to 11%-13% from 9%-11% shared back in April. In our view, this reflects the strong order books and building backlog at the Electrical segments as well as the Aerospace ones. It also reaffirms why we have ETN in the Pro Portfolio. While those figures offer us a reason to nudge our ETN price target higher from $450, we’d rather wait for two things before we potentially make that move. One of those is capital spending comments from additional public electric utilities that will report in the next few weeks. What we’ve heard so far from Dominion Energy, Next Era Energy, and Southern point to a strong spending in the back half of this year and 2027. That’s encouraging but let’s hear from a few more so we avoid any extrapolation mistakes. Second, as we’ve discussed, Boeing reports monthly aircraft deliveries, and as those figures climb, it will give us a reason to revisit our ETN price target. To be clear, we see strong multi-year tailwinds across Eaton’s businesses, and the benefit of that on revenue, profits and EPS is what we aim to capture with the shares. A more detailed view of our findings from Eaton’s June quarter earnings report can be found here.
July Price Change: -2.6%; Yield: 1.1%
INVESTMENT THESIS: Eaton is an intelligent power management company that makes products for data center, utilities, industrial, commercial, machine building, residential, aerospace, and mobility markets. That business is positioned to capitalize on the mega trends of electrification, energy transition, and digitalization. We see Eaton helping address the power pain point created by data center, EV charging infrastructure, and other drivers of electricity demand. Research estimates that data center power demand will grow 160% by 2030, accounting for 3% to 4% of global power, up from 1% to 2% today. Data centers will use 8% of U.S. power by 2030, compared with 3% in 2022.
Target Price: Reiterate $450; Rating: Two
Checkpoint: $340
RISKS: Raw material costs, labor costs, end market volatility, and government legislation.
First Trust Nasdaq Cybersecurity ETF CIBR; $91.83; 2,435 shares; 3.65%; Sector: Cybersecurity
UPDATE: Shares of the First Trust Nasdaq Cybersecurity ETF ($CIBR) had a strong finish to the end of July, which led them to close the month up nicely. That lifted their YTD gain to nearly 28%. Our position remains that AI in the hands of bad actors would not only accelerate the velocity of cyberattacks but also expand their scope. We see further attack vectors driving the need for greater cybersecurity spending in the coming quarters and developments in July reaffirmed our thinking. July saw several notable cyber incidents. Coca-Cola’s Fairlife dairy unit, a $4 billion brand, disclosed on July 16 that a ransomware attack forced it to suspend U.S. production (Canadian operations were unaffected); product safety wasn’t compromised, and as of mid-July no group had claimed responsibility. Ford Motor Company reportedly appeared on a data-leak forum tied to the Krybit ransomware group, with the scope still under investigation. European critical infrastructure also came under sustained attack, with incidents targeting Poland’s energy grid and water treatment systems, a Swedish thermal plant, and a Norwegian dam, several attributed to Russia-linked actors. Perhaps most significant technically was JadePuffer, which Sysdig researchers identified as the first fully autonomous, end-to-end AI-agent-driven ransomware operation: after exploiting a Langflow vulnerability, an LLM agent independently handled reconnaissance, credential theft, lateral movement, and encryption, hitting over 1,300 records on July 4 without human direction. The Conduent breach, first disclosed earlier in the year, also grew, with affected individuals surpassing 62 million by July. Following hacking reports by rogue AI agents from first OpenAI and then Anthropic, we added further to our CIBR position on July 30. We remain bullish on the long-term prospects for cybersecurity spending as companies, governments, and other institutions need to protect their crown jewels, what we see in Q2 2026 bookings and backlog figures from key CIBR constituents will influence the next move for our price target after increasing it to $105 in mid-July.
July Price Change: 2.2%; Yield: 0.3%
INVESTMENT THESIS: The First Trust Nasdaq Cybersecurity ETF seeks investment results that correspond generally to the price and yield (before the fund’s fees and expenses) of an equity index called the Nasdaq CTA Cybersecurity Index. The Nasdaq CTA Cybersecurity Index is designed to track the performance of companies engaged in the cybersecurity segment of the technology and industrial sectors. It includes companies primarily involved in the building, implementation, and management of security protocols applied to private and public networks, computers, and mobile devices to protect the integrity of data and network operations. To be included in the index, a security must be listed on an index-eligible global stock exchange and classified as a cybersecurity company as determined by the Consumer Technology Association. Each security must have a worldwide market capitalization of $250 million, have a minimum three-month average daily dollar trading volume of $1 million, and have a minimum free float of 20%.
Target Price: Reiterate $105; Rating: Two
Checkpoint: $75
RISKS: Cybersecurity spending, technology and product development, the timing of the product sales cycle, new products, and services in response to rapid technological changes and market developments, as well as evolving security threats.
Marvell Technology MRVL; $187.56; 865 shares; 2.65%; Sector: Technology
UPDATE: As painful as July was for the Portfolio’s position in Marvell ($MRVL), and it was with a sizable double-digit drop, MRVL is still one of the Portfolio’s best performers in 2026 with a YTD return of more than 125%. Fortunately, we prudently and profitably reduced our exposure to MRVL shares in Q2 2026 and used the July decline to start to rebuild our position. To that end we added shares three times in July – on the 14th at $227.36, on the 21st at $205.66 and the 30th at $176.83. We made those moves based on data that pointed to rising AI adoption and expanding usage, but it was the confirmation that hyperscaler capital spending levels would step up in a big way in H2 2026 that led MRVL shares to rebound into the end of July. Arguably the standout comment found in Amazon’s Q2 2026 earnings press release was that its Chips business eclipsed a run rate of more than $25 billion in the quarter, growing triple-digit percentages year over year. Marvell’s revenue for the current quarter is projected to grow double digits sequentially, with at least 10% sequential growth in each of the following two quarters. Some back-of-napkin math puts that revenue at $11.5 billion for the current fiscal year that ends in January 2027, but Amazon’s revelation suggests those figures could be conservative. Looking further out, Marvell noted its data-center revenue growth in fiscal 2028 is expected to pick up to ~55% year over year. The communications end market is still slated to deliver low single-digit percentage revenue growth in fiscal 2028. Putting those pieces together, total company revenue is forecasted to grow approximately 45% in fiscal 2028, which implies ~ $16.5 billion, roughly $1.5 billion higher than management’s prior guidance and the market consensus. Custom AI silicon wins that should come on stream in the coming quarters drives the company’s $10 billion custom revenue target for fiscal 2029. As we think about that, consider that Marvell’s new total revenue target for this year is $11.5 billion. We will continue to play the long game with Marvell, especially since we are still in the first third of the ball game. We will continue to track monthly revenue reports from Taiwan Semi and Foxconn as well as AI and data server shipments from Dell and Hewlett Packard Enterprise. While we will be mindful of the Portfolio’s overall chip exposure, we are inclined to boost our MRVL exposure in a prudent fashion.
July Price Change: -37.0%; Yield: 0.1%
INVESTMENT THESIS: Marvell is a fabless supplier of high-performance standard and semi-custom infrastructure semiconductor solutions. These solutions power the data economy, enabling the data center, carrier infrastructure, enterprise networking, consumer, and automotive/industrial end markets. With roughly 75% to 80% of Marvell’s revenue stream tied to digital infrastructure, we see it continuing to benefit from rising content consumption and creation. Pointing to that rising demand that necessitates network densification and the build of digital infrastructure, Ericsson sees global monthly average usage per smartphone reach 46 gigabytes (GB) by the end of 2028, versus 19 GB in 2023 and 15 GB in 2022.
Target Price: Reiterate $340; Rating: Two
Checkpoint: $185
RISKS: Technology risk, customer risk, competition risk, reliance on manufacturing partners, and supply chain constraints.
Microsoft Corp. MSFT; $464.72; 473 shares; 3.59%; Sector: Technology
UPDATE: Microsoft ($MSFT) shares started July in rough shape — down roughly 21% year-to-date, making them one of the weakest of the “Magnificent Seven.” The shares were coming off a 52-week low in late June that reflect AI-capex spending fears that intensified further in July. The shares spent most of July consolidating in the $380s–$390s and were stuck trading below their 50-day and 200-day moving averages. Following Microsoft’s June-quarter results and guidance on June 29, which showed cloud revenue acceleration and an uptick in margins as well as backlog levels, the market’s concerns over the continued ramp in AI and data center spending abated. That along with short-covering in led the stock to pop, leaving MSFT shares up more than 20% for July. Given the spending that is expected to happen, Microsoft management made sure to say it expects to remain free-cash-flow positive over the coming 12 months, in other words, fiscal year 2027. What they did not mention was a targeted number, which reading between the lines means we should expect further free cash flow compression as spending ramps into the back half of calendar 2026 and beyond. What the team is likely looking to avoid is the market reaction to the air-pocket we just saw in Meta’s own free cash flow numbers. Microsoft’s margin guidance also suggests it will continue to manage the impact of that ramping capacity. For fiscal 2027, the team guided to full-year operating margin down less than a point, which tells us the AI infrastructure drag on gross margin is expected to persist, but the operating leverage story — double-digit revenue growth in the coming year vs. mid-to-high-single-digit opex growth — should keep operating margin roughly stable rather than eroding. The primary source of Microsoft’s capital spending is operating cash flow. That separates Microsoft from others in the pack, but the long-term play with it is the same as the others — waiting for when that capex finally translates into durable free cash flow growth rather than just revenue growth. That likely means MSFT shares will bob and weave in the coming months, and that keeps our Two rating and $500 price target intact for now. In our view, folks interested in picking up MSFT shares should at a minimum wait for the current bout of short covering to fade and look for a positive test of support levels. The next layer is the 200-day moving average near $433; after that the next stop is near $399, which is where both the 50-day and 100-day simple moving averages are. We’ll also mark our calendars for potential updates when Microsoft appears at the Deutsche Bank Technology Conference on August 27, the Goldman Sachs Communacopia & Technology Conference on September 9, and the Citi Global Tech Conference on September 10.
July Price Change: 24.6%; Yield: 0.8%
INVESTMENT THESIS: We believe the cloud to be a secular growth trend and that the upside to the shares will result from Microsoft’s hybrid cloud leadership as the company grabs market share in this expanding industry. While companies may look to build out multi-cloud environments, Microsoft’s Azure offering will be a prime choice thanks to its decision to provide the same “stack” used in the public cloud to companies for their on-premises data centers. Additionally, we would note that hybrid environments are currently the preference for most companies because they allow them to maintain critical data in-house while taking advantage of the agility and scalability provided by public clouds. Outside of the cloud opportunity, we maintain a positive view on the company’s growing gaming business, which we believe is becoming an increasingly prominent factor in the Microsoft growth story as gaming becomes more mainstream, management works to convert its gaming revenue from a one-time license purchase to a recurring subscription model, and as technologies like augmented/virtual reality evolve. Finally, as it relates to LinkedIn and other subscription-based services such as O365 and various Dynamics products, we continue to value them highly for their recurring revenue streams, which, we remind members, provide for greater transparency of future earnings.
Target Price: $500; Rating: Two
Checkpoint: $345
RISKS: Slowdown in IT spending, competition, and cannibalization of on-premises business by the cloud.
Morgan Stanley MS; $210.51; 1,150 shares; 3.95%; Sector: Financial Services
UPDATE: In July, shares of Morgan Stanley ($MS) added to the gains they registered over the last several months, leaving them up just shy of 20% YTD exiting the month. While there were some lingering questions over the timing for OpenAI’s eventual IPO following Cerebras and SpaceX breaking below their respective IPO prices, Morgan Stanley’s Q2 2026 results bested market expectations fueled by investment banking strength, favorable trading volumes, and asset management businesses. We see the tailwind for those revenue drivers continuing in the second half of the year. Following those results, however, we opted to maintain our current MS price target after having it lifted multiple times as IPO and M&A activity strengthened in H1 2026. As we see the strong investment banking backlogs at Goldman Sachs, JPMorgan Chase, Morgan Stanley, BofA and others become announced transactions and offerings, that would be a catalyst for us to once again revisit our MS target. When Goldman reported its Q2 2026 results, it indicated that its investment banking backlog hit a five-year high, and that bodes well for offerings and dealmaking activity, especially at Morgan Stanley given its league table positioning. We will also keep tabs on new IPO filings, and which companies are named as leading those transactions. Morgan Stanley’s new quarterly dividend of $1.15 per share, which was announced shortly after the results of the Fed’s annual bank stress tests, will be paid on August 14 to shareholders of record on July 31. Alongside its Q2 2026 results, Morgan Stanley also reauthorized a multi-year common equity share repurchase program of up to $20 billion, without a set expiration date, beginning in the third quarter of 2026.
July Price Change: 0.7%; Yield: 2.2%
INVESTMENT THESIS: Morgan Stanley reports in three business segments: Institutional Securities (42% of trailing 12-month revenue, 38% of trailing 12-month Income Before Tax), Wealth Management (48%, 55%), and Investment Management (10%, 6%). While the IPO window has yet to reopen, the potential IPO class for 2025 continues to build with recent additions including Klarna and StubHub. That would be a boon to private equity firms and others that have been nursing IPO candidates during the dark period and a positive for Morgan Stanley’s investment banking business. Expected deregulation under the Trump administration is a potential catalyst for Morgan’s M&A business. Meanwhile, folks continuing to be behind in retirement savings bodes well for Morgan Stanley’s wealth management business in the coming quarters, while continued market volatility bodes well for its equity trading business.
Target Price: $225; Rating: Two
Checkpoint: $180
RISKS: Market and interest rate risk, credit risk, country risk, and operational risk, including cybersecurity.
Paccar Inc. PCAR; $132.68; 1,080 shares; 2.34% Sector: Industrials
UPDATE: During June we started the Portfolio’s position in Paccar ($PCAR) and increased our exposure mid-month. We benefited from that in June and the shares continued to climb in July, increasing another 10%. That move reflected the confluence of rising heavy truck orders and truck freight activity and tight industry capacity. Those factors and the Q1 2027 EPA mandate pull forward we discussed when initiating our position came together and led Paccar to deliver a solid Q2 2026 earnings report. Those dynamics also led the management team to discuss stronger truck delivery prospects in the U.S and the likelihood of incremental pricing action that should drive continued margin expansion at its core North American truck business. Meanwhile, the European business should benefit for similar dynamics in that market. In response we lifted our PCAR price target to $155 from $135 and raised our checkpoint level to $115 from $95. We will continue to follow monthly industry order figures, freight traffic metrics and related data and revisit our new price target as necessary. With the recent climb in the shares landing them in an overbought condition, we reiterated our Two rating. On the topic of that pending 2027 EPA mandate we’ve mentioned, Paccar plans to keep selling its current engine lineup, including Cummins-partnered engines, through 2026 and ease customers into the new compliant engines as the year progresses. Management’s read is that this smooths rather than eliminates the traditional pre-buy cliff, spreading demand more evenly and setting up a stronger, less abrupt 2027 rather than a sharp post-pre-buy drop-off. While that may be the aim, we will remain mindful of what has historically happened once these EPA mandates have gone into effect and pre-buying activity fades.
July Price Change: 10.5%; Yield: 1.1%
INVESTMENT THESIS: Paccar is a multinational company that reports in three operating segments: Truck (68% of sales), Parts (24%), and Financial Services (8%). PACCAR’s heavy-duty and medium-duty trucks are marketed under the Kenworth, Peterbilt, and DAF nameplates. Key factors affecting the Truck segment earnings include the number of new trucks sold in the markets served and the margins realized on the sales. The Portfolio’s play with Paccar shares is the pull forward in truck demand ahead of the EPA 2027 mandate that will result in tougher 2027 NOx engines regulations and add ~$10,000 to the cost of truck. Helping soften that blow, business owners and owner-operators can utilize 100% bonus depreciation (restored by the One Big Beautiful Bill Act) or Section 179 expensing to write off the entire purchase price of a qualifying heavy commercial vehicle, including new Class 8 and Class 5-7 trucks. With data from ACT Research finding the average age of a U.S. Class 8 tractor is 6.3 years, the highest in more than a decade, the ability to fully depreciate a new truck in its first year is likely a factor helping to drive replacement demand. The pull forward in demand should drive favorable operating leverage inside Paccar, and that is what we aim to benefit from by owning the shares.
Target Price: $155; Rating: Two
Checkpoint: $115
RISKS: Commercial truck demand, competition and industry pricing, inflation, and interest rate risks.
United Rentals URI; $1,079.26; 200 shares; 3.53%; Sector: Industrials
UPDATE: Following their substantial move in Q2 2026, shares of United Rentals ($URI) gave back a fraction of those gains in July, leaving the shares up more than 30% YTD. Typically, Q2 is one characterized by more construction friendly weather compared to Q1, and we saw that once again this year. That along with brisk non-residential construction activity, especially for data-center construction, re-shoring activity and power buildout led URI to deliver Q2 2026 results that easily cleared market expectations. That led us to up our URI price target to $1,250 from $1,100, and our checkpoint level to $930 from $865. In the first half of 2026, United completed $750 million in share repurchases and following the Q2 2026 results, management reiterated its $1.5 billion repurchase target to for this year. As the seasonally strong time of year for construction activity continues, fleet productivity at United should remain elevated, which should also bode well for incremental pricing action. Those conditions should remain intact for most of H2 2026, unless we fall prey to earlier-than-usual winter weather. Our focus will remain on non-residential construction activity spurred by data-center construction, re-shoring activity and power buildout that should span multiple years of activity. While that keeps us bullish on URI shares over the longer-term, we’ll continue to watch the intensity of inflation tailwinds and what that may mean for interest rates and project borrowing costs. In the near-term, if the market becomes convinced the Fed may need to do more to tame inflation, that would likely weigh on URI shares. That may trigger some prudent maneuvering with the Portfolio’s position, which means we will remain focused what incoming data tells us. Included in that oncoming stream are Q2 2026 quarterly results from construction and construction equipment companies like Caterpillar, Terex, Jacobs Solutions, Flour, and Construction Partners.
July Price Change: -4.7%; Yield: 0.7%
INVESTMENT THESIS: United Rentals, the largest equipment rental company in the world, operates throughout the United States and Canada and has a limited presence in Europe, Australia, and New Zealand. It serves industrial and other non-construction, commercial (or private non-residential) construction, and residential construction. Industrial and other non-construction rentals represented approximately 50% of rental revenue, primarily reflecting rentals to manufacturers, energy companies, chemical companies, paper mills, railroads, shipbuilders, utilities, retailers and infrastructure entities; commercial construction rentals represented approximately 46% of rental revenue, primarily reflecting rentals related to the construction and remodeling of facilities for office space, lodging, healthcare, entertainment and other commercial purposes; and residential rentals around 4% of revenue. We see the company benefiting on three fronts — the seasonal uptick in construction spending, the release of funds and projects associated with the five-year Biden administration infrastructure bill, data center construction and other re-shoring projects, and the company’s nip-and-tuck acquisition strategy that should further enhance its geographic footprint. From a technical perspective, the next layer of meaningful support clocks in near $870, and should we see the shares fall to that level, it would prompt some reconsideration of our Two rating.
Target Price: Reiterate $1,250; Rating: Two
Checkpoint: $930
RISKS: Industry and economic risk, competition and competitive pressures, and acquisition risk.
Welltower Inc. WELL; $234.44; 640 shares; 2.45%; Sector: Real Estate
UPDATE: During July, shares of Welltower ($WELL) added to the gains they registered in Q2 2026, putting them up more than 25% YTD, a considerable increase compared to the S&P 500. During the month, we continued to share signals and data points for the senior housing shortage. As such, we were not surprised by the continued climb in the shares or the better-than-expected Q2 2026 earnings report. What we saw inside that report and the company’s continued mix shift toward senior housing led us to lift our WELL price target to $265 from $230. As we discussed in that alert, the decision for the size of our target increase lies in comments from the management team that an increasing share of its senior housing portfolio is crossing the 90% and 95% occupancy thresholds, which is where pricing power really kicks in. That suggests that as occupancy growth continues, we should see an acceleration in revenue per occupied growth with that trickling down to margins and the bottom line. However, not all of that pricing benefit will be captured near-term as Welltower continues to ramp occupancy in newer locations and at recently acquired operations. During the quarter, Welltower completed more than $30 transactions across 138 communities for $6.2 billion during the quarter as it continues to grow its footprint. Over time as properties are folded into the Welltower systems, we should see occupancy levels rise followed by improving pricing and revenue per room over time. That tells us that while Welltower is guiding its year-over-year, same-store net operating income (NOI) growth in the range of 18.0% to 21.5% for this year, we should see another double-digit figure in 2027. There are a few things that we are keeping our eyes on. First, is the ability to properly staff its facilities given immigration policies and labor. While Welltower focuses on the high-end senior housing market, which should help insulate it to some degree, the ability to attract and retain caregivers remains critical. Second, as Welltower looks to grow its asset base and shift its mix further toward senior housing, a move we like, the topic of interest rates and borrowing costs to fund those transactions and bring those properties up to Welltower standards is the other. In terms of our Two rating, WELL shares can be rather choppy at times and some of that can be traced back to our second item to watch, discussed above. Should we see WELL shares pull back toward support near $223, that is when we may start to reconsider that Two rating.
July Price Change: 3.3%; Yield: 1.3%
INVESTMENT THESIS: Welltower, a real estate investment trust (REIT), owns interests in properties concentrated in major, high-growth markets in the United States, Canada, and the United Kingdom, consisting of senior housing, post-acute communities, and outpatient medical properties. We see the company benefiting from the intersection of the demographic shift that is the aging population and the looming pain point that is the shortage of inventory for senior housing, which fell below 1% in Q2 2025, according to the National Investment Center for Seniors Housing & Care. Over the next five years, more than 4 million boomers will hit age 80, and that’s in addition to the roughly 4% of the U.S. population that was 80-plus years old in 2024. As this demographic shift unfolds, we should see a relatively steady growth rate in Welltower’s revenue, NOI, and FFO, which, in turn, given its REIT status, should drive its payable dividend stream higher. Because of the favorable demographic tailwind and lower interest rate path telegraphed by the Federal Reserve, which should reduce construction costs over time, as well as bring REIT stocks back into favor, we intend to be long-term holders of WELL shares. Our plan is to build the position size methodically, increasing the Portfolio’s dividend stream along the way.
Target Price: $265; Rating: Two
Checkpoint: $215
RISKS: Operational risk, operator and tenant risk, competitive risks, and acquisition risk.
Waste Management WM; $226.55; 795 shares; 2.94%; Sector: Industrials
UPDATE: For the most part, July was a favorable month for shares of Waste Management ($WM) due in part to the market rotation out of tech and into industrial companies. However, the late-July snap back in tech made WM shares a source of funds, leaving them down mid-single digits for the month. Following the company’s Q2 2026 earnings report, on July 29 we lifted our WM price target to $265 from $255 and reset our checkpoint level to $215 from $200. Backing that decision was the continued outlook for improving margins driven by selectivity and focus on the core residential waste business, and further margin gains at the Healthcare Solutions business, which is now “fully integrated” according to management. In our view, for the next several quarters, Waste Management is likely to remain a margin-driven story first, helped along by the power of incremental pricing and cost containment. Reading between the lines, that points to a stronger margin profile for the year, but it also doesn’t mean WM’s revenue isn’t growing. Based on the company’s first-half revenue of $12.9 billion and management’s midpoint revenue guidance of $26.375 billion, WM should deliver around 4% revenue growth in H2 2026 compared to H1 2026. But what should take center stage is the expected much faster growth in adjusted EBITDA. Management reaffirmed its 2027 adjusted operating EBITDA target between $8.15 billion and $8.25 billion versus the $3.9 billion achieved in the first two quarters of this year. That implies around 9% adjusted EBIDTA growth between the first and second half. And further integration and pricing action for the Healthcare Systems business bodes well for further margin gains in 2027. Meanwhile, further pricing steps in the core residential waste business as well as further pruning of less profitable routes should be another margin driver next year. WM reaffirmed its free cash flow target between $3.75 billion and $3.85 billion. Here’s the thing: with more than 70% of its free cash flow target for the year already in hand, we would not be surprised to see those higher margins lead to a step up in free cash flow expectations for H2 2026. Given the expected free cash flow growth and Waste’s comment about the Healthcare Solutions business now being fully integrated, our thinking is the management team is likely to renew its focus on nip-and-tuck M&A transactions. While WM is the largest waste company in North America, roughly half the market is served by small- to mid-sized competitors. That gives the company ample room for the management team to further consolidate a fragmented waste industry and use its playbook to wring costs out of those acquired businesses. Over time that points to rising EPS and cash flow levels that can be used to fund other acquisitions, buybacks or dividends. During Q2 2026, WM repurchased $659 million in stock leaving about $2 billion under its current authorization. As we see it, the Waste Management story is one worth sticking with, especially if margin expansion prospects and the ones for free cash flow are growing faster than the company’s top line. The Portfolio has some room to grow our exposure to WM, but in keeping with our Two rating we’re inclined to do so at lower prices. Should we see the shares approach their 200-day moving average near $221, we would contemplate a potential rating change.
July Price Change: 1.6%; Yield: 1.7%
INVESTMENT THESIS: Waste Management’s revenue by reportable segment is 61% collection, 21% disposal, 10% healthcare solutions, 6% recycling, and 2% renewable energy. AS you can see, the core business is the inelastic waste removal business for residential, enterprise, and other customers. The company has built its footprint through a series of acquisitions and excelled at wringing costs out of them, driving free cash flow, dividends, and funding incremental acquisition activity. While the residential business is sticky, the commercial business should continue to benefit from non-residential construction activity. Margins should continue to inch higher due to disciplined pricing and increasing use of automation. We are in the early days of WM Healthcare Solutions, but we see the business growing as management integrates and cross-sells against its core business and flexes the ability to integrate nip-and-tuck acquisitions as it has at the core waste business. Here, too, we see room to consolidate a fragmented industry, which makes this a natural fit for Waste Management.
Target Price: $265; Rating: Two
Checkpoint: $215
RISKS: Industry and economic risk, competition and competitive pressures, and acquisition risk.
THREES
Meta Platforms META; $556.71; 337 shares; 3.06%; Sector: Communication Services
UPDATE: After dipping in Q2 2026, Meta’s shares rebounded near $680 in the first part of July, but as market concerns over AI related spending grew in the second half, the shares retreated. That move lower was exacerbated by the company’s disappointing Q2 2026 results, which sent the stock back near late March lows, leaving them down low single digits in July. As we explained in our analysis, while Meta’s bottom line for the quarter clearly missed expectations, that was due to escalating spending. There was little question that Meta continues to not only win advertising revenue dollars but its efforts to leverage AI to improve its monetization of those dollars are bearing fruit. What we saw in one of the key metrics that we track for Meta, Family Average Revenue per Person (ARPP), points to that success. ARPP reached $16.86 in Q2 2206, putting ahead of the $16.56 reached in Q4 2025. Other key metrics also bear that out — while daily active people rose 3% year over year to 3.60 billion in June, ad impressions delivered increased by 14% year over year and average price per ad increased by 12% year-over-year. The thing is, Meta’s guidance points to further spending ahead with total expenses hitting between $165 billion to $169 billion and that implies an increase of more than 20% in the back half of the year compared to the first half. Meta also lifted the low end of its 2026 capital spending forecast to $130 billion-$145 billion, which implies spending $80 billion to $95 billion in the back half of the year compared to the $49 billion in the last two quarters. The market is understandably focused on those spending levels and the impact to profits and cash flow even though Meta still calls for its 2026 operating income to be above that for 2025. Certainly possible, but questions stemming from spending and capex levels are making Meta once again a show-me story. That led us to downgrade META shares to a Three rating from One. Speculation is that Meta could sign a two-year, $10 billion dollar deal with Anthropic. We get that against its hiked spending plans, $5 billion a year may not sound like much, but if we see further steps in that direction, we could see the market re-think Meta’s overall spending plans and profit potential. Developments on that front could give us a reason to reconsider our Three rating. The next known Meta event is Meta Connect that will be held on September 23-24.
July Price Change: -1.2%; Yield: 0.4%
INVESTMENT THESIS: Meta segments its business between Family of App Products, which includes Facebook, Instagram, Messenger, Threads, and WhatsApp, and Reality Labs Products, which includes its metaverse and investments and future product R&D. Family of Apps accounts for about 99% of the company’s revenue and 100% of the company’s operating profits. Substantially all of Meta’s revenue is currently generated from advertising on Facebook and Instagram. Family daily active people (DAP) were ~3.6 billion on average for the June 2026 quarter. Meta forecasts its expenses to run between $165 billion-$169 billion this year while also spending $130 billion-$145 billon on capex, a significant increase year over year with a large step up in H2 2026 compared to H1 2026. Meta is positioned to benefit from the ongoing shift toward digital advertising and the adoption of AI across its entire product offering. We recognize Meta is ramping up capital spending as part of the current AI arms race, but we see that as an investment that has the potential to drive greater productivity and monetization as it expands its core advertising business further across all of its platforms. As the company shifts into harvesting that investment, we could see a step up in margins, much like we saw in 2023.
Target Price: $850; Rating: Three
Checkpoint: $530
RISKS: Ability to add and retain users and user engagement; marketing spend; new products or changes to existing ones; competitive risk, geopolitical risk.
Netflix Inc. NFLX $71.71; 2,505 shares; 2.93%; Sector: Communication Services
UPDATE: Shares of Netflix ($NFLX) were little changed in July. Following the company’s Q2 2026 results, we downgraded the shares to a Three rating and reduced our price target to $85 from $115 in mid-July. While the company reported an EPS beat for the quarter, revenue for the period came in a tad shy of market expectations while its outlook for the current quarter came up short relative to consensus forecasts. There were two reasons we downgraded the shares rather than close out the position. First, NFLX shares were battered during May and June, which made them cheap. Second, and more importantly, Netflix shared that it still expects to roughly double its ad revenue year over year to $3 billion. Management added, however, that it is in “advanced stages” of discussions with advertisers in the U.S. as part of its Upfront negotiations, with the expectation that commitments will close in the coming weeks. To the extent that Netflix ups its advertising revenue forecast for this year or paints a picture for that revenue becoming an even larger piece of the pie next year, it would be a potential catalyst to kickstart a rebound in the shares. However, we won’t bury our head in the sand and only focus on the positives and opportunities. The fact that Netflix only posted arguably in-line Q2 2026 results was a bit of a disappointment following the price target increase in the U.S. in late March. Guidance for the current quarter outlined didn’t given that it was a tad short of what the market was looking for despite the expected improvement in the company’s operating margin to more than 33% compared to 28.2% in the year-ago quarter. As we reflect on that margin, it serves as a reminder that while Netflix’s $0.82 EPS forecast for the current quarter is $0.02 shy of what the market was looking for, on a year-over-year basis, it’s up about 39%. During Q2 2026, the company made its largest repurchase to date at $4.7 billion. That leaves some $27 billion remaining under the current authorization. With NFLX shares trading at their lowest level since H2 2024, our thinking is the buyback activity in the current quarter is likely to be as big if not bigger. When we hear from Netflix about its advertising upfronts, we’ll look to revisit our rating on NFLX shares and their role in the Portfolio.
July Price Change: 0.4%; Yield: 0.00%
INVESTMENT THESIS: Netflix is one of the world’s leading entertainment services offering TV series, films, games and live programming across a wide variety of genres and languages. With over 325 million paid memberships, Netflix serves a global audience approaching one billion people. In the second half of 2025, Netflix members watched 96 billion hours on Netflix, up 2% (+1.5 billion hours) year over year vs. a 1% increase in the first half of the year. We attribute that to the company’s growing slate of proprietary content, live events, including sports, and a growing market for games. The company’s revenue is ~45% from the U.S., 31% EMEA, 12% Latin America, and 11% Asia-Pacific. We see Netflix and its growing content slate well positioned to benefit from the ongoing shift to streaming from broadcast and box office content, with margins poised to benefit from a combination of pricing actions and growing exposure to the higher margin advertising revenue.
Target Price: $85, Rating: Three
Checkpoint: $70
RISKS: Consumer spending and economic risk, content development and content licensing risks and competitive risks.
Not Rated
EPS All-Stars Model; 4.89%; Sector: N/M
UPDATE: On July 1, we reconstituted the strategy’s basket for Q3 2026, and in keeping with the higher starting position size at the start of Q3 2026, we upsized the Portfolio’s positions in Ciena ($CIEN), Eldorado Gold ($EGO), Lumentum Holdings ($LITE) and Rocket Companies ($RKT). We also started new positions in SiTime Corp. ($SITM) and Seagate Technology ($STX). The new basket faced a difficult July amid investor concerns for the AI and data-center buildout, but the net increase in hyperscaler and other AI and data-center capex levels remain a strong tailwind for multiple holdings in the basket. We understand the frustration following the strategy’s strong performance in Q2 2026, but we still have two months to go in the current quarter. Given the nature of the model, the only time we may adjust its composition during the quarter is if a company is acquired. Otherwise, the model is set until the next reconstitution. As such, there are no price targets or ratings for each of the positions that make up the basket. That same selection process will be repeated quarterly, which means housekeeping for the model should be minimal. It also means you can expect minimal activity to occur at quarter-end and the start of the new quarter. The next reconstitution cycle for the EPS All-Stars model will be September 30 and October 1. At that time, we may consider further increasing the Portfolio’s exposure to the basket.
July Price Change: -18.2%
INVESTMENT THESIS: EPS All-Stars is a basket of large-cap companies that offer the fastest rate of EPS growth over a multi-year period. That basket is screened regardless of industry sector or sub-sector, which means the down-selected list of companies can span a wide array of sectors. The focus is on earnings growth because earnings growth is often seen as a signal of a company’s competitive strength, operational efficiencies, and future growth potential. Shares of companies that provide historically consistent earnings growth faster than the stock market receive premium valuations compared to those awarded to the S&P 500. And as we’ve often discussed with you, multiple expansion paired with earnings growth tends to drive outperformance relative to the market, better known as alpha. The basket of eight stocks is reconstituted on a quarterly basis to reflect updated EPS expectations for the current year and the following one.
Target Price: N/M
Checkpoint: N/M
RISKS: Macro and end-market risk, individual company risk, and consensus EPS expectations.
