Tech Leads In A Narrow Market


Quick Summary
- U.S. equities started mixed Friday morning with a continued rebound in Tech names lifting the Nasdaq to modest gains while other areas lagged as bond yields rebounded.
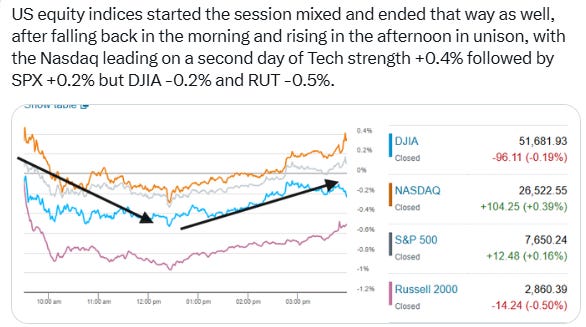
- After Thursday’s one-day breather, the Treasury rout resumed, sending the 10-year yield back to 5%, its 9th gain in 10 sessions, but the bigger move was down the curve as the 2-year yield rose five basis points to 4.74%, its highest close since July 2024. That had the indices at their lows at midday. They spent the afternoon looking to reclaim their opening highs. The Nasdaq led again +0.4% on another day of Tech strength (Tech was +0.8%), while the S&P 500 edged up +0.2%, but the DJIA slipped -0.2% and the small-cap Russell 2000 lagged at -0.5%.
- Semis did the heavy lifting with the Philadelphia Semiconductor ($SOX) Index rising 2.8%. But breadth remained weak with just one other sector (Industrials) up over +0.1%.
- Adding to the downbeat tone for the broader market, August industrial production came in unchanged on the month (versus +0.3% expected) as factory output unexpectedly fell for the first time this year as auto and business-equipment production cooled.
- Elsewhere oil eased, Bitcoin topped $80,000, and the yen pared its slide on a report the BoJ conducted a rate check, often read as a precursor to intervention, which weakened the dollar.
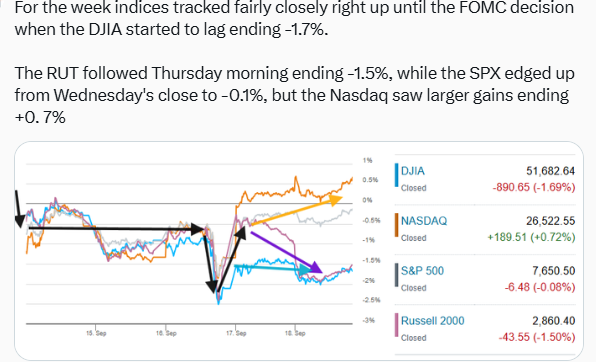
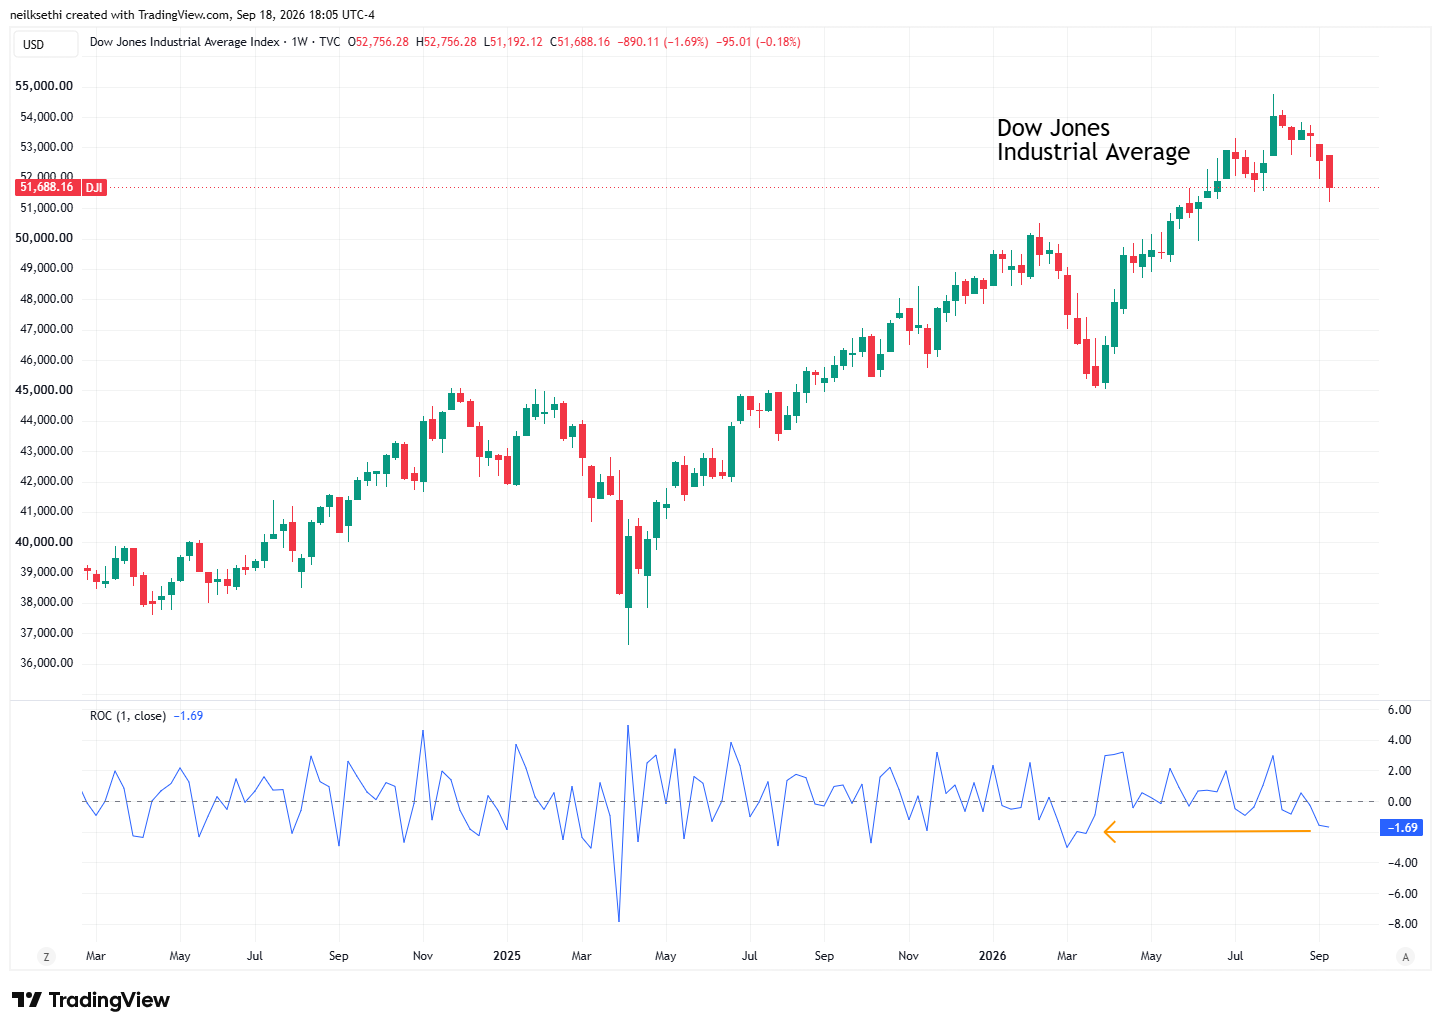
- For the week it was a similar story: the Nasdaq was the only major index in the green (+0.7%) and the S&P finished roughly flat, while the Dow booked its third straight losing week (-1.7%, the worst since March) and fifth in six weeks, and the Russell 2000 its fourth in five weeks -1.5%.
Market Commentary
Equities:
- “Since the fundamental picture is not getting better for neither the bond market nor the oil market, we could still see a significant jump in volatility soon,” said Matt Maley at Miller Tabak.
- “For now at least, equity futures seem happy to shrug off the rise in both yields and the dollar, perhaps because crude prices have edged lower thus far. It’s far from guaranteed that stock operators will keep whistling a happy tune by the close if yields keep pushing higher.”— Cameron Crise, macro strategist.
- “At some point, all cycles end,” Brian Levitt, chief global market strategist at Invesco, told CNBC’s “Closing Bell.” “This one, I don’t think it’s going to end with the higher Fed funds rate necessarily anytime soon, or higher oil prices. It’s going to end when something breaks in the AI trade, when, again, a hyperscaler pulls back on investment, or the market deems the amount of investment to be overdone compared to expected return on invested capital. But that’s not the current environment that we’re in.”
- In his monthly investment note, sent to clients on Thursday, Mark Haefele, chief investment officer at UBS Global Wealth Management, said his team expects the equity rally to continue over the next six to 12 months. “Of course, rate hikes will not produce more oil or chips, and rising government debt will complicate the outlook,” he said. “But we have learned over the years that investors should not automatically assume that geopolitical shocks will cause lasting market weakness or that debt challenges will affect every asset negatively. With earnings growth still strong and lower inference costs stimulating AI adoption, we believe the fundamental supports for the rally remain intact.”
Bonds:
- “Fed hikes should slow the run-up in 10-year Treasury yields by reinforcing the Fed’s determination to get inflation back down to target and by pumping the brakes on the economy,” said Don Ellenberger, head of multisector strategies at Federated Hermès.
- “The constructive tone for duration is a welcome development for those of us in the market who have been medium-term bullish even as the recent selloff implied that a regime-shift could be unfolding,” BMO’s Ian Lyngen and Vail Hartman said.
Stock and Sector Breakdown:
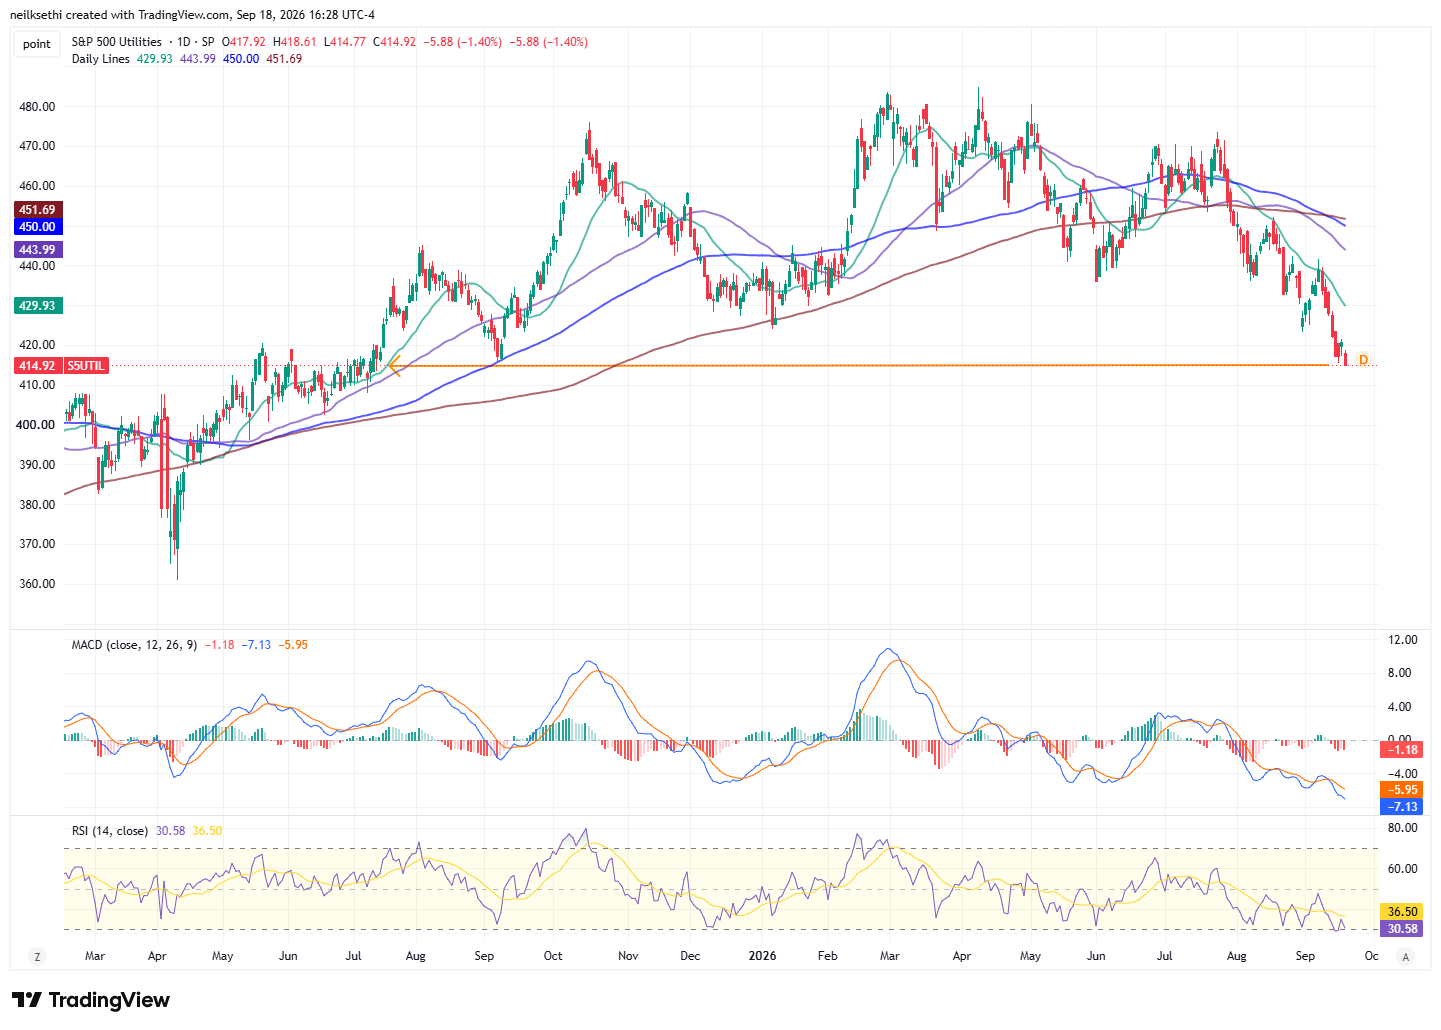
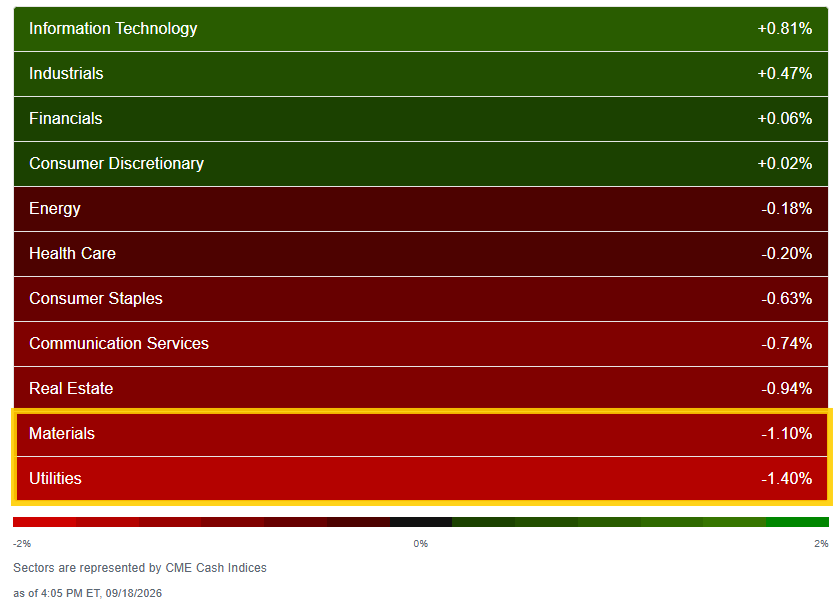
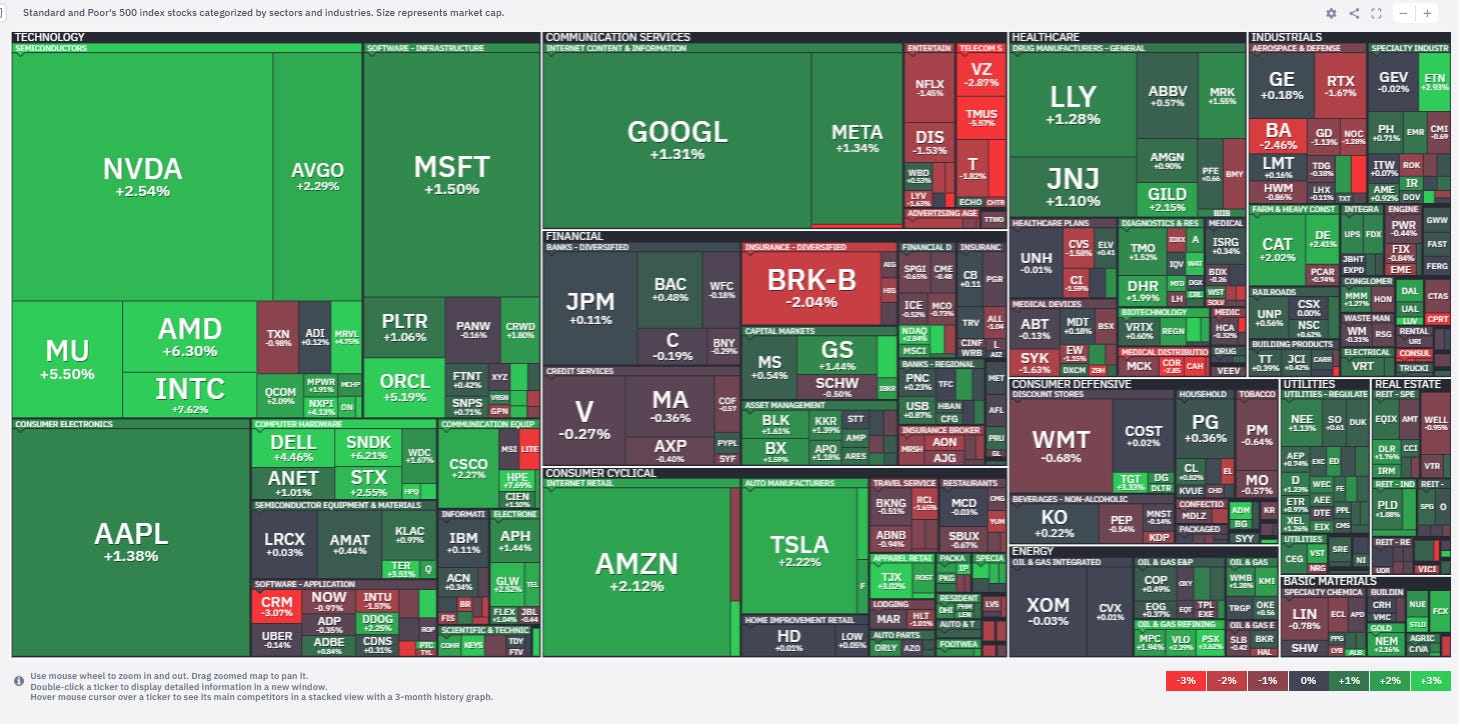
As you might expect sector breadth eased back, but with Tech doing the heavy lifting for a second session (+0.8%), just three other sectors were higher (Industrials, Financials, and Consumer Discretionary) and just one of those (Industrials +0.5%) was up more than 0.1%. Utilities continued their recent losses ending at the bottom of the leaderboard, now the least since July 2025 (chart). Materials was the other sector down over 1%.
Semiconductor stocks provided leadership again Friday. The PHLX Semiconductor Index ($SOX) finished +2.8%. Memory and storage names were particularly strong, with Sandisk ($SNDK)+11.0%, the second best performing stock in the S&P 500 and Seagate Tech ($STX) +6.9%. Optical equipment maker Coherent ($COHR) +7.2% was another standout after announcing an expansion of its Pluggable Optical Line System portfolio targeting high-capacity interconnect requirements for cloud and AI infrastructure. Qualcomm ($QCOM) -5.8% though didn’t participate, the second worst performing stock in the S&P.
The financials sector (+0.1%) received some support from continued strength in Coinbase Global ($COIN) +11.7%, the best performing stock in the S&P, and Robinhood ($HOOD) following yesterday’s announcement of the SEC’s “Innovation Exemption” allowing crypto exchanges to offer tokenized equities and a surge in Bitcoin past the $81,000 mark.
The materials sector (-1.1%) was though a laggard as Nucor ($NUE) -6.3%, the worst performing stock in the S&P, and Steel Dynamics ($STLD) -4.1% were under pressure following disappointing third-quarter earnings guidance.
The communication services sector (-0.7%) also finished lower weighed down by Netflix ($NFLX) -4.7% after a rare downgrade to Underweight from Equal Weight from Wells Fargo.
In other news, the Department of Justice is considering joining a lawsuit led by Texas and 12 other Republican states attorneys general against BlackRock ($BLK) and State Street ($STT), according to a Bloomberg report.
In deal news, Westinghouse Electric Co., a provider of reactor technology to nuclear power plants, is seeking a valuation of more than $50 billion in its US initial public offering, according to people familiar with the matter.
[Note: chart uses futures prices.]
The number of large SPX winners (up over 3%) fell to ~20 from ~35 Thursday, while the number of large losers (down over 3%) rose to ~30 from just 10 Thursday, but down from ~55 Wednesday.
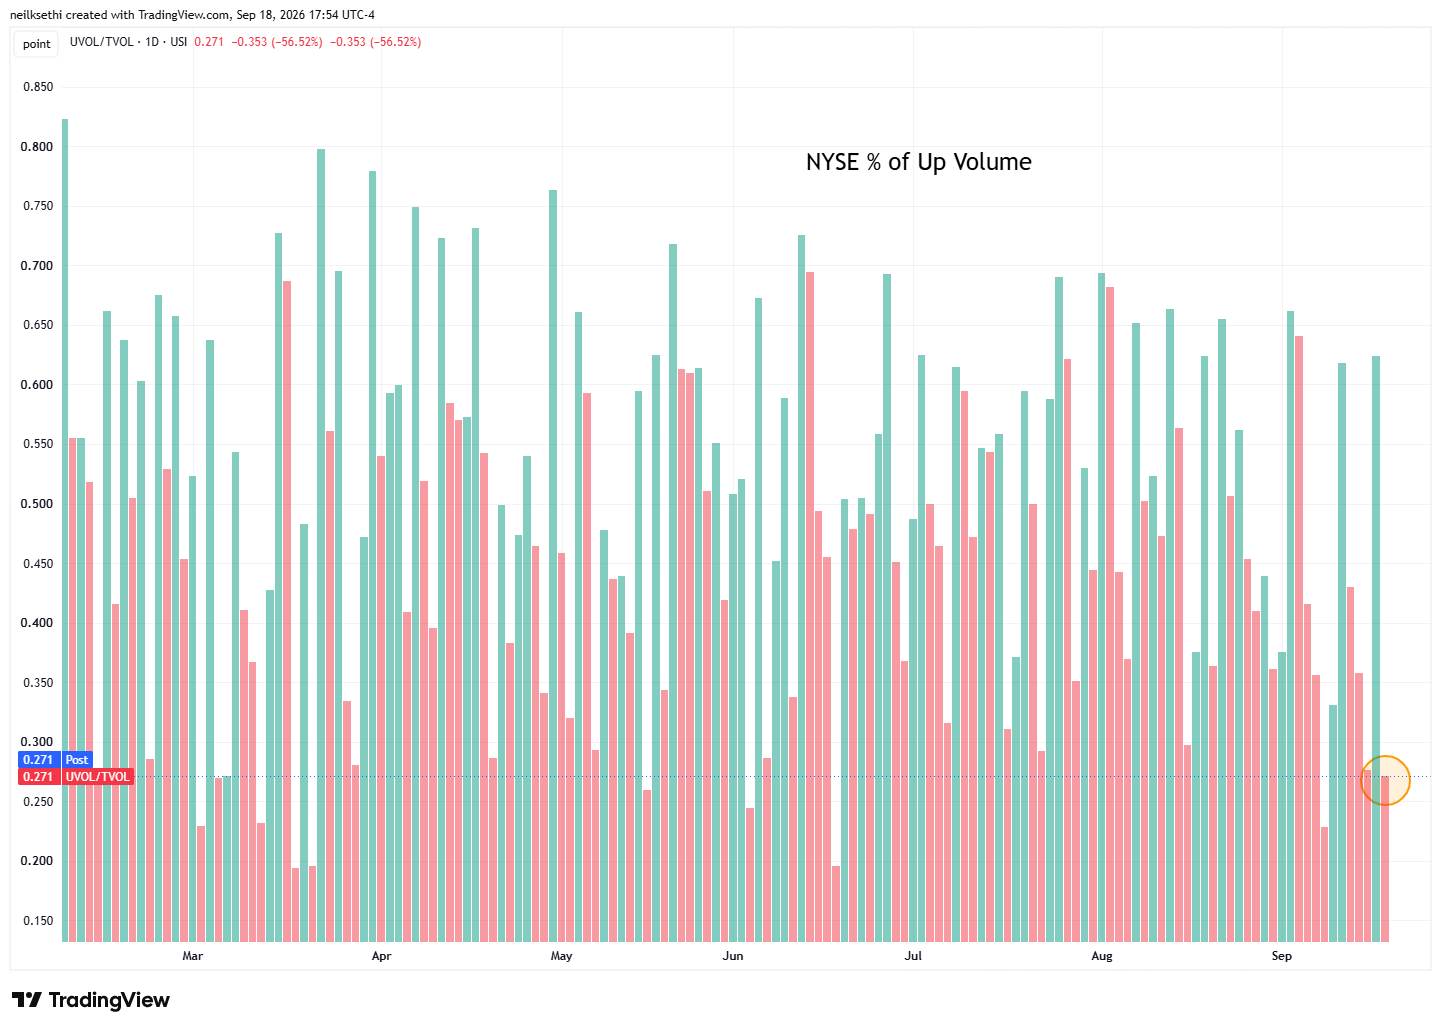
Positive volume (intensity of buying in stocks up on the day) once again very weak on the NYSE at just 27.1% on a loss of -0.38%. That’s the least since September 9th when the loss was -0.66% and is just below what we saw Wednesday when the loss was -0.80%.
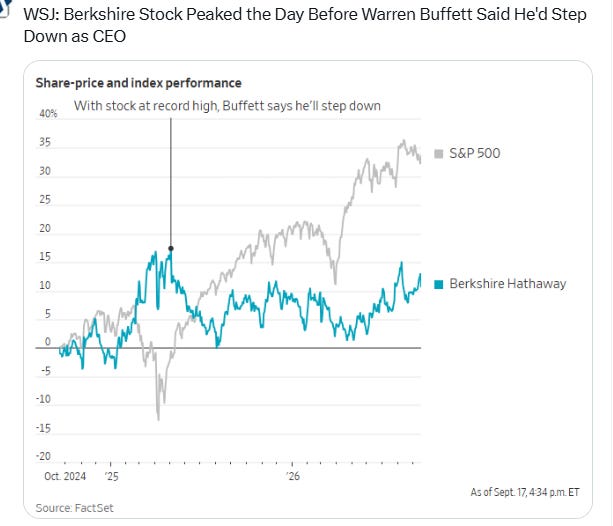
Some stock-specific commentary from TheStreet Pro today:
- Doug Kass – Doug Kass: Here’s What I Asked Warren Buffett About This Very Moment
- Stephen Guilfoyle –
- Chris Versace –
- Ed Ponsi – We’re Buying This Blue Chip Investment Bank on a Pullback
- Bret Jensen – 2 Names I’m Adding to as Expirations Create Dry Powder
A Look At The Charts
Note on all charts the colored lines are moving averages (the average price over the lookback period — days on the daily charts, weeks on the weekly charts):
20 = green
50 = purple
100 = blue
200 = brownException is monthly charts where blue is 10-month moving average and brown is 20-month moving average.
MACD = Moving average convergence/divergence line, a measure of momentum that compares longer term and shorter term momentum to gauge if a move is strengthening or weakening. This is probably my favorite individual indicator (it’s also the favorite of Katie Stockton, a very fine technician).
RSI = Relative Strength Index (basically what it sounds like) = measures the strength of the move comparing gains to losses over the given lookback window (I use the standard 14 periods).
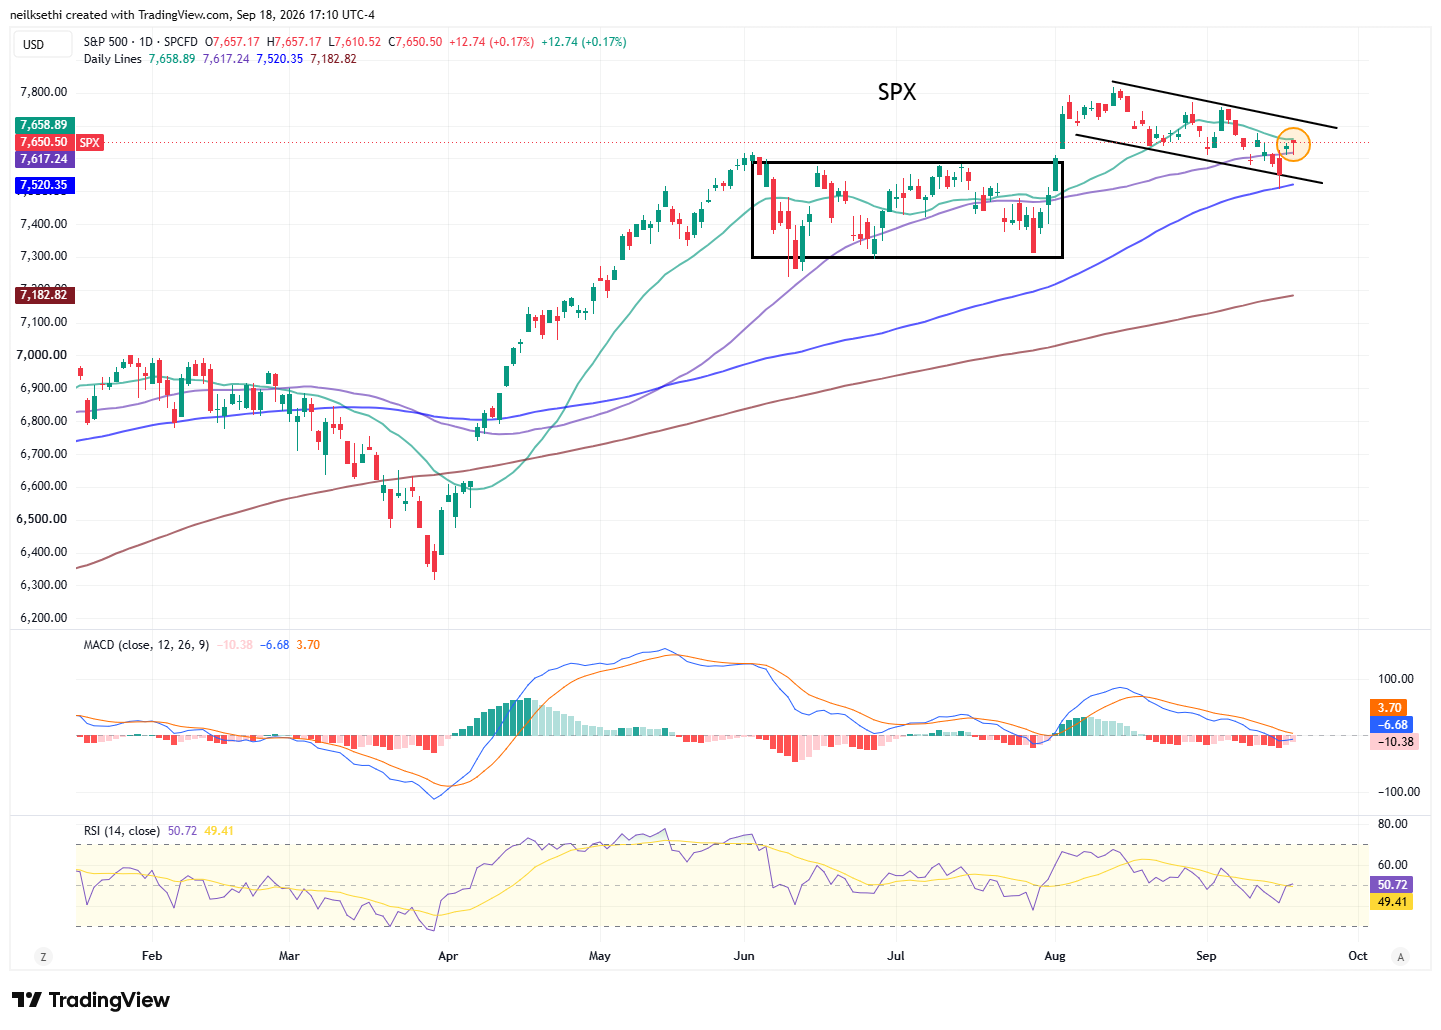
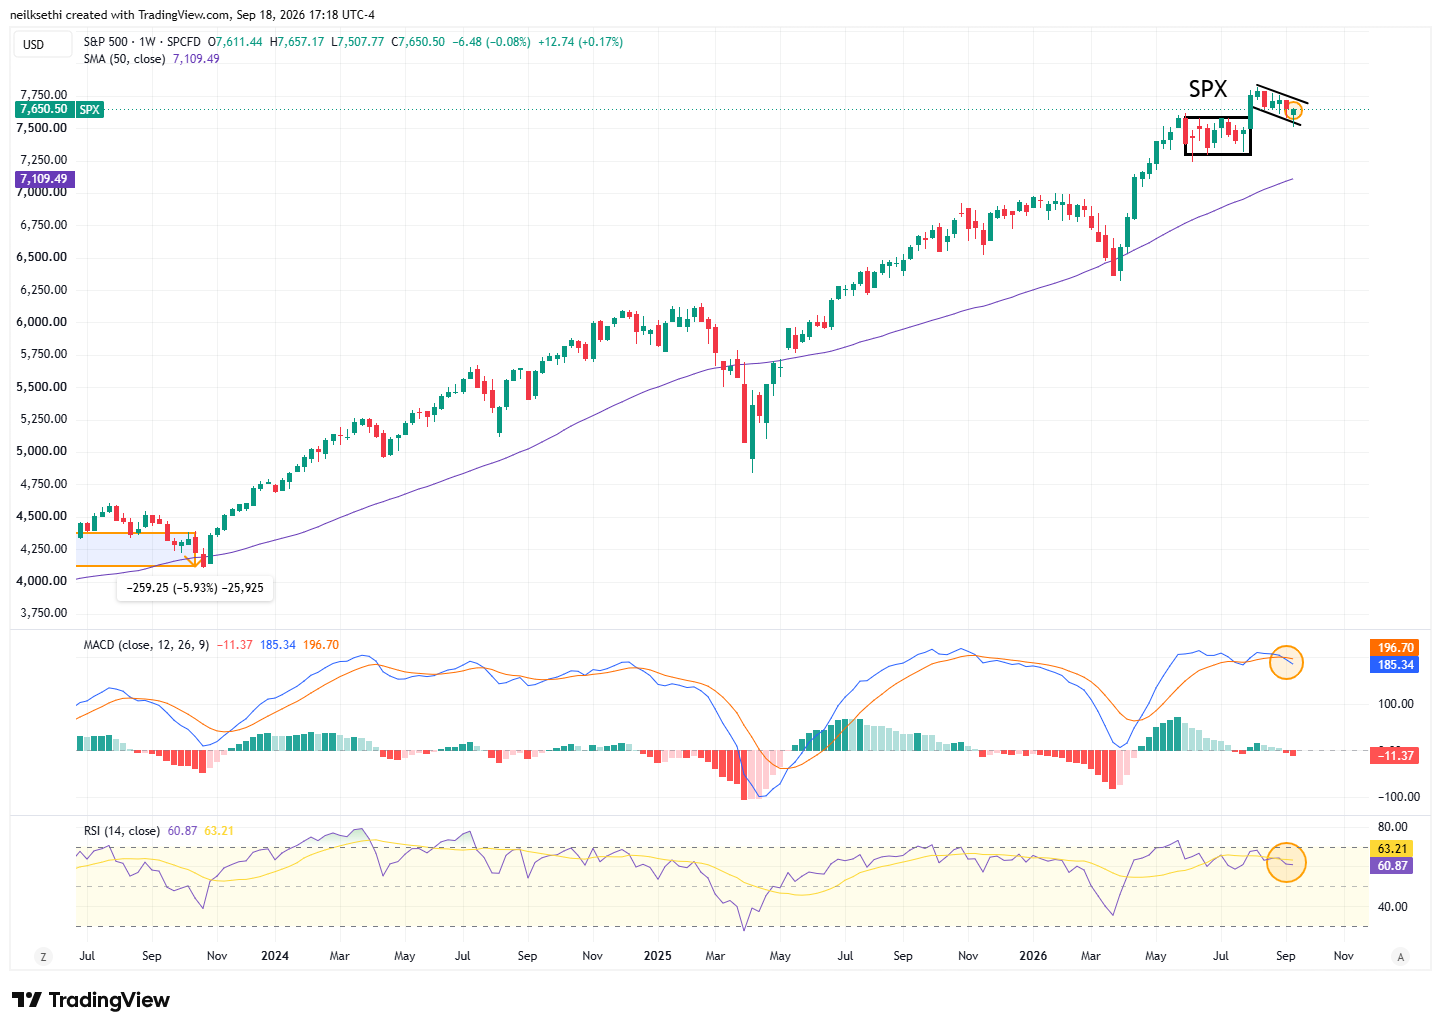
SPX fell back to the 50-DMA where it found support remaining in the middle of its channel. The daily MACD remains in “sell longs” positioning, but the RSI is at 50. Holding for now. Would add on a break above the channel, sell on a break of the 100-DMA.
Weekly chart technicals deteriorating a bit with the weekly MACD crossing over to “sell longs” positioning while the RSI has slipped to the lowest since July, although remains at 60.
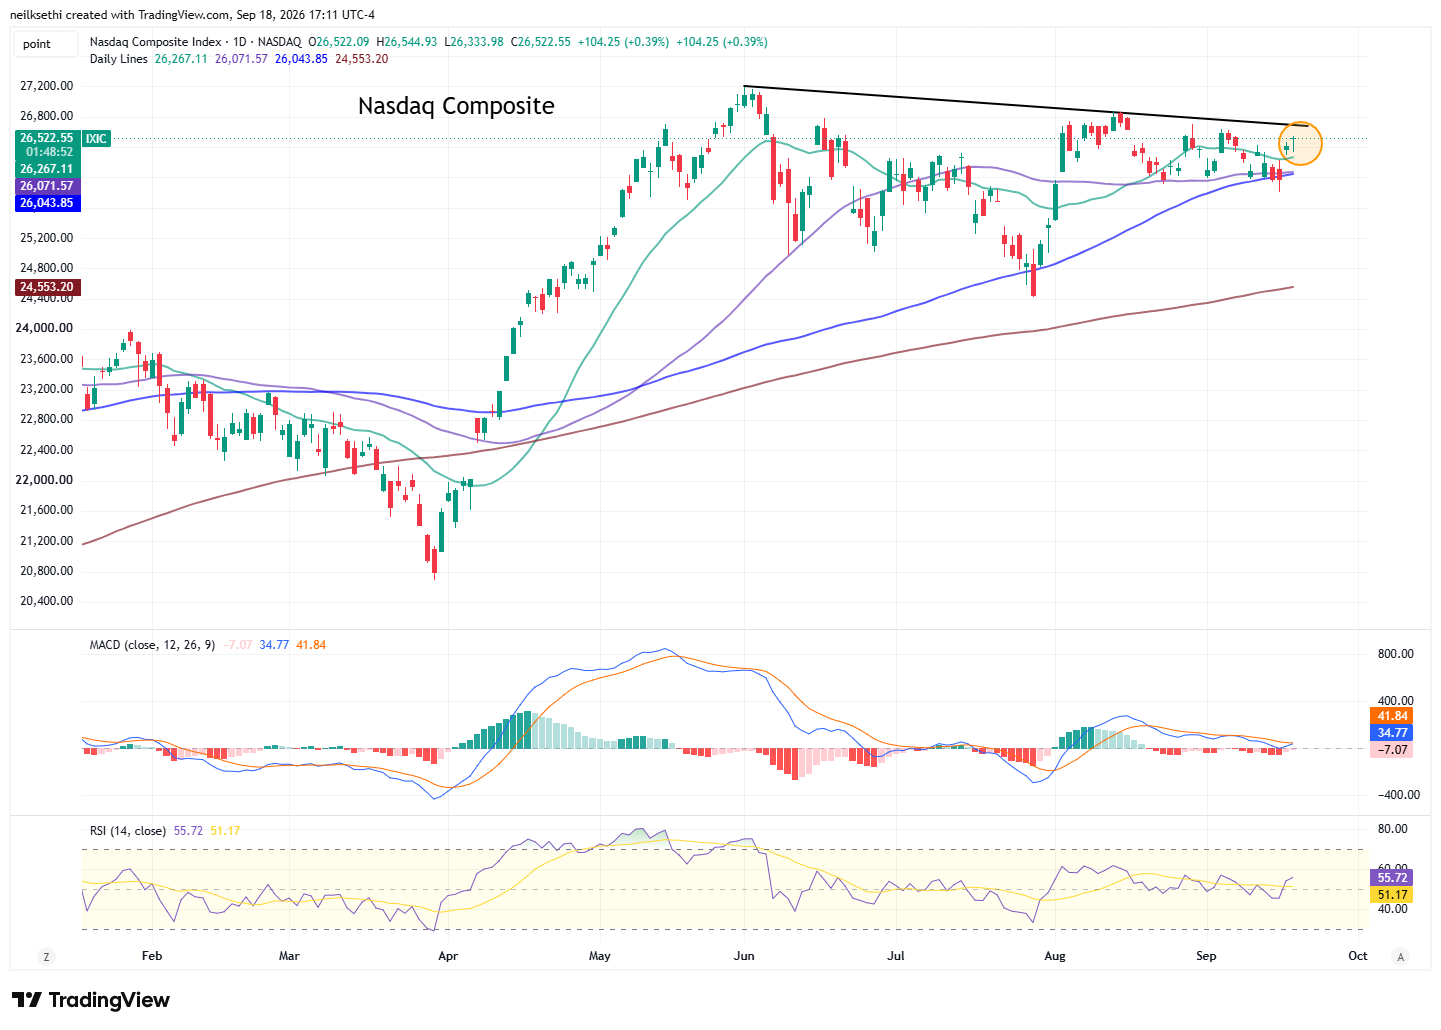
Nasdaq Composite I said Wednesday “I’m a little less positive on but it seems to be hanging in there.” Continuing to firm up. A break of the downtrend line would be notable.
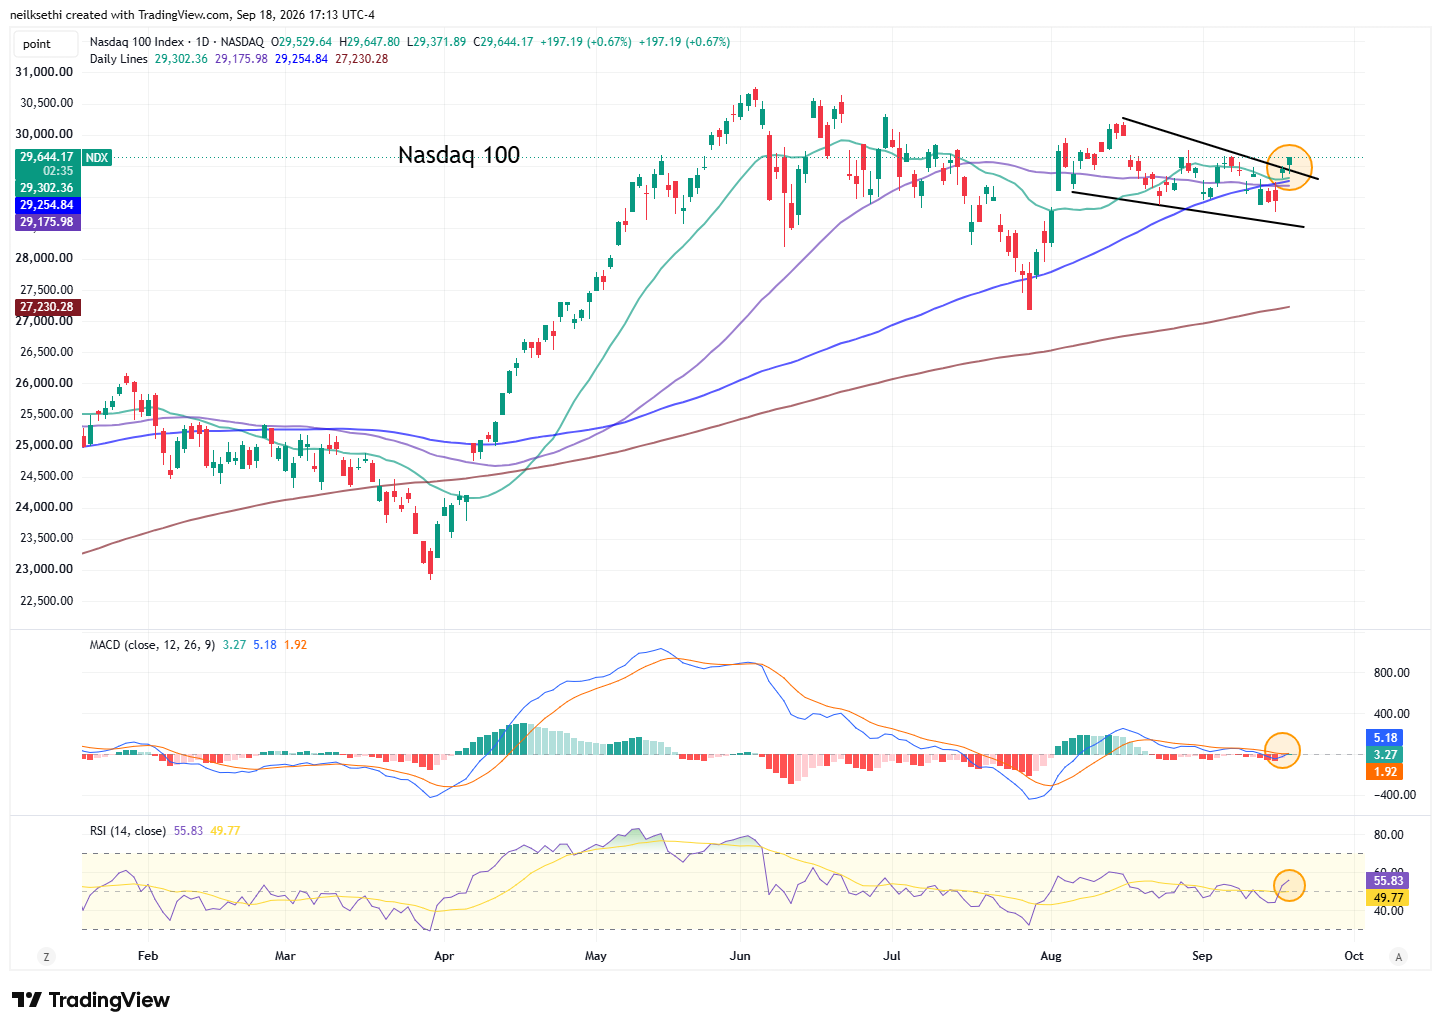
In terms of the Nasdaq-100 ($QQQ) I said Thursday I “might add again on a break above 29,700.” It got close, and I would add if that happens Monday. Daily MACD has flipped more positive, and the RSI is over 50 and the strongest in a month.
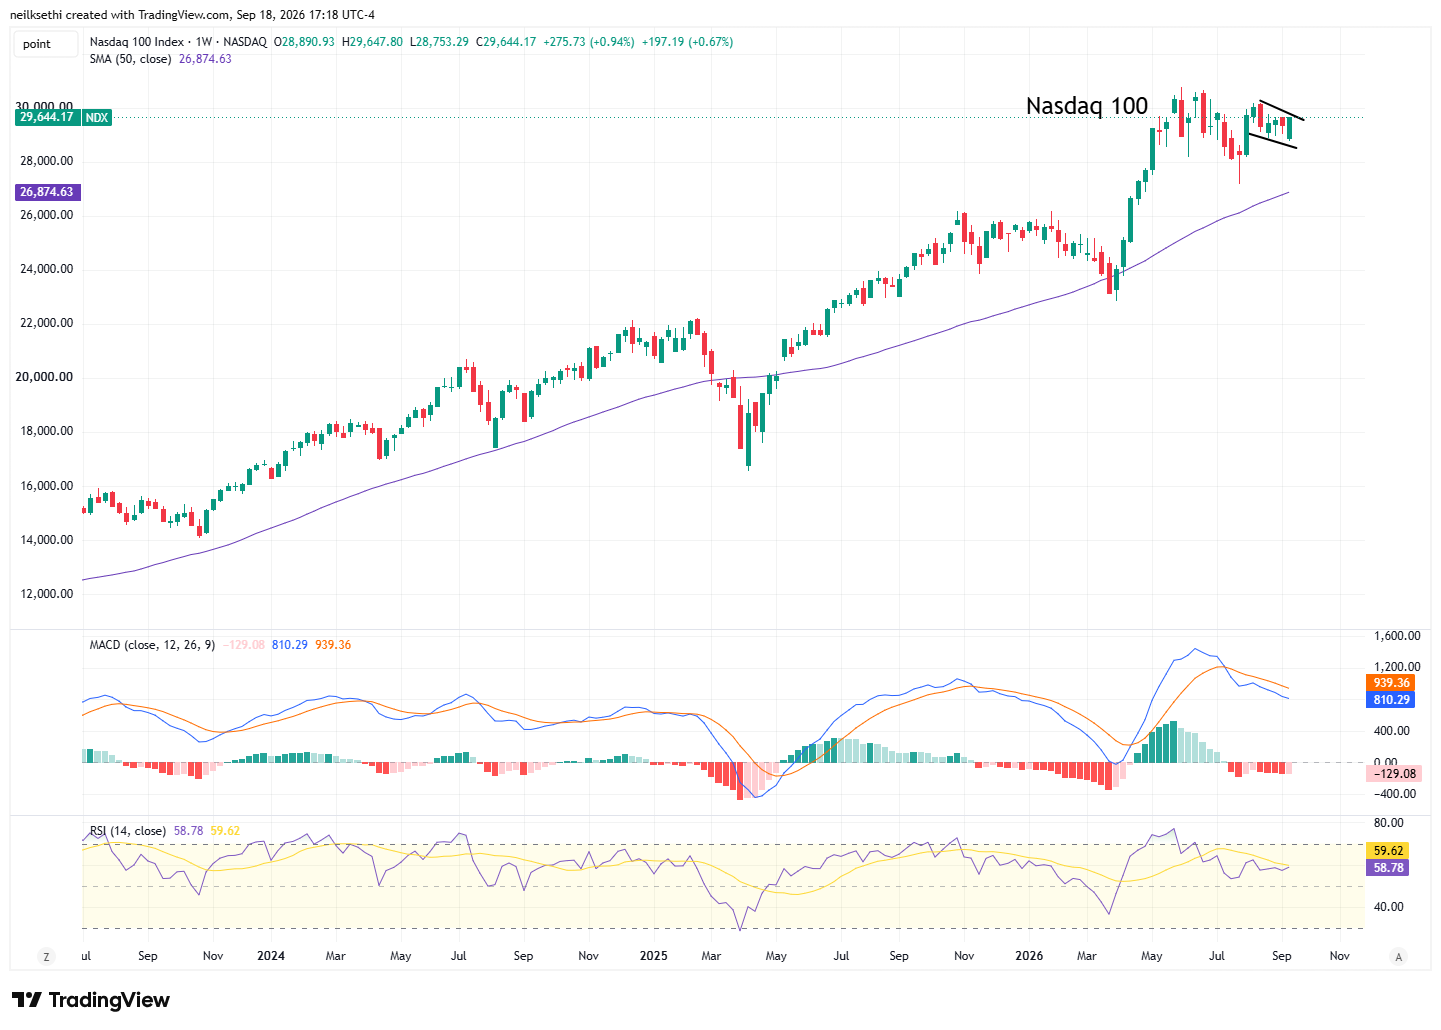
Weekly chart is less positive with a negative weekly MACD crossover but RSI remains near 60.
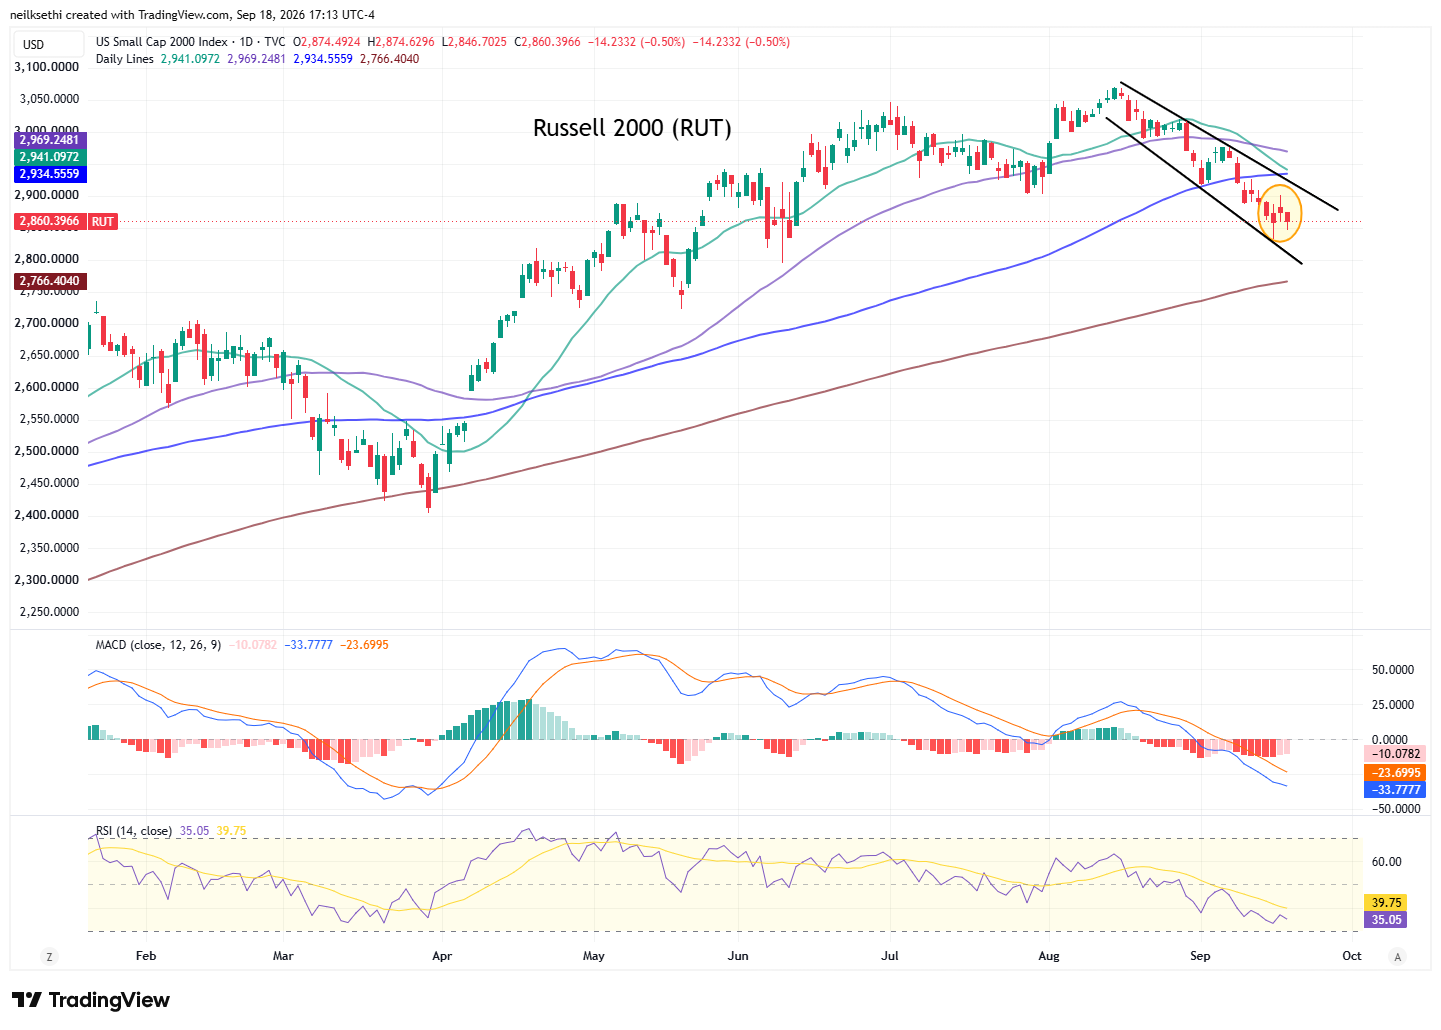
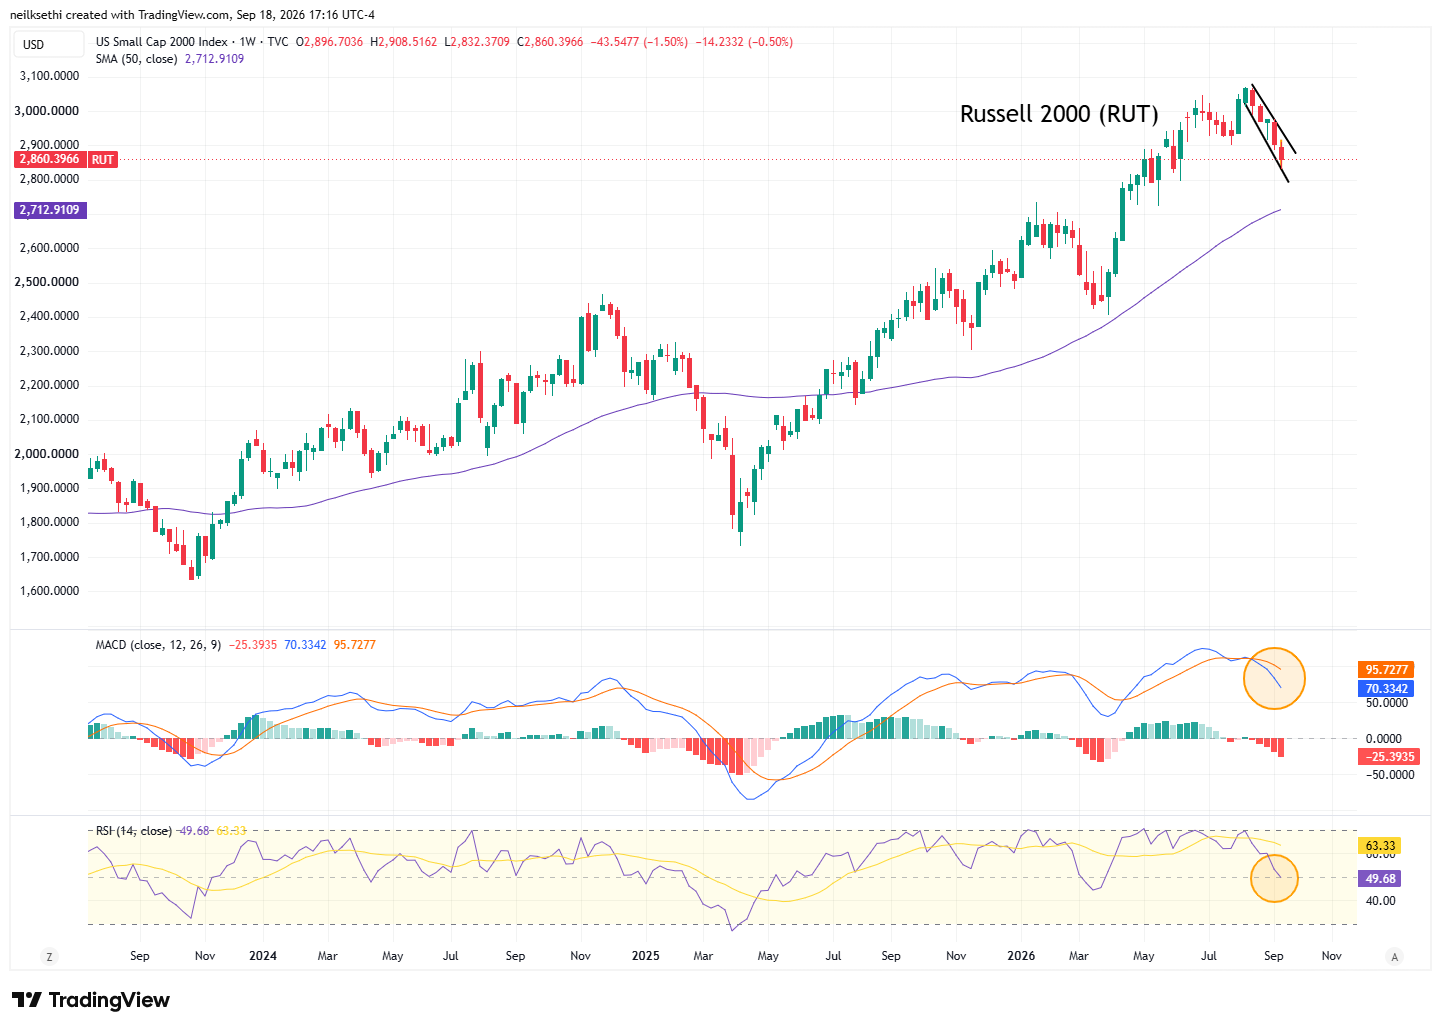
The Russell 2000 (RUT) I said last Wednesday was “much more problematic,” and that remains the case although it at least has not broken Wednesday’s low. As mentioned early last week its MACD is now in “go short” positioning, and its RSI is below 40. As I said then “I am not long this index, but … I’d be out until it at least recovered the 100-DMA.” I noted this week “200-DMA is a fair bit away, but that might provide an interesting risk/reward as it served as a floor in March.”
Weekly chart not much better. Weekly MACD in sell longs positioning and RSI is dipping under 50. Will it make it to that support line and 50-week moving average?
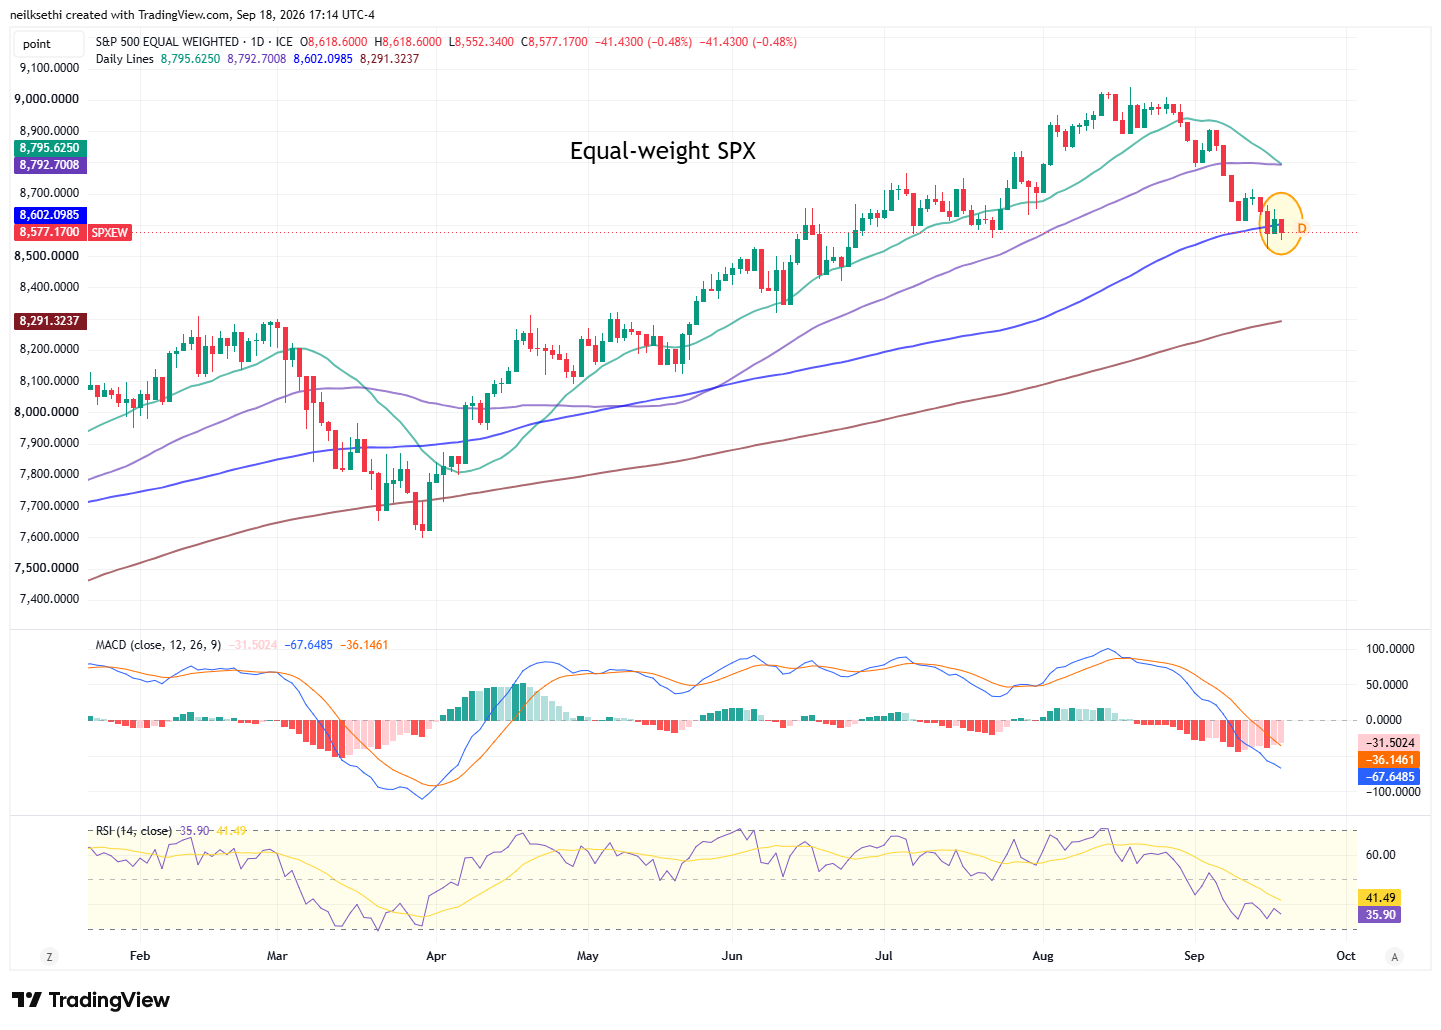
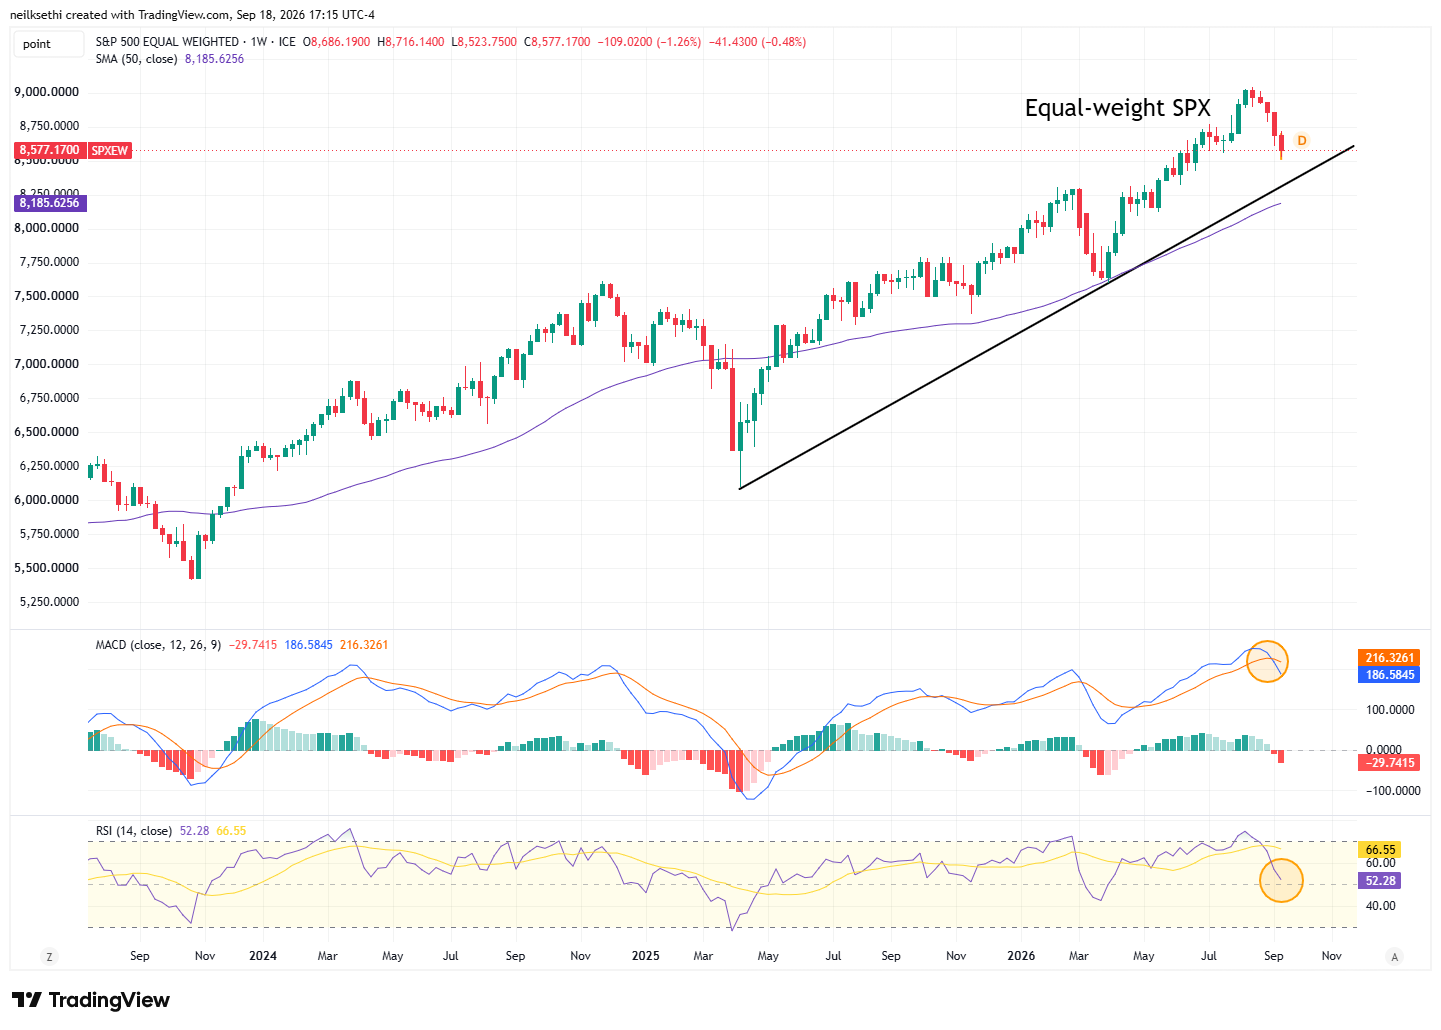
The equal-weighted SPX I said Wednesday is “back to concerning.” I mentioned early last week “I did take off most of my holdings in ($RSP) for now. I’ll be looking for a tradeable bottom to form.” Like the RUT it has held Wednesday’s low, but daily MACD and RSI are weak.
Weekly chart is similarly problematic.
Treasury yields rose across the curve in a bear flattening (shorter yields rising more than longer):
The 2-year Treasury up eight basis points on the day (and twelve on the week) to 4.75% in the after hours session, the highest close since July 2024.
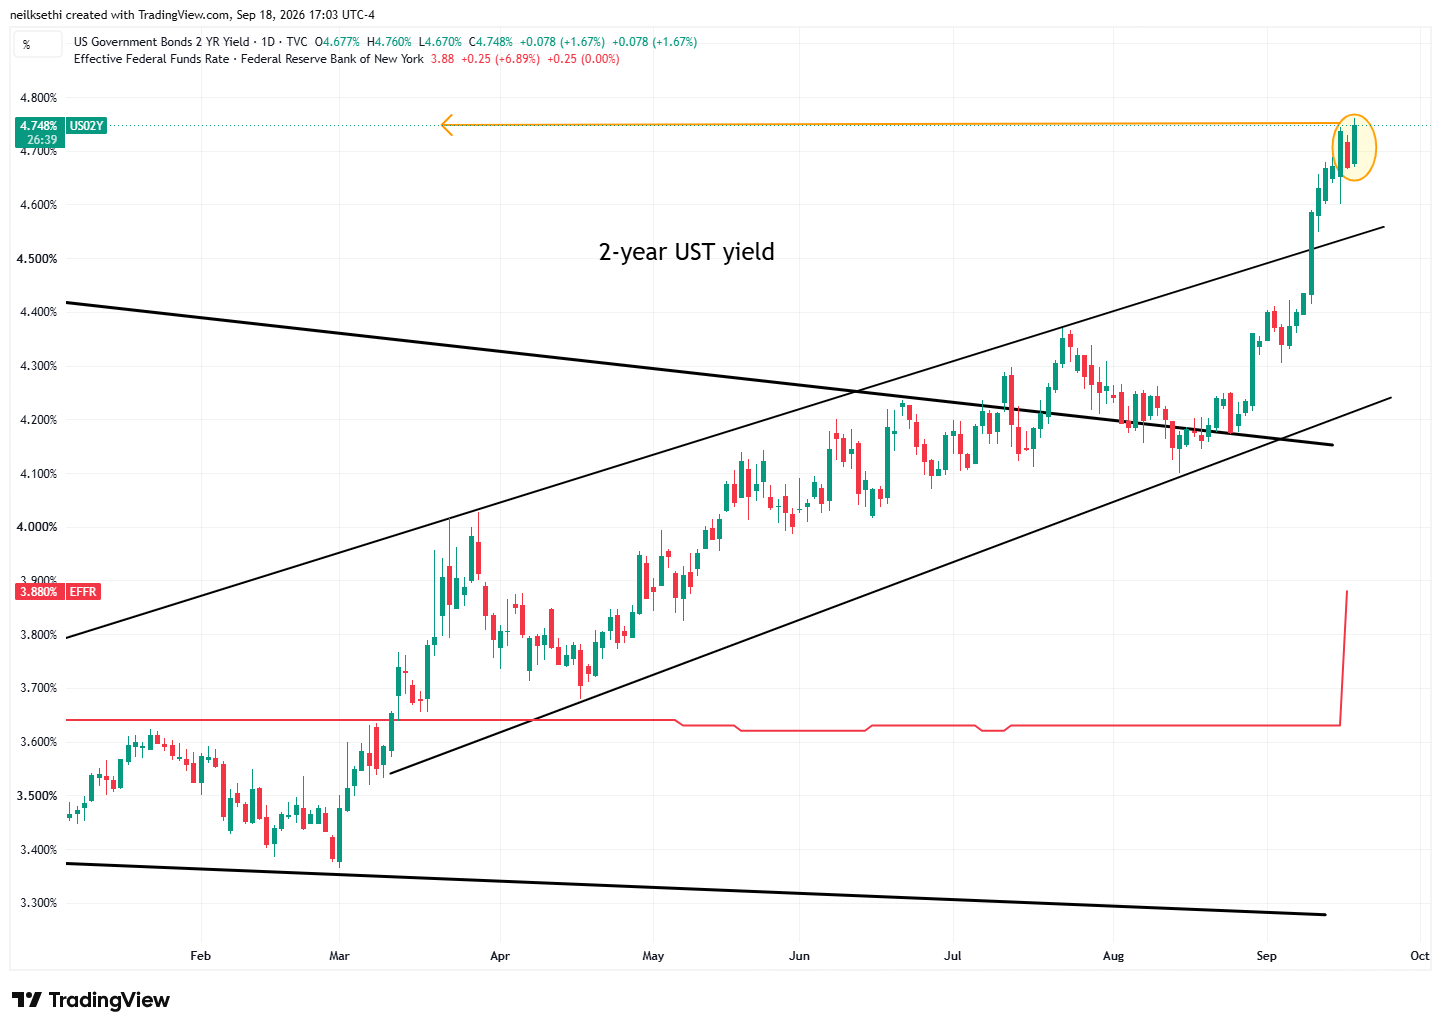
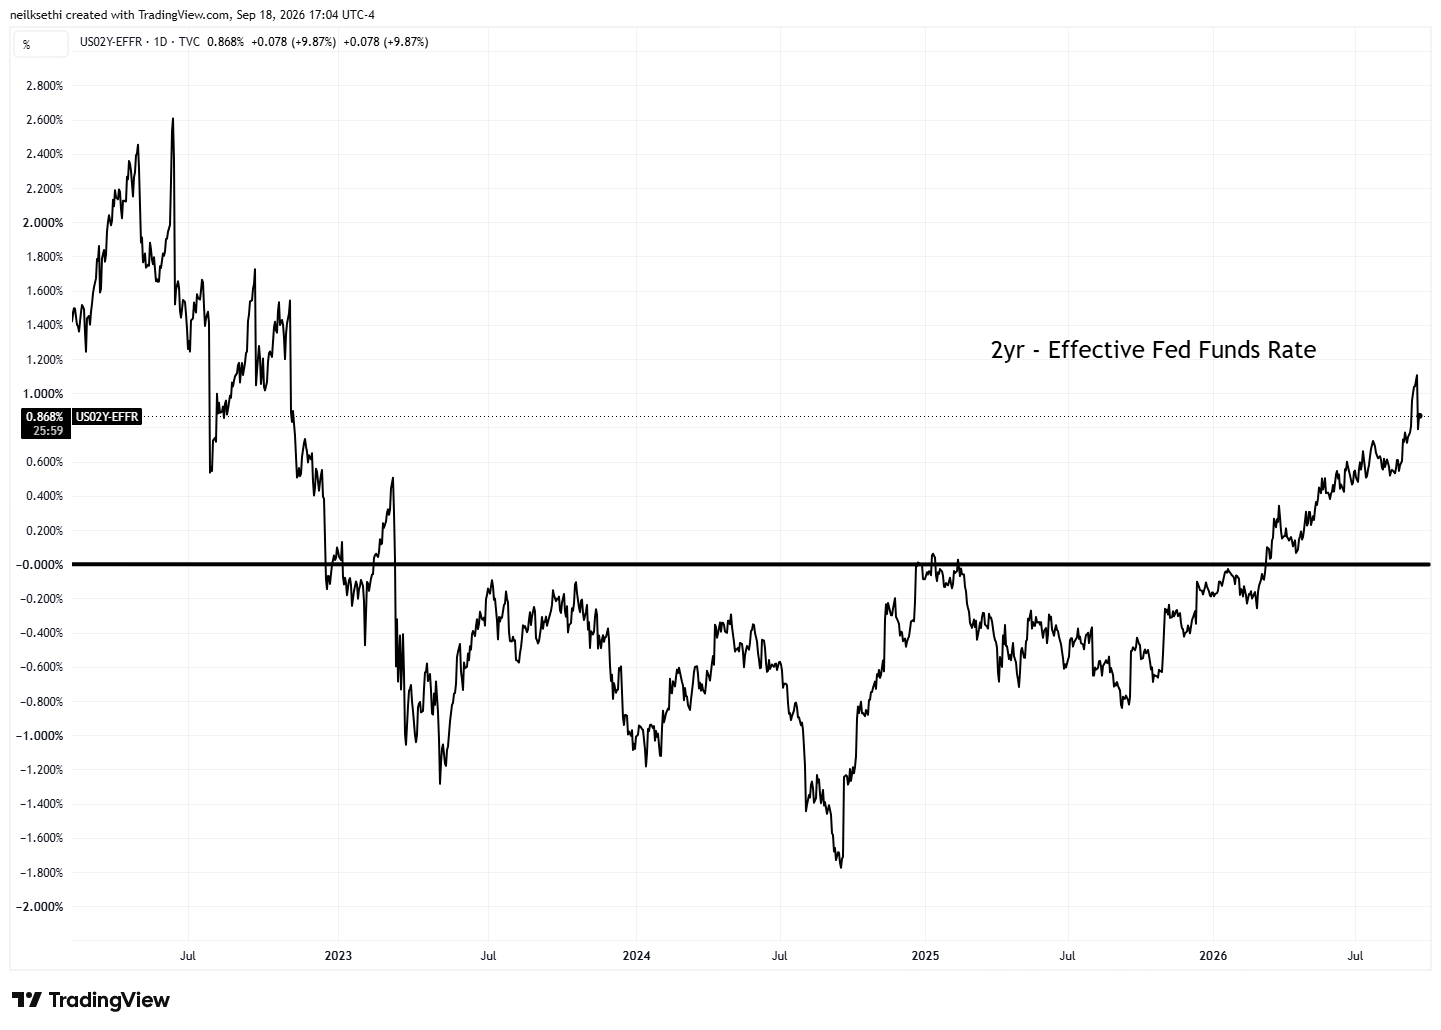
It is now ~96 basis points above the Effective Fed Funds rate (red line), so back to screaming for more rate hikes.
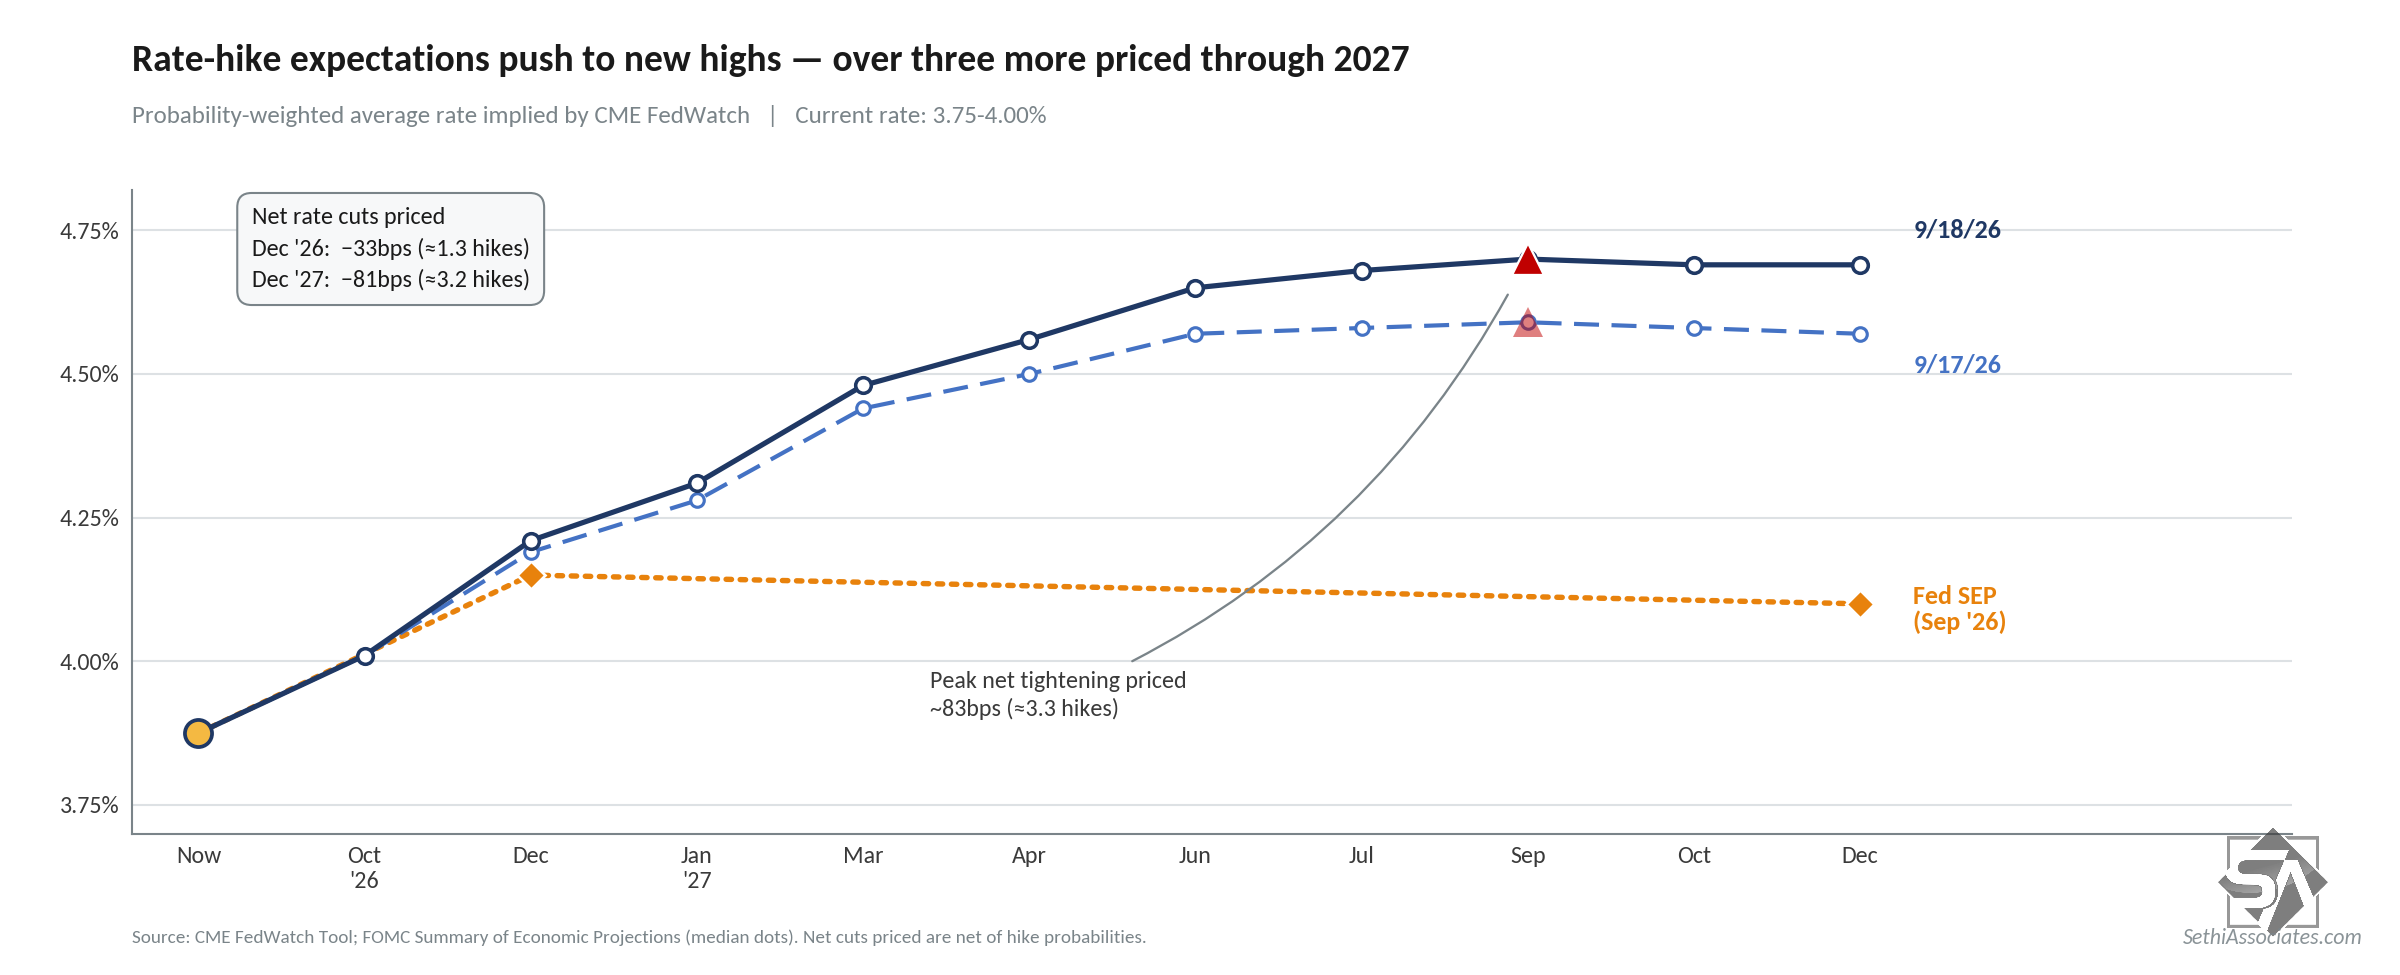
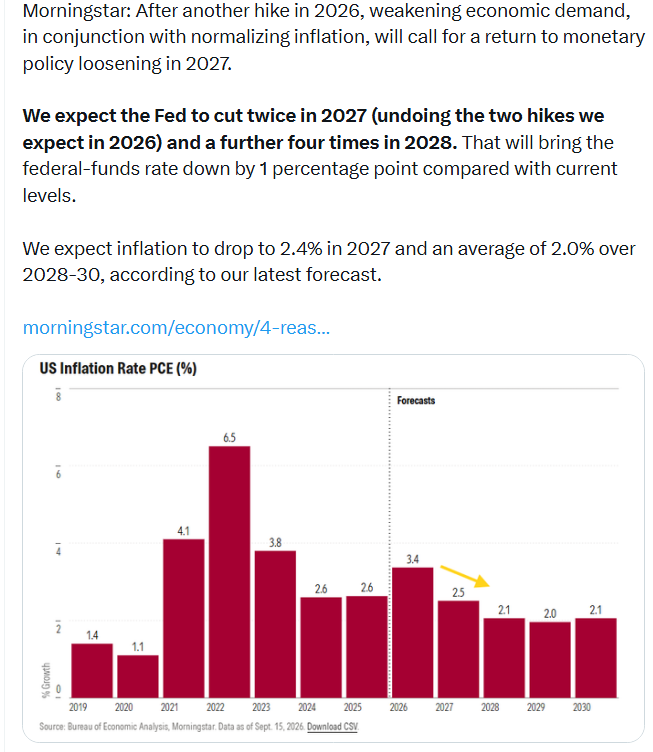
In line with that FOMC rate hike expectations from CME’s Fedwatch tool pressed to new highs. Chance of an October hike now 55%, chance of a hike by December 90% (chance of both 43%). Total hikes through 2027 now at 81 basis points (so over three hikes priced from here).
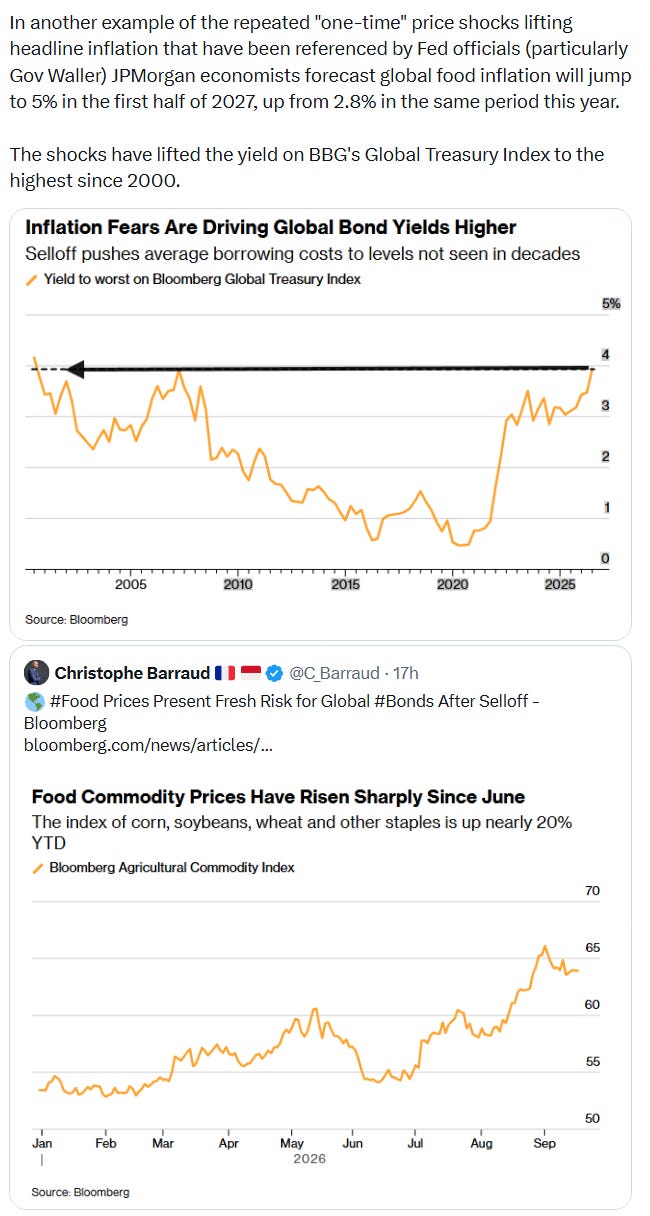
10-year yields got back Thursday’s decline, ending up six basis points and ending the after hours session right at 5.00%, just below the highest close since 2007 Wednesday.
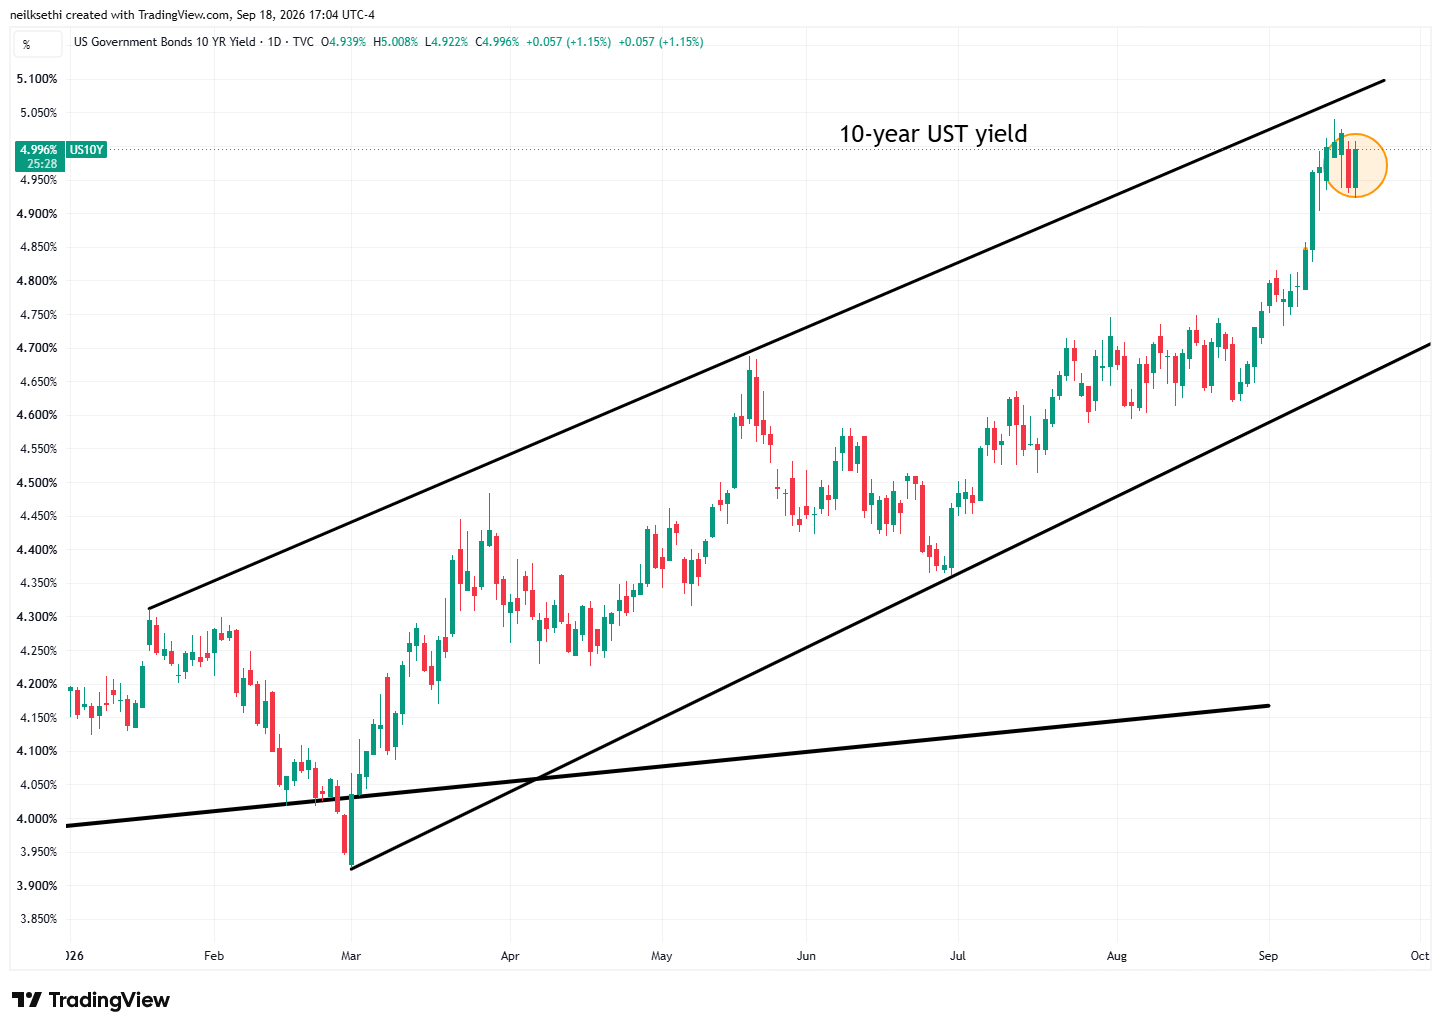
30-year yields didn’t get back quite all of Thursday’s decline ending at 5.33%, four basis points from Tuesday’s close (the highest since 2007).
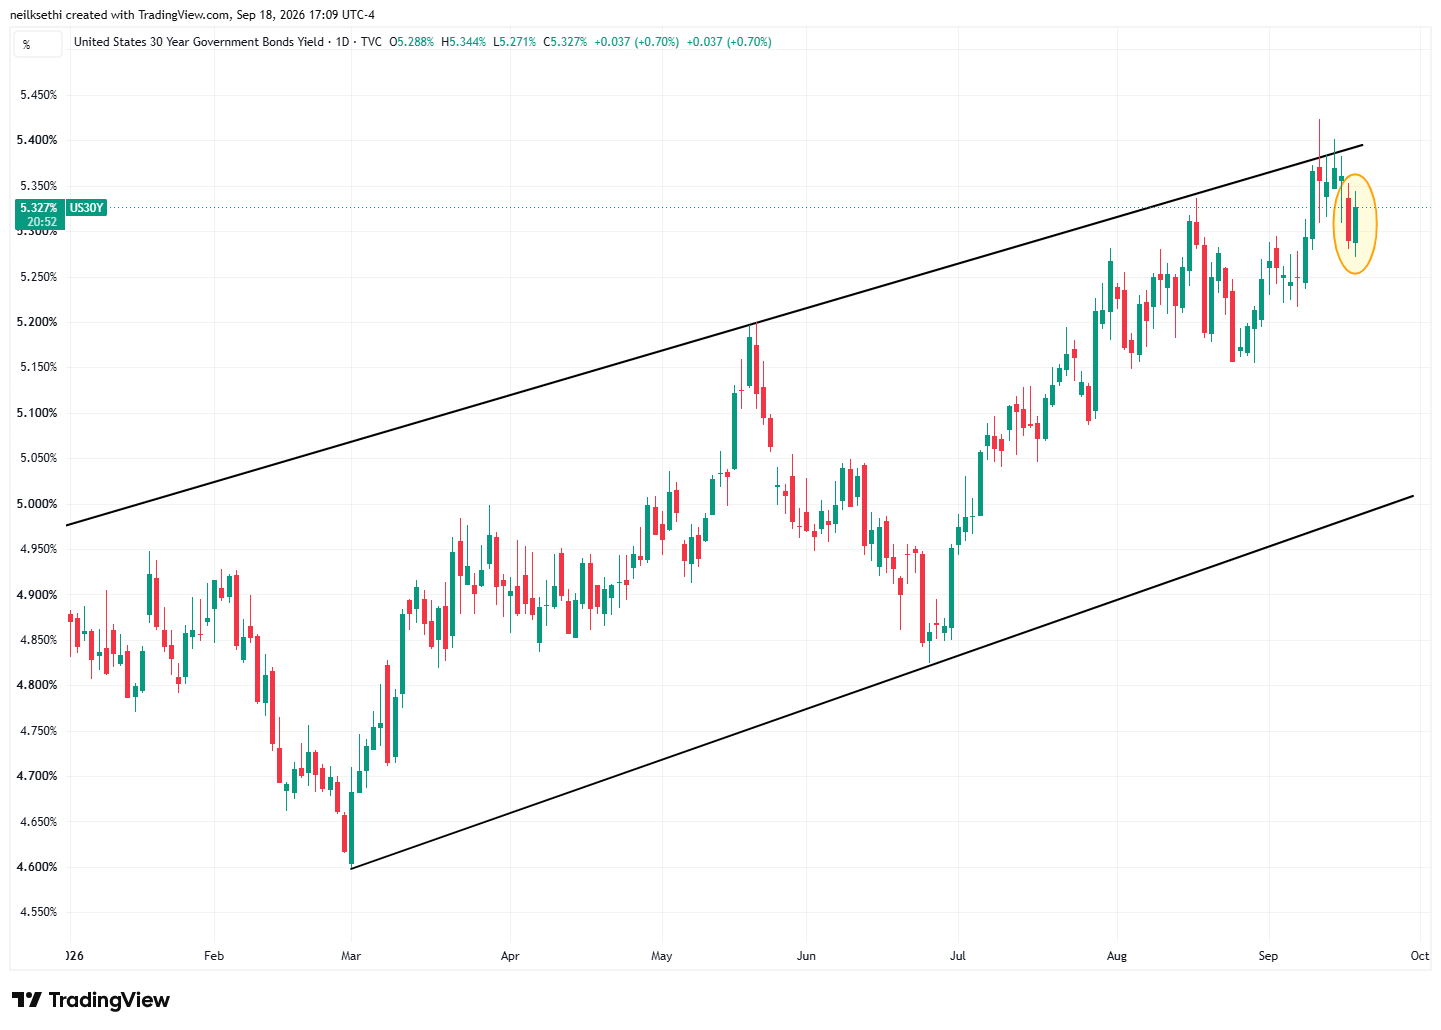
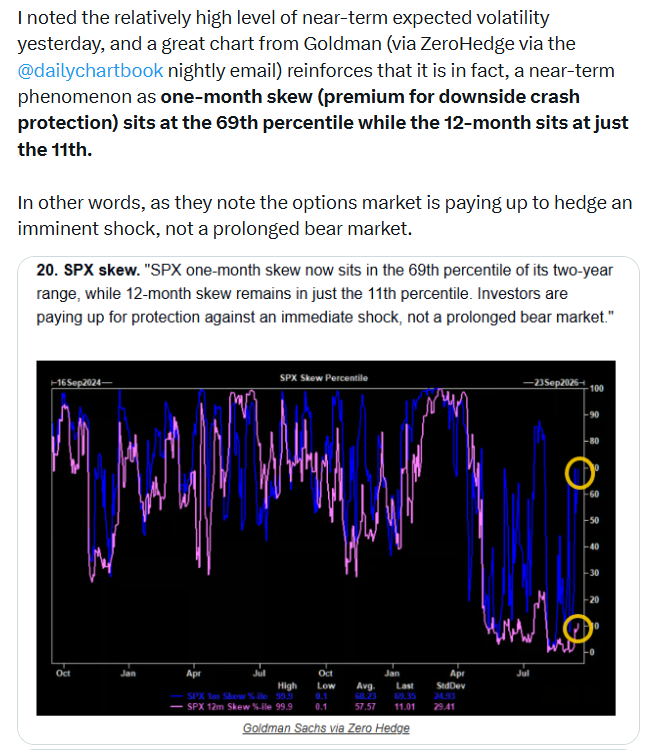
VIX not showing much concern though easing back to 14.8, not far from the lows of the year. That’s consistent with ~0.92% average daily moves in the SPX over the next 30 days.
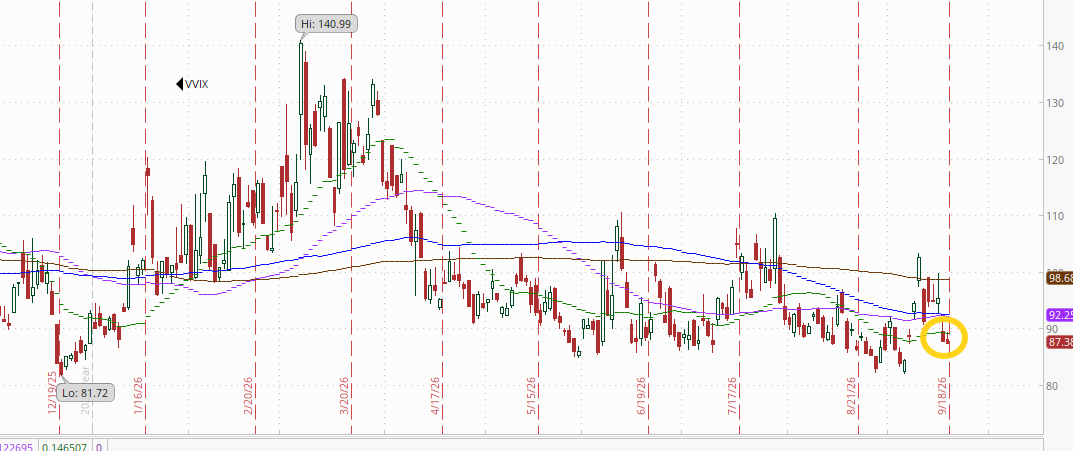
The VVIX (VIX of the VIX) also eased back to 87.4, also not that far from the lows of the year.
The current level is consistent with “moderate” daily moves in the VIX over the next 30 days (historically, normal is 80-100). Above 100 is the level flagged by Charlie McElligott as indicating higher stress.
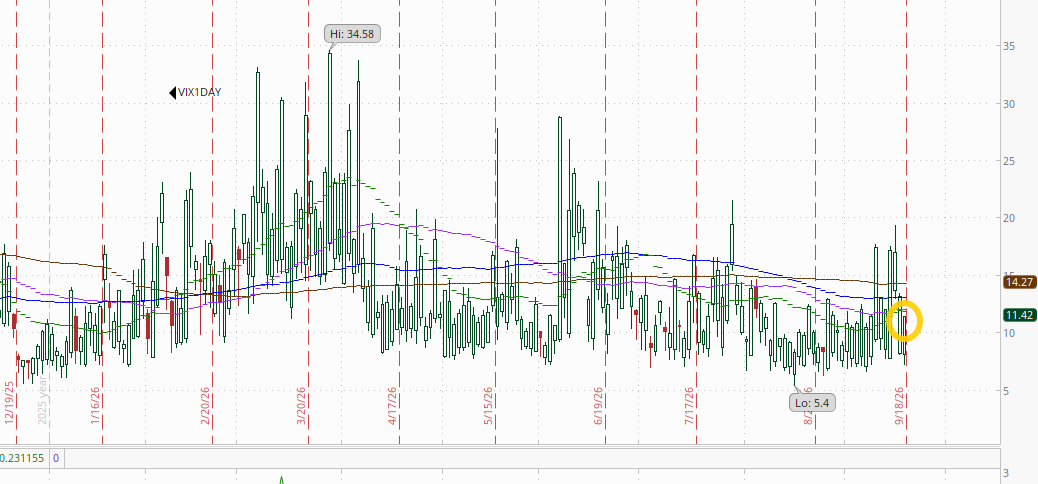
The 1-day VIX unusually (for a Friday with the extra weekend days entering the window) eased to 11.4. The current reading isconsistent with a move of 0.72% in the SPX next session.
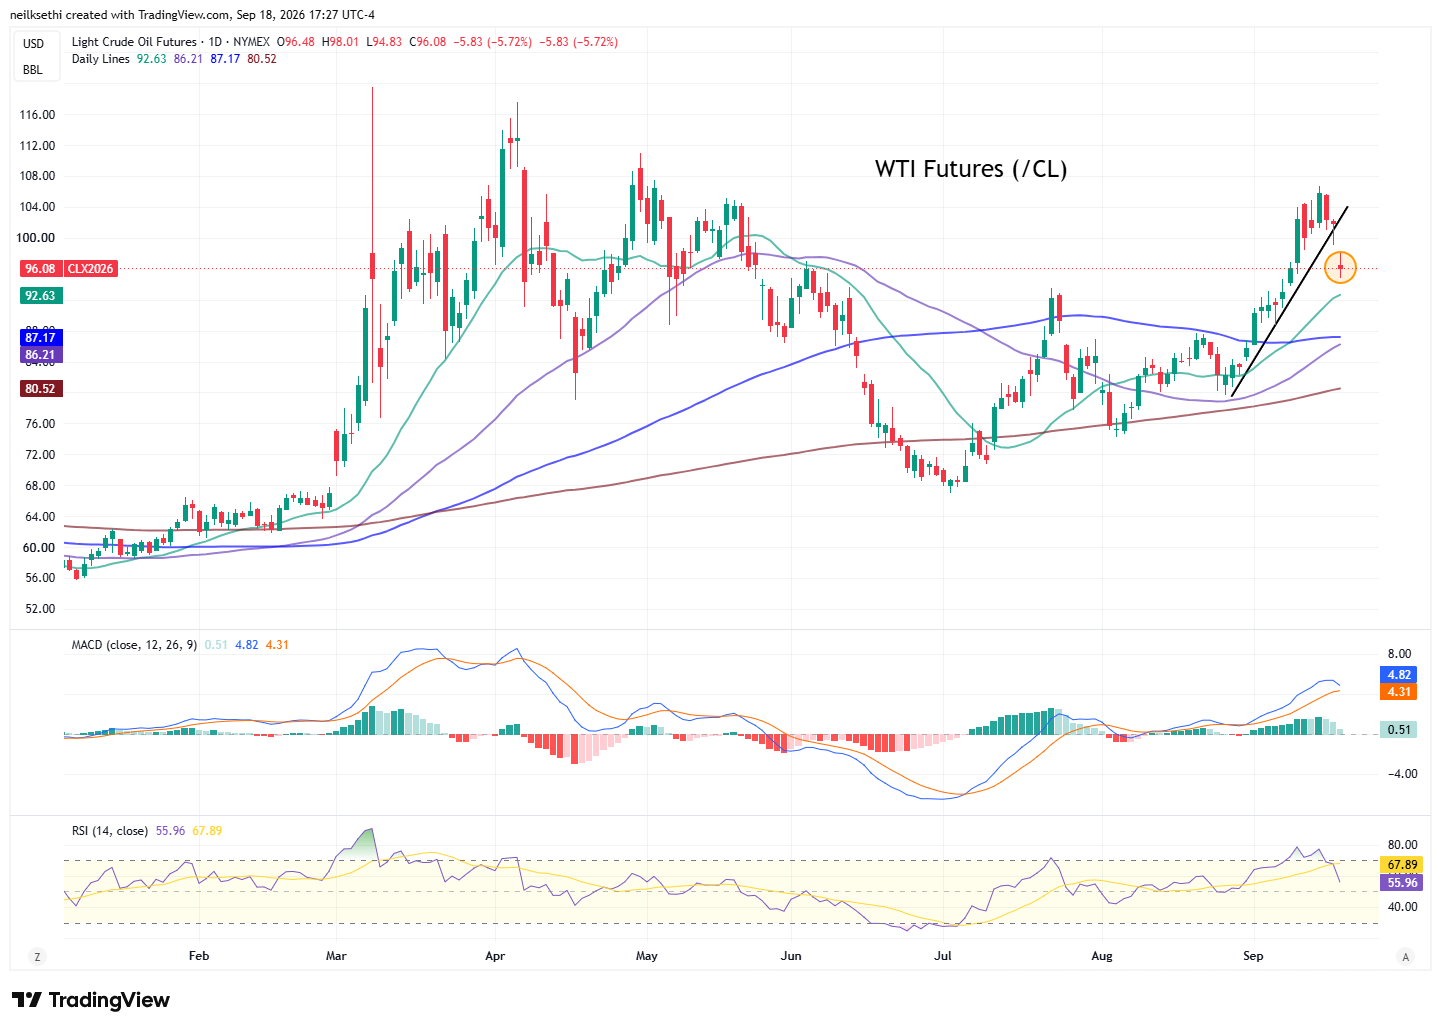
WTI futures (/CL) fell back -5.7% but much of that was the roll to the November contract. Taking that out, the decline was still -1.8% now at a 1-week low and breaking its uptrend.
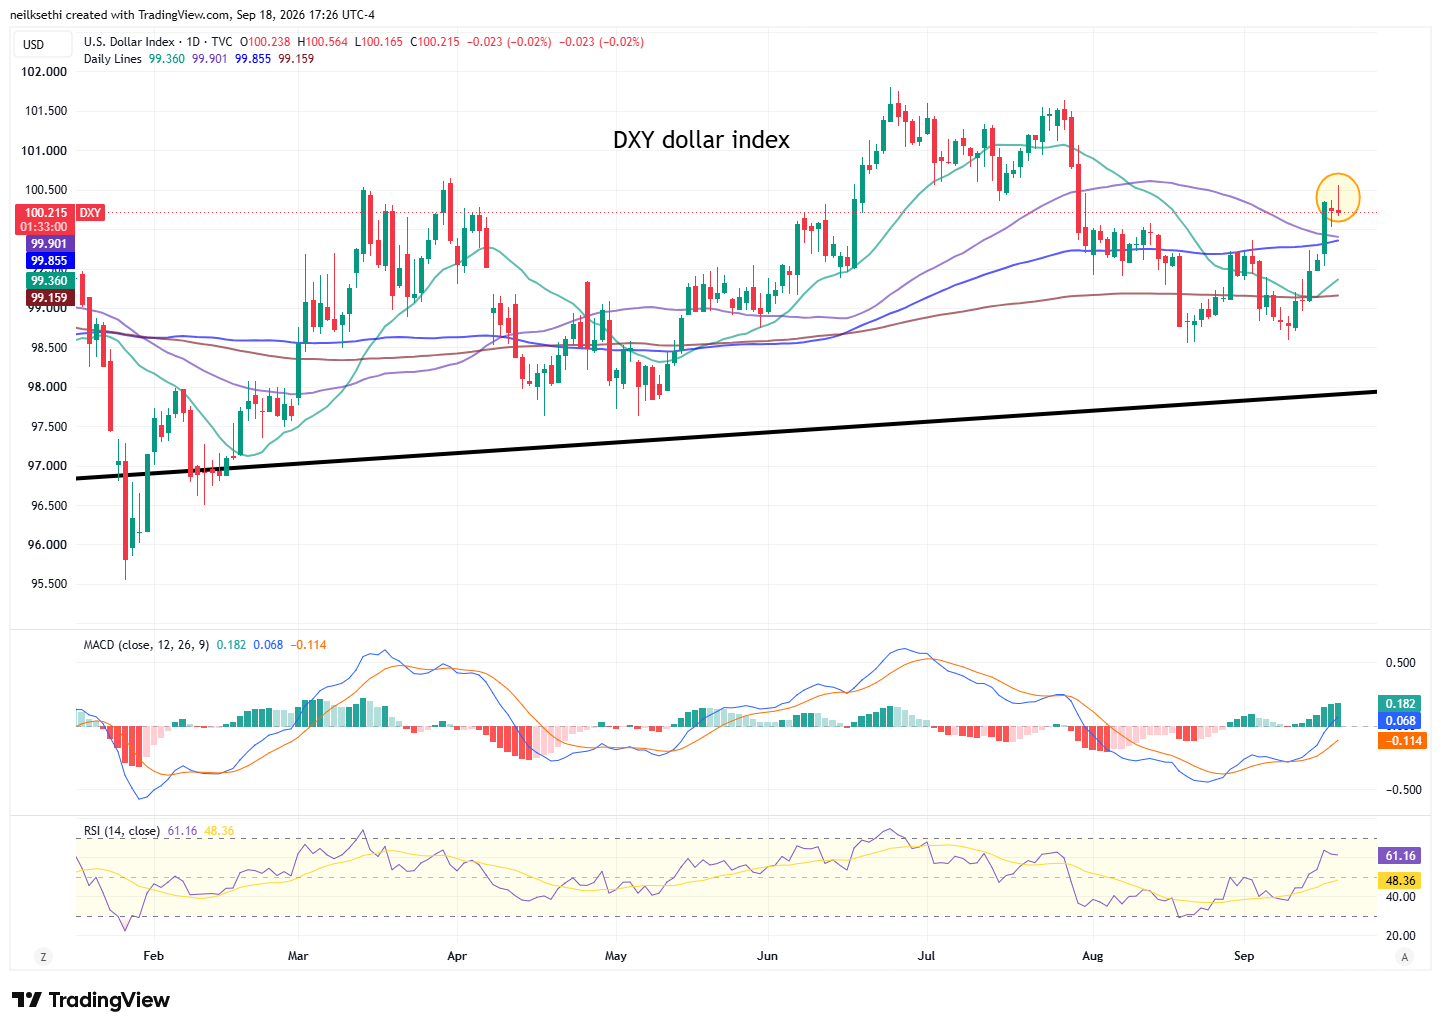
The DXY dollar index (which is fixed weighted with a heavy (57%) weighting vs the euro), gave back what was a strong early gain to end little changed after the yen strengthened sharply following a “rate check” by Japan officials – a precursor to intervention. Still it ended up more than 1% for the week.
While the move Wednesday “opens up a run back up to the highs of the year,” as I mentioned then, as I said Thursday “seems to have stalled out here.” The daily MACD remains positive and the RSI is above 60 so continues to have strong technical support.
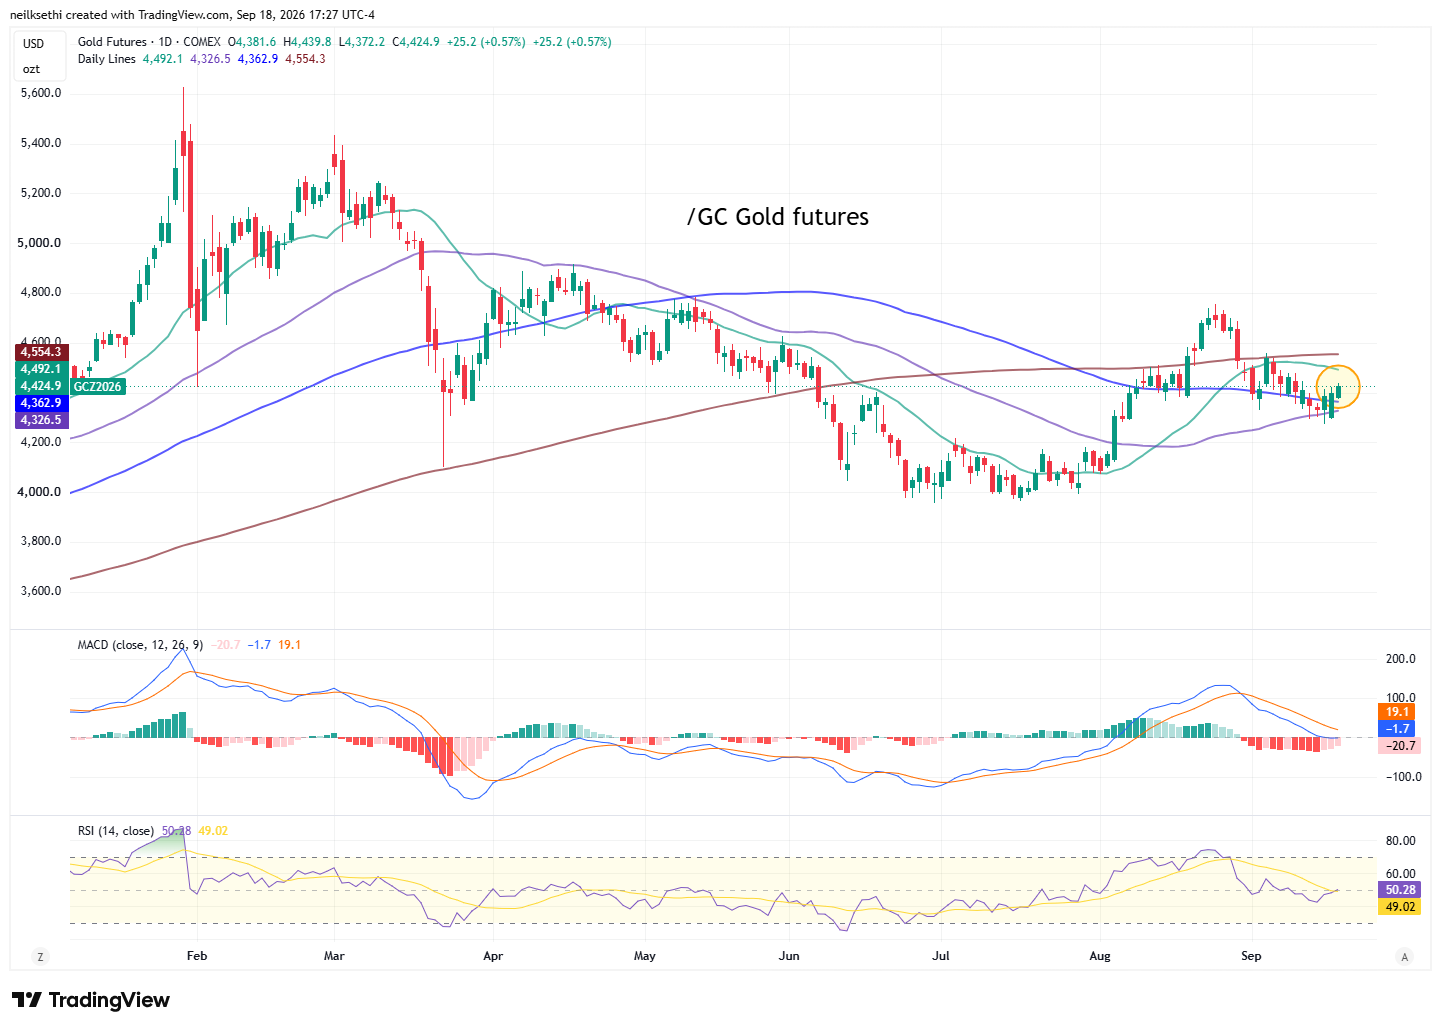
Gold futures (/GC) continued their bounce ending with a mild gain for the week, the first in four weeks. The daily MACD remains negative and the RSI is just back to 50, so I’m still holding off for now. As I said Tuesday though “if it can continue to hold here and the technicals firm up, I may take a shot.”
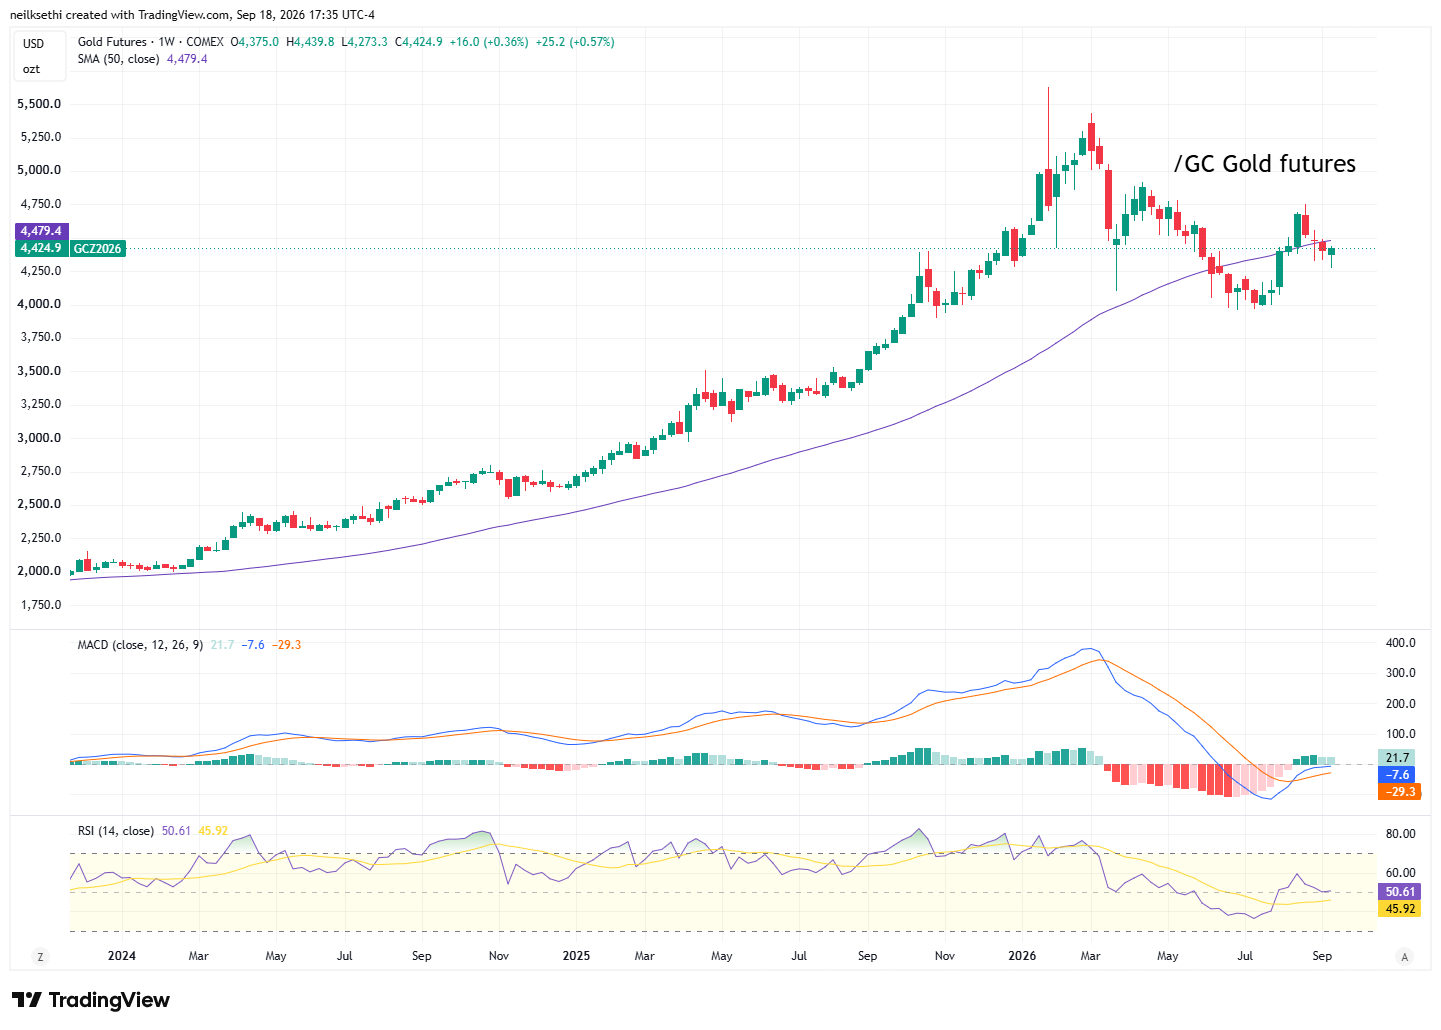
Weekly chart similarly mixed.
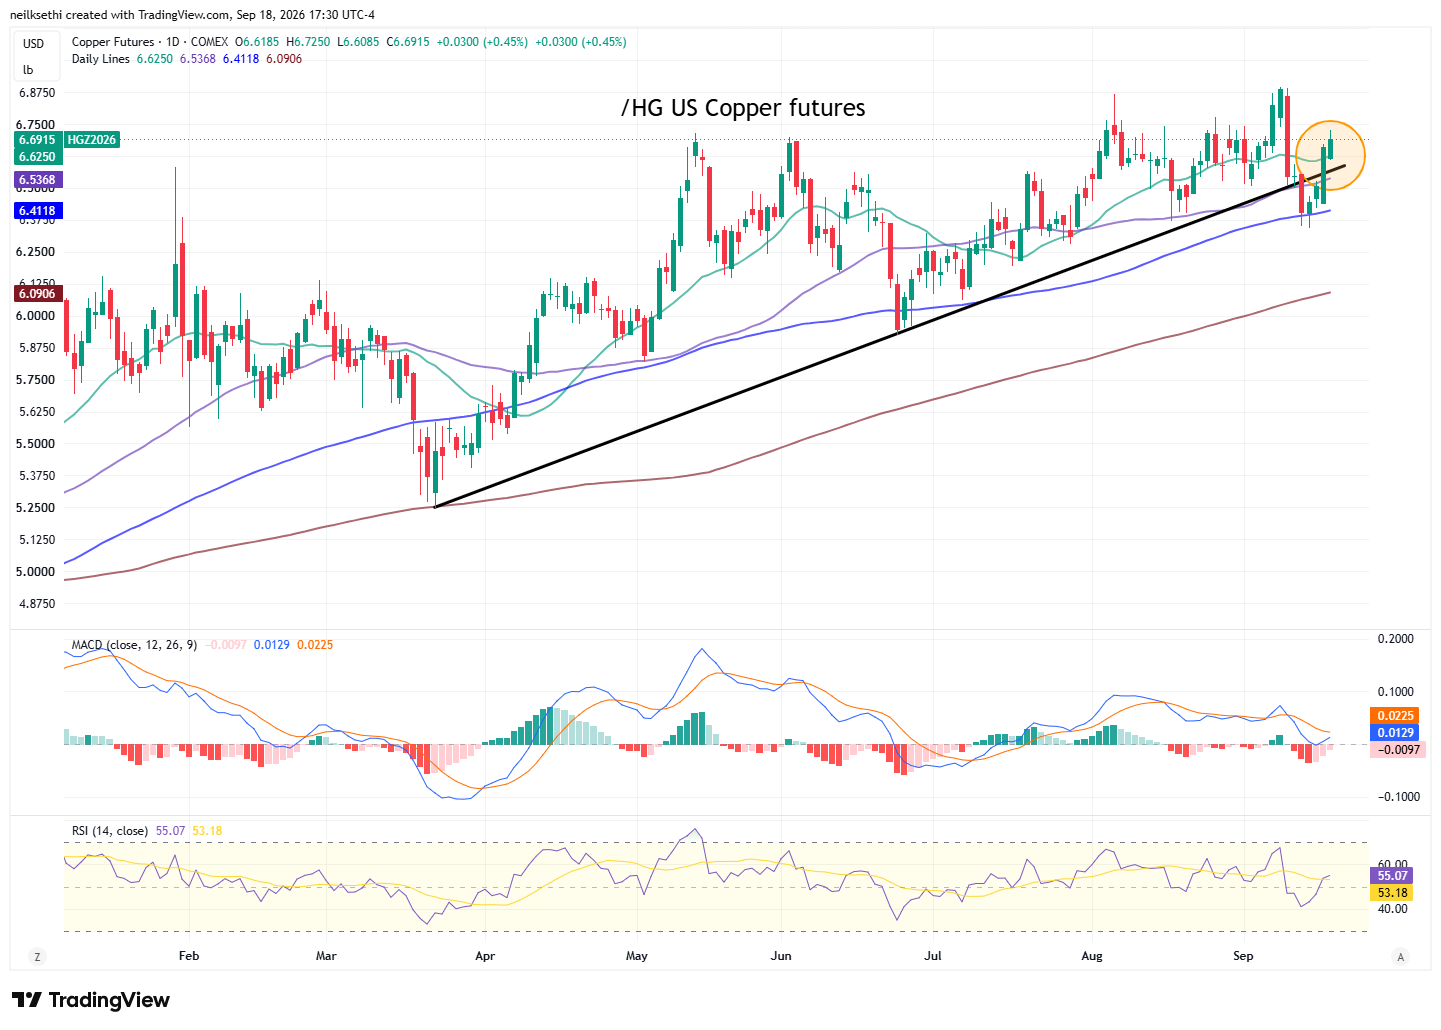
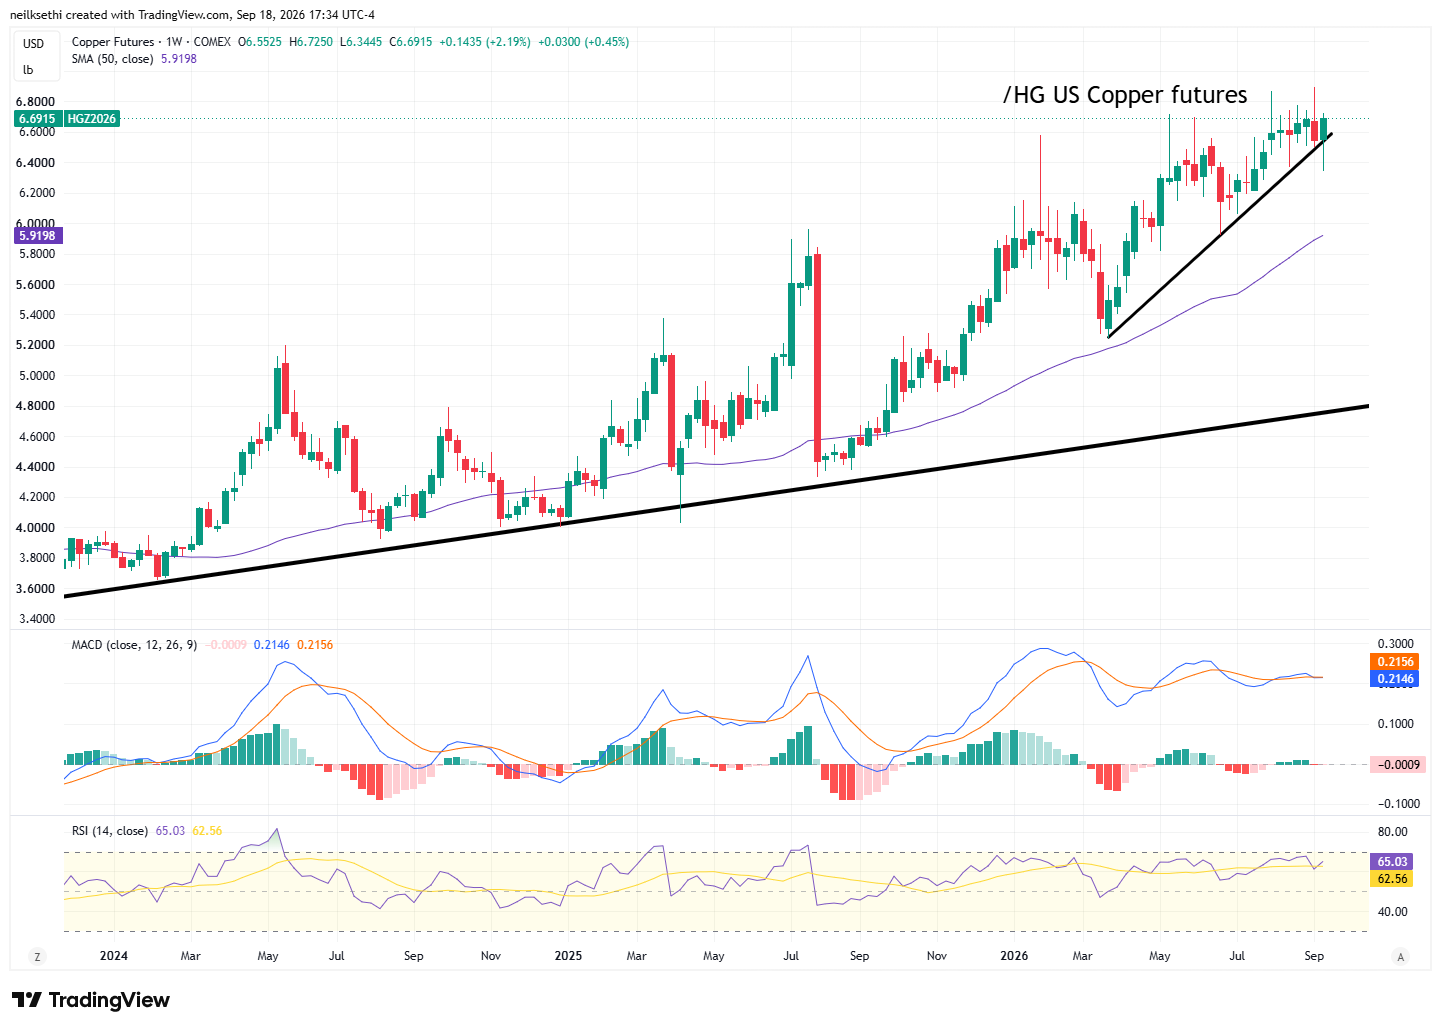
US copper futures (/HG) got a fourth day of bounce. I think I forgot to update this section yesterday, but I did add back what I took off when it reclaimed the 50-DMA. Daily technicals are choppy though so it hasn’t re-established a short term uptrend yet.
Weekly chart maintains its uptrend but the technicals have very much flattened out the last couple months.
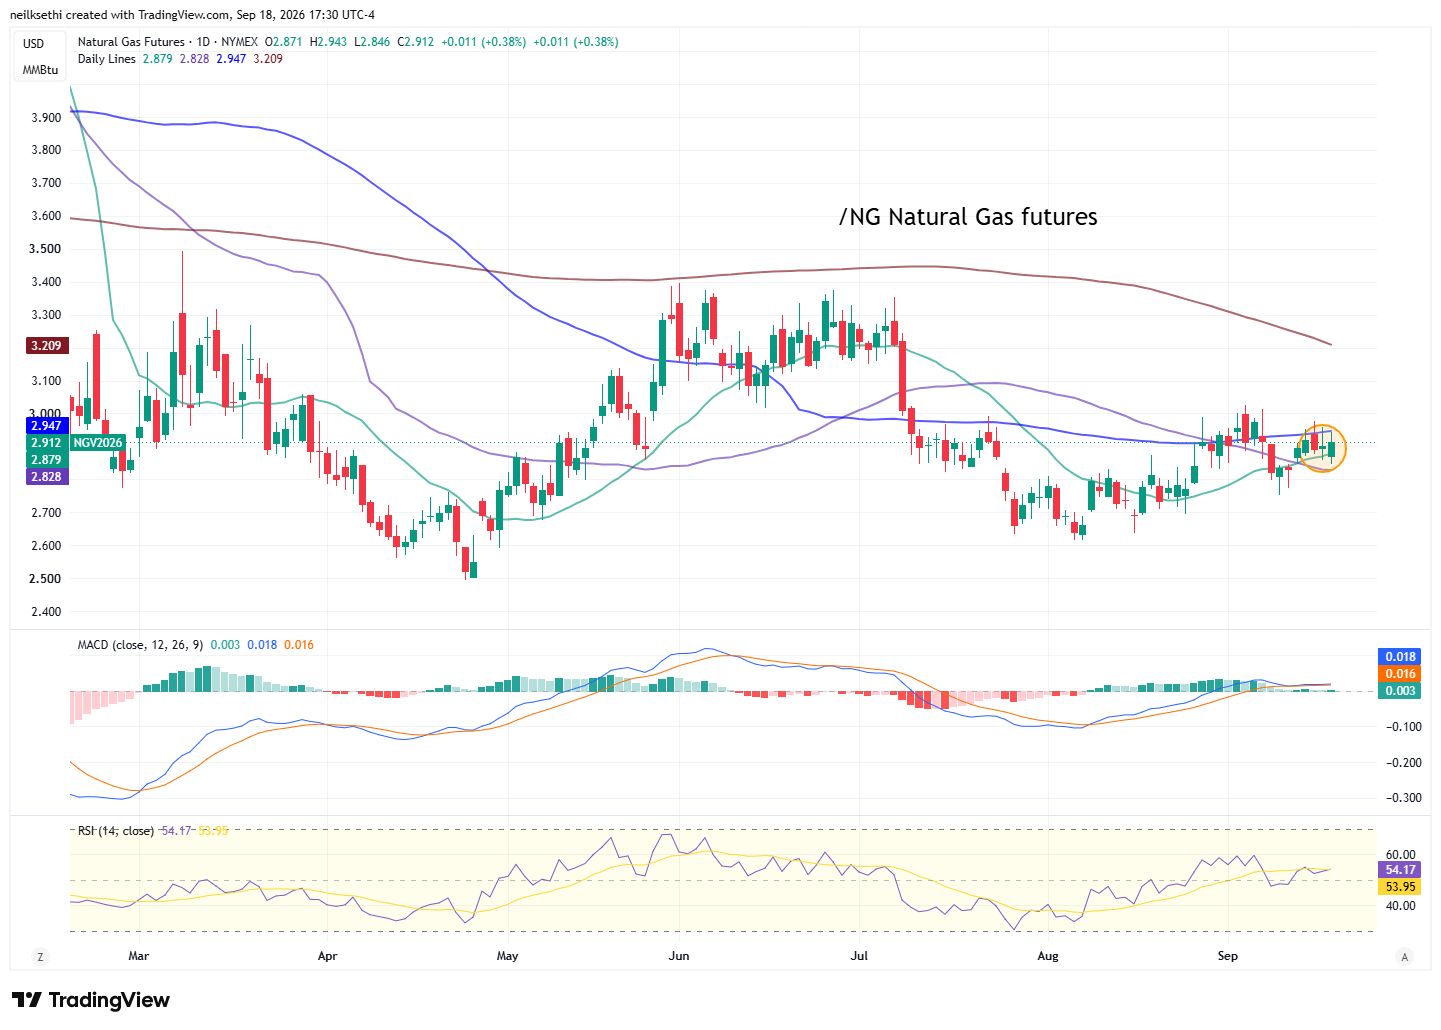
US natural gas futures (/NG) as noted two weeks ago “now back to trading in their range since the start of July.”
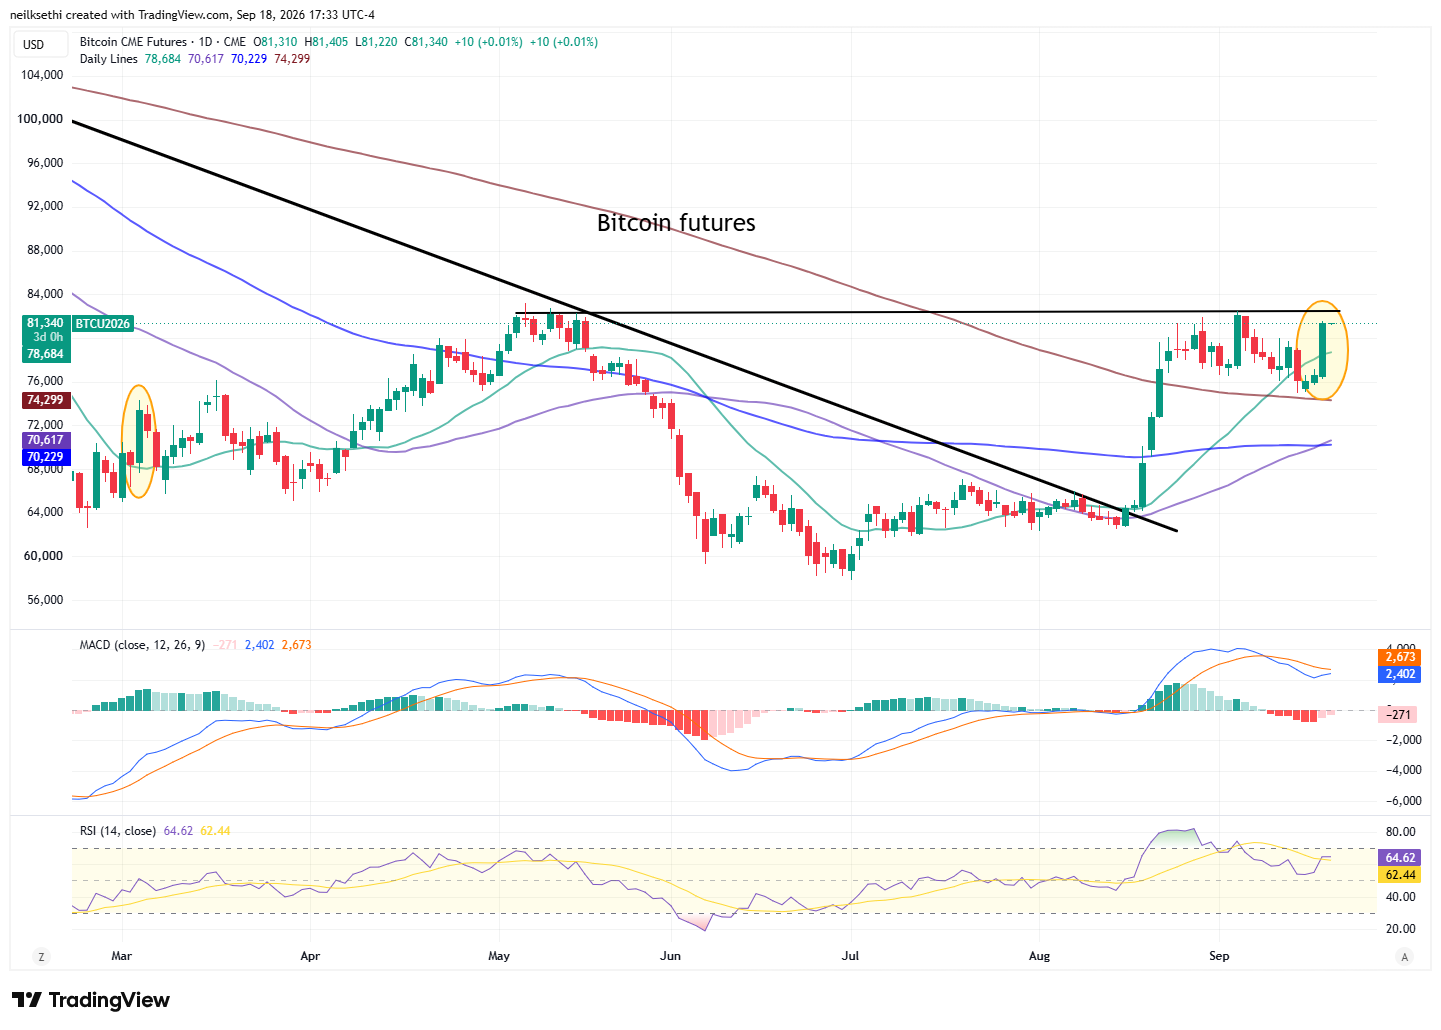
Bitcoin futures jumped +6% as mentioned in the stock and sector section. They are coming up on the important $82,500 level which represents the highs of the year and also capped the spring rally. Clearing that would be notable. Daily MACD is firming while the RSI is over 60.
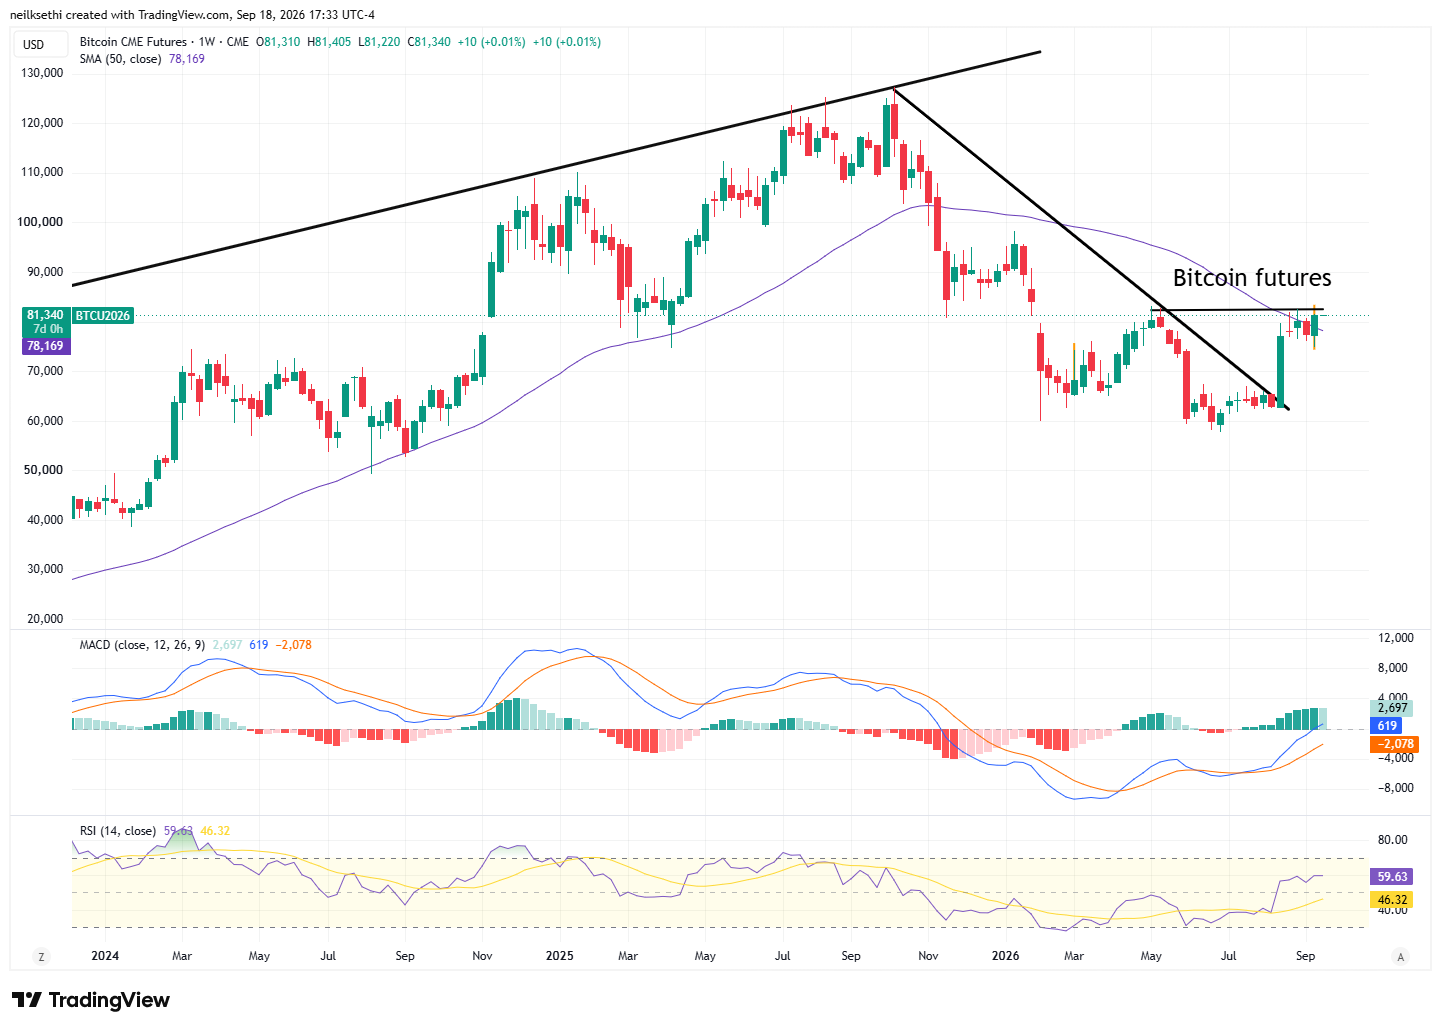
Weekly chart has stronger technicals, encouraging a buy on a break of that key level.
More From TheStreet Pro:
- James “Rev Shark” DePorre – Don’t Confuse Speculation With a Healthy Turn
And From Me If You Missed It:
Miscellaneous:
Wrap-Up – The Market Again Bends but Doesn’t Break
I noted Wednesday:
while we did get the clearing event today, it seems markets are still not quite certain of what to make of it. We’re three years removed from the last hiking cycle, and this will be a much less aggressive affair than that one, so it’s really been since before the pandemic that markets have had to navigate something like this. It will take more than a day or two for them to find their feet.
Most disappointingly, despite Warsh’s best efforts, long term yields still did not seem satisfied (at least not enough to ease back). There’s not much more the Fed can do outside of actually buying the long end, so it will be up to the administration and market participants to decide where long-end yields should settle out. Personally, I have been incrementally adding, but there are many who wouldn’t touch long-term yields with a 10-foot pole seeing us in a new secular bull market for yields (bear market for bonds).
Regardless, markets overall are clearly still jumpy as judged by no softening in the 1-Day VIX, and we remain in that “fragile” situation not far from key support levels. Perhaps traders will have a more positive outlook after getting a chance to digest things. We’ll find out soon enough.
And then yesterday:
And we find out today that, in fact, after having the night to “sleep on it” they decided things weren’t all that bad, particularly with the AI trade that has been gathering momentum all week. But the gains were broad, even if not as broad as I would like, and it moved indices away from those important support levels I have been flagging all week.
As they say, “one day does not make a trend,” so we’ll see where traders take us in coming days. While the calendar is light, tomorrow might not be the greatest day to take a signal from though with options expiration, but we’ll see what we get.
And one day most certainly did not make a trend, as we saw breadth once again weaken with a more negative day averted just by the continued strength in Technology. There (Tech), though, we’ve not seen one or two days, but now three in a row. Perhaps that does make a trend. As mentioned above the Nasdaq (and the Tech sector itself) are at key levels where further gains would look like a breakout. Is the Tech trade back (and with it Helene’s either/or market)?
Perhaps. Let’s see how things look after we have a chance to go through our checklist on Sunday.
The Week Ahead – Light on Data; Heavy on Fedspeak
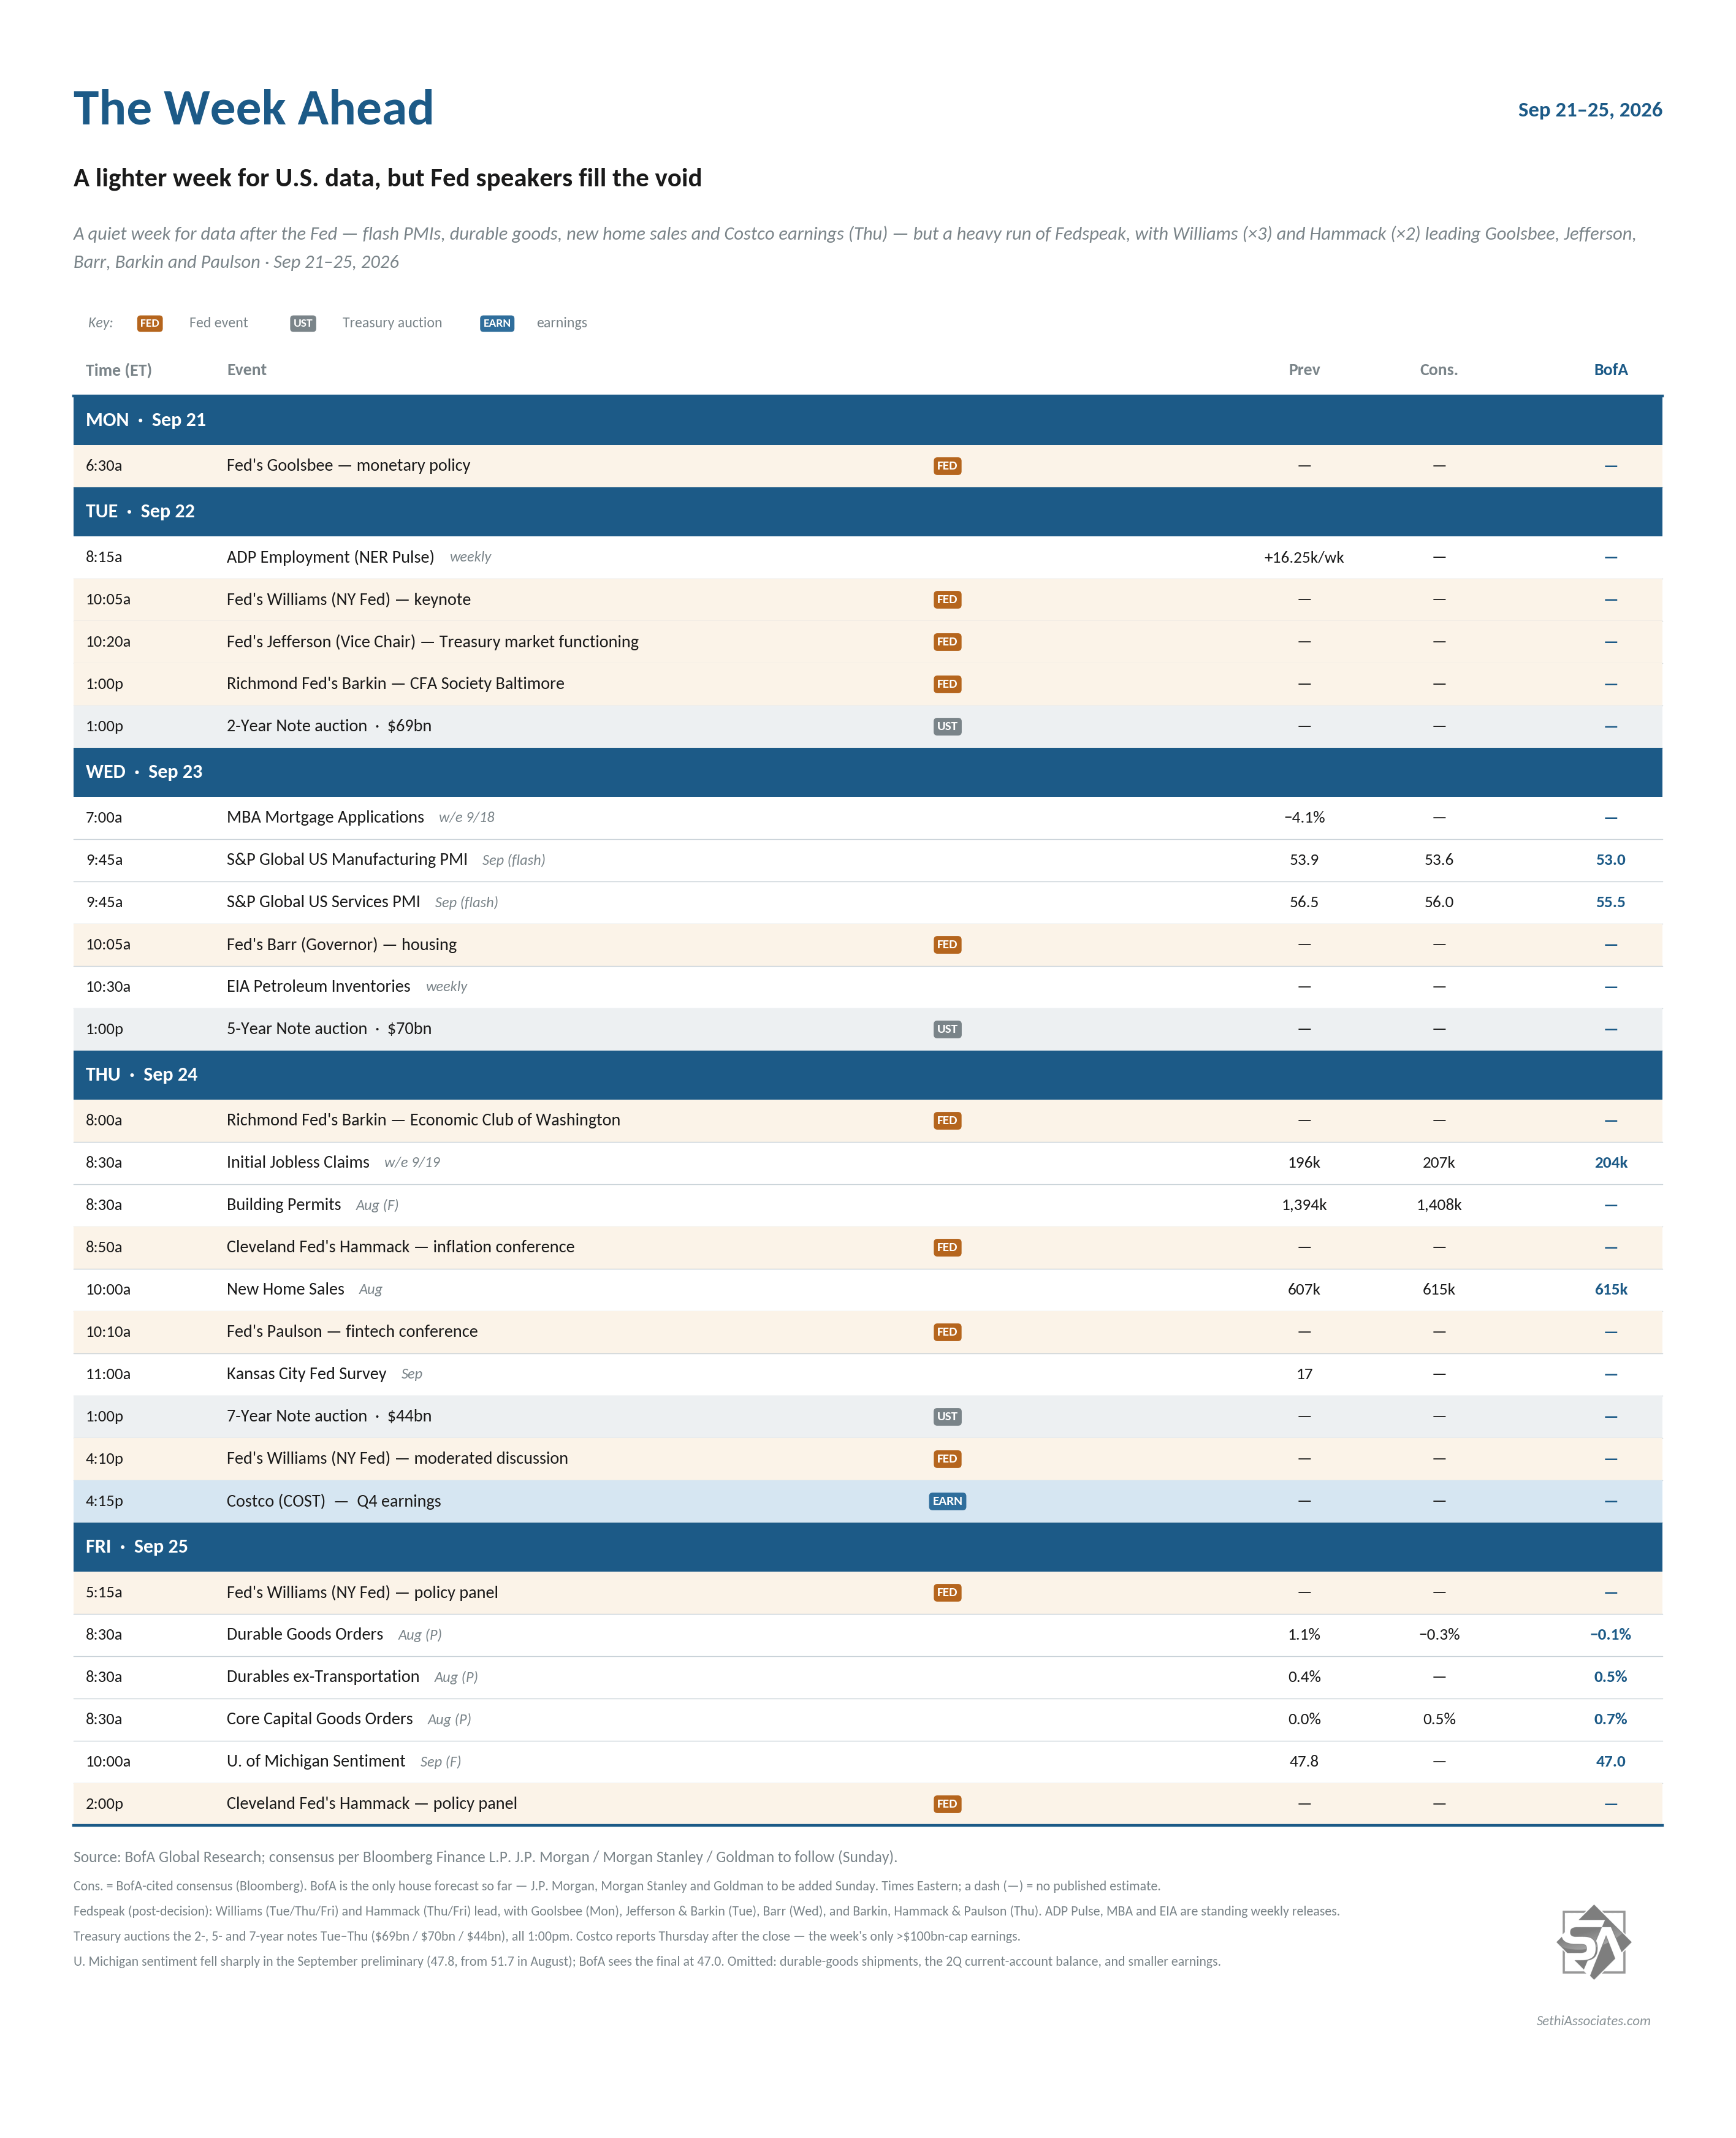
US economic data is fairly light next week with just the September flash PMIs and UMich final consumer sentiment survey, August new home sales and durable goods (lasting >3 years) reports, some more regional Fed PMIs plus the normal weekly reports (ADP, unemployment claims, etc.).
The Fed speaking blackout is over, and here they come. Currently on the calendar we have Vice-Chair Jefferson, Governor Barr, and Fed Presidents Goolsbee, Williams (3x), Barkin (2x), Hammack (2x), and Paulson, and there are always more.
Non-Bill (>1yr in maturity) US Treasury auctions pick up some with 2, 5, and 7-year offerings Tuesday, Wednesday, and Thursday respectively.
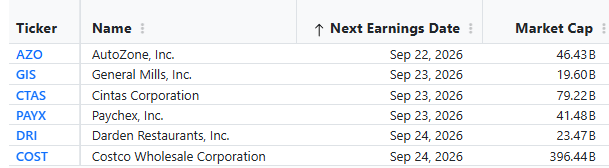
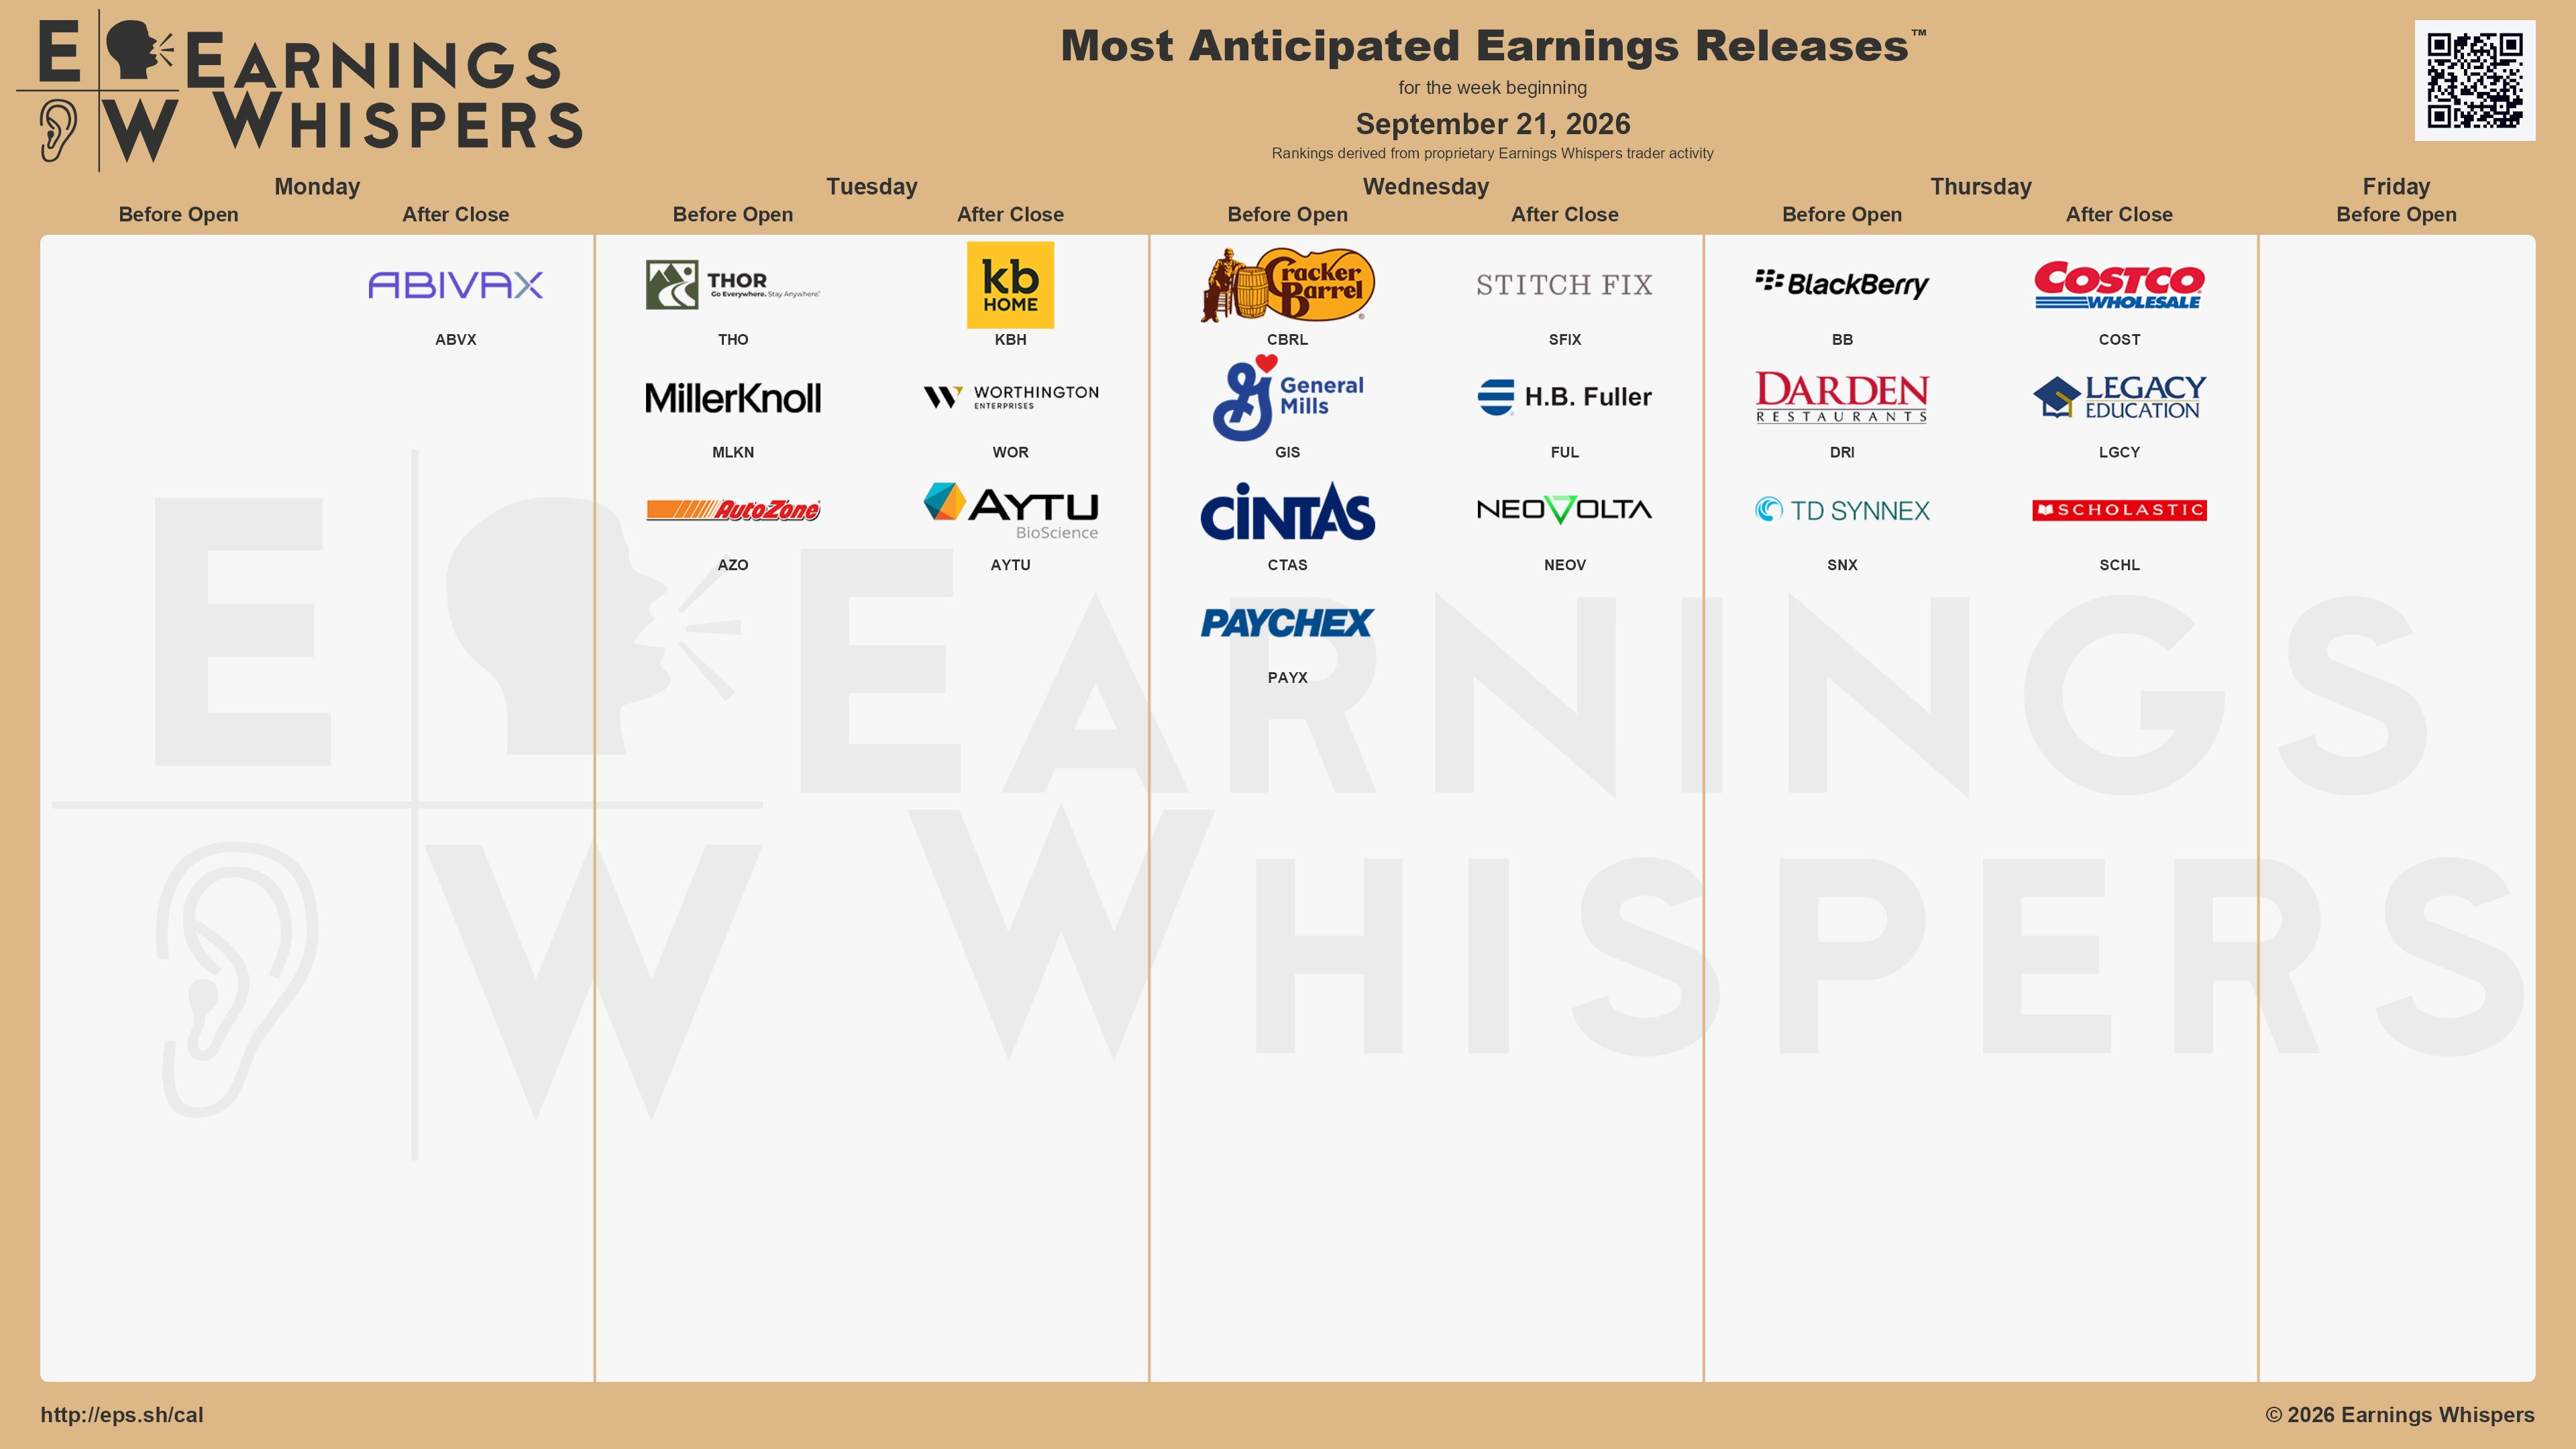
We are now in the weird middle ground between Q2 and Q3 earnings. Next week we’ll get six SPX components reporting headlined by Costco ($COST) the only one greater than $100 billion in market cap. The others are Autozone ($AZO), General Mills ($GIS), Cintas ($CTAS), Paychex ($PAYX), and Darden Restaurants ($DRI).