A Look Back on a Very Dark Day on the Market


Living the life… maybe. I tend to be a technology bull. Long-time readers know this. I am well aware that I may bring with my opinions an unintentional bias. Let’s be fair though. Tech stocks have been good to me and good to my family. Not just for a short time. For decades, literally. We have suffered severe market beatings at times. The years-long recovery from “The Great Financial Crisis” comes quickly to mind.
Before that, there was the “Dot-Com” run and the famous bursting of that bubble. Going further back, there was the mini-crash of 1989 and a little further back, the one actual crash of my career, that being the “Black Monday” crash of October 19, 1987. Yes, those other “crashes” did their damage, but none were as quick, as in your face, and as horrific as the one-day drop suffered by U.S. stock markets that day.
Exactly 39 years have passed. I was a very new “trading assistant” (back then, we were called clerks, before that term was deemed derogatory) far more comfortable in combat boots than on the trading floor of the New York Stock Exchange.
I was working for the Pershing division of Donaldson, Lufkin & Jenrette at the time. My spot was under the podium at the NYSE, right in front of Post 9. That post is now nothing more than a studio used for live broadcast by CNBC. A fairly degrading shift over time, but a better fate, when all things considered than what was ultimately suffered by all of the other posts on that trading floor.
To put that day in perspective so that modern investors and traders can understand, the Dow Jones industrial average (still relevant in 1987) suffered a loss of 22.6%. That’s right. In one day. The S&P 500 gave up 20.5% that day. In both cases, this was easily the single worst day in the history of those indexes. The second worst, a 12.9% Covid-related loss in March of 2020, doesn’t come close.
Trading volumes on Oct 19, 1987 ran at roughly 330% of the 1987 daily average. For those about to ask, the Nasdaq Composite was created in 1971, but was not considered to be on a par with the S&P 500 until the 1990s, about the same time that the Dow Jones industrial average surrendered that status.
As for the 7,500 (or so) folks who worked on the trading floors of the New York and American Stock Exchanges at the time? (An AI search says that there are only “dozens” of floor traders left as the NYSE no longer releases a headcount). Even small trades were done by hand back then. Our employers brought in BLT sandwiches and Budweisers around dinner time. The tape was way behind. We did not learn the status of some of our orders until 7 that night. We did paperwork until 11:30 p.m. That’s when they cut us loose and told us to be at our spots at 6 a.m. (I had a roughly 2 hour “each way” commute at the time).
We kept those hours up all week. The New York Stock Exchange moved the closing bell up to 2 p.m. from 4 p.m. so that us humans could catch up on paperwork. The 4 p.m. closing bell returned in mid-November. My colleagues had to work through the weekend that followed. Still a Marine Corps reservist at the time, I had a drill weekend that weekend, so I was excused. Live fire at the mortar range at Fort Dix, New Jersey. Oh, I was in some mood for that.
Do we crash today as some have surmised over the weekend? Through the overnight session, it certainly does not look like it. That’s enough for today’s history lesson. I know that I am not the last trader that was relevant in 1987 who still is, but we are getting down to a precious few. Let’s get our heads back in the game, shall we?
The ‘Quiet Period’
The Fed’s Federal Open Market Committee has now gone into its media blackout period ahead of the policy decision to be announced next Wednesday (Oct. 28) afternoon. Right now, futures markets imply that no change to monetary policy will be made next week, but that this tightening cycle obviously still has plenty in the tank. Last week’s hot consumer price index and producer price index reports for September re-kindled that fire.
Consumer-level inflation has remained above the Fed’s 2% annual target for more than five years now. Fed officials spent last week explaining why they are concerned about this resurgence in inflation, but did so without committing to an immediate increase in short-term rates. Several key speakers such as Chicago’s Austan Goolsbee and San Francisco’s Mary Daly both cautioned against over-reacting to this recent pop.
Cleveland’s Beth Hammack, however, remains a problem and continues to call for higher interest rates. Hammack apparently makes no connection between increased borrowing costs and reduced economic activity / reduced demand for labor at a time when labor is weakening on its own due to AI. Fed Chair Kevin Warsh has quite prudently been quiet on the matter and has kept his cards close to his proverbial vest.
Sobering Take on AI
Hey, did you kids catch Peggy Noonan’s op-ed this weekend at the Wall Street Journal? If you did not, I would recommend you check it out. AI has been the driver for both economic growth and growth for corporate profitability over the past few years. All good, right? Citing Maria Curi of Axios, Noonan wrote, “AI companies are planning what to do on ‘the day after’ a coming catastrophic AI-caused event. ‘Many AI industry insiders told Axios they believe a major event will occur in the next six to 12 months.’ They think it will most likely involve a large-scale cyberattack on infrastructure or financial systems. AI companies are privately ‘gaming out scenarios’ for a subsequent public and political revolt.”
Peggy also referred to Jack Clark’s (cofounder of Anthropic) newsletter. This week, he wrote that full recursive self-improvement will likely arrive in 2027, not 2028.
What does that mean? “Recursive Self-Improvement” or RSI for short, means that the AI model improves itself so rapidly that humans will likely lose the ability to understand or control it. Clark speaks of RSI as if it’s coming or about to arrive. The AI companies? They are continuing to build in their competition with one another and in competition with China, Russia and Iran. We, unfortunately, have no choice.
The Week Behind…
Last week was not only about big bank earnings, which were expected. The meltdown over AI-spending and associated debt levels really put the whammy on tech stocks. In addition, back to back red hot readings for September (CPI & PPI) inflation left absolutely nobody feeling warm and fuzzy.
The Week Ahead…
The primary risks to equity market health this week remain the perception that the current rate of inflation will persist. This, of course, moves hand in hand with the idea that higher interest rates are coming and that borrowing costs will soar. Then, there’s the uncertainty over AI, AI-related infrastructure, potential for returns from that space and AI-related debt loads. Oh, joy.
Catalysts…
- Earnings will be front and center this week as the season moves on from the banks and on to other industries. Quarterly financial results are due from the likes of Meta Platforms ($META), Tesla ($TSLA), Netflix ($NFLX), GE Aerospace ($GE), RTX ($RTX), General Motors ($GM), among other headline-level companies. As always, guidance will be crucial. For the markets, especially this week, anything said focusing on AI-related spending will probably move markets more than anything else.
- As far as corporate events are concerned, this week brings Nvidia’s ($NVDA) GTC Berlin conference, Kroger’s ($KR) Investor Day, and the Cloudflare ($NET) Connect conference.
- On the macro side, September Housing Starts and Building Permits are due this Tuesday. In what will be a quiet week economically, investors and economists will have to wait until Friday to see the October flash PMis for the U.S. and the revisions to the University of Michigan’s October surveys for Consumer Sentiment and Inflation Expectations.
- Just a heads up. The Fed will not be a catalyst this week. The FOMC has gone into their eight times a year media blackout period ahead of next week’s policy decision.
The Week That Was…
Equity markets had a rough week last week. After a quiet Monday, which was a bank, but not market holiday, the environment for stocks got quite ugly. The Nasdaq Composite posted its first losing week after a four week winning streak. That said, the “down” week was a doozy, and dismantled all of the progress made over the four weeks prior. The S&P 500 posted its fourth losing week in the past six. This is how last week went for U.S. equities…
- The S&P 500 lost 1.09% on Friday and 1.95% for the week.
- The Nasdaq Composite gave up 2.14% on Friday and a nasty 4.48% for the week.
- The Nasdaq 100 gave back 2.5% on Friday and a gnarly 5.49% for the week.
- The Russell 2000 surrendered 1.66% on Friday and 3.05% for the week.
- The S&P Small Cap 600 lost 0.92% on Friday, and 1.16% for the week.
- The S&P Midcap 400 slipped 0.89% on Friday but 1.46% for the week.
- The Dow Transports gave up 1.13% on Friday but gained 0.38% for the week.
- The Philly Semis gave back 3.83% on Friday, and were roasted for 11.41% on the week.
- The KBW Bank Index actually gained 0.24% on Friday but lost 0.95% for the week.
On Friday, six of the 11 S&P sector SPDR ETFs closed out the session in the green, which may be counterintuitive to what you may have thought. The winners were led by energy ($XLE), the utilities ($XLU) and the staples ($XLP). Technology ($XLY) and communication services ($XLC) suffered badly.
For the week, seven of the 11 S&P sector SPDR ETFs finished the period in the green, which again, might be considered to be somewhat surprising. The Staples and Energy were not surprisingly big winners. Technology was the runaway loser.
Earnings
As of Oct. 16, according to FactSet, for the third quarter, Wall Street now sees an estimated year over year blended (results & expectations) earnings growth rate for the S&P 500 of 29%, down from 29.1% two weeks back. Wall Street also sees revenue growth of 12.6% up from 12.1% at that time.
For the full year of 2026, Wall Street now looks for earnings growth of 32.8%, up from 32% two weeks ago. This would come on revenue growth of 12.7%, up from 12.3% at that time. The outlook for the fourth quarter is also very positive. Fourth quarter S&P 500 earnings growth is now estimated at 28.6% year over year, up from 26.8% a couple of weeks back. At the moment, the energy, technology, and communication services sectors are projected to have grown Q3 earnings by 127.6%, 65.1% and 50.1% respectively.
Under-Valued?
Uhm… yeah. Using data provided by FactSet, the S&P 500 ended last week trading at 19 times 12 months’ forward-looking earnings, down from 19.2 times two weeks ago. This is below both the five-year average of 19.8 times for the index, and also the ten-year average of 19.1 times.
The S&P 500 also ended last week trading at 26-times trailing 12 months’ earnings, up from 25.8 times two weeks ago. This still stands well above both the five-year (24.4 times) and 10-year (23.6 times) averages for the index.
Currently, six of the 11 sectors are now trading below their five-year average valuations. Five sectors, led by the Industrials (22.6 times) are trading at a premium to their five-year average valuation. The seven “undervalued” sectors according to their historical averages over five years are the discretionaries, technology, the utilities, the REITs, the financials, and the materials.
Fed Funds Futures
Fed Funds futures trading in Chicago are now pricing in an 84% probability for change to be made next week to the current target range (3.75% to 4%) for the Fed Funds Rate at the culmination of the Oct. 28 FOMC policy meeting. That next rate hike is now priced in for December 9th (92% likelihood). In all, 72 basis-points worth of rate hikes are now being priced (60% probability) in by June 9, 2027.
Charts
Readers will note that on Friday, as ugly as it was, and as ugly as this chart is, the S&P 500 pierced its 50-day simple moving average to the downside, but still has not broken contact with that line.
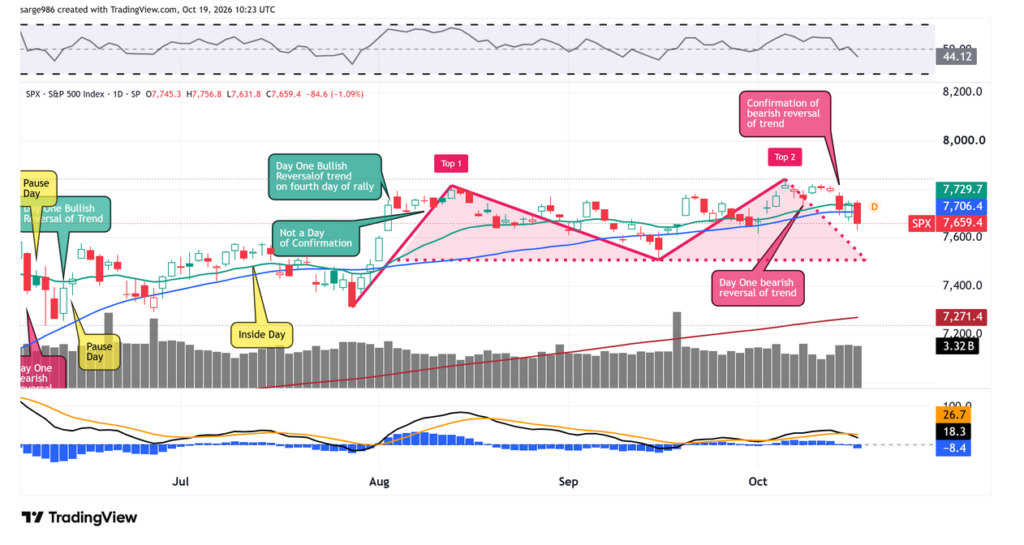
Remember, levels are not lost when pierced. For a level to be broken, contact must be lost. This could offer the bulls some encouragement going into Monday’s session.
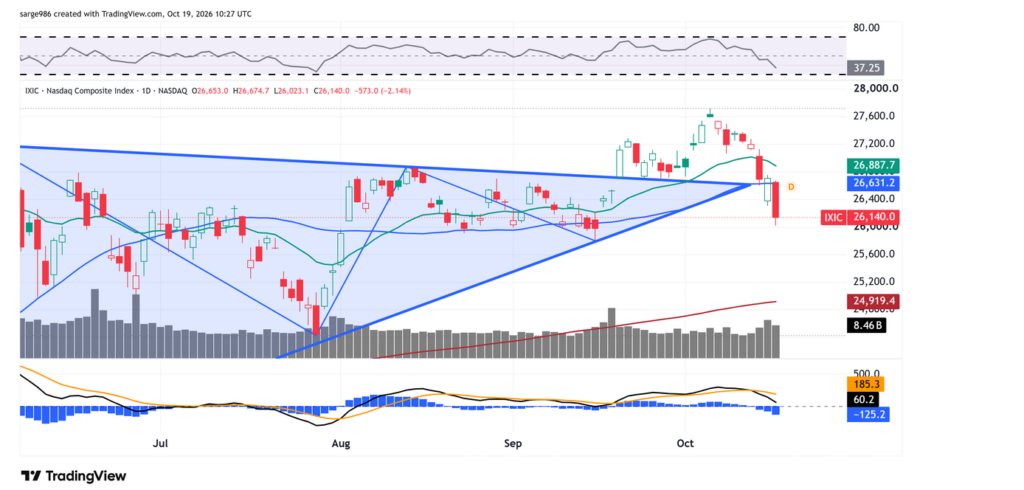
On that matter, watch carefully, the Nasdaq Composite. Even a rally on Monday that does not recover Friday’s losses in their entirety could leave the 50-day SMA for that index as a point of resistance. The bulls do not want to see that.
Economics (All Times Eastern)
10:00 – NAHB Housing Market Index (Oct): Expecting 31, Last 32.
The Fed (All Times Eastern)
Fed Blackout Period.
Today’s Earnings Highlights (Consensus EPS Expectations)
Before the Open: CLF (.24), FITB (1.08)
After the Close: CCK (2.26), WAL (2,43)
At the time of publication, Guilfoyle was long RTX, NVDA equity.
