Oscillator Still Slightly Overbought

The S&P Short Range Oscillator remains slightly overbought at 1.47% vs. 1.84%.
Position: None
The S&P Short Range Oscillator remains slightly overbought at 1.47% vs. 1.84%.
Position: None
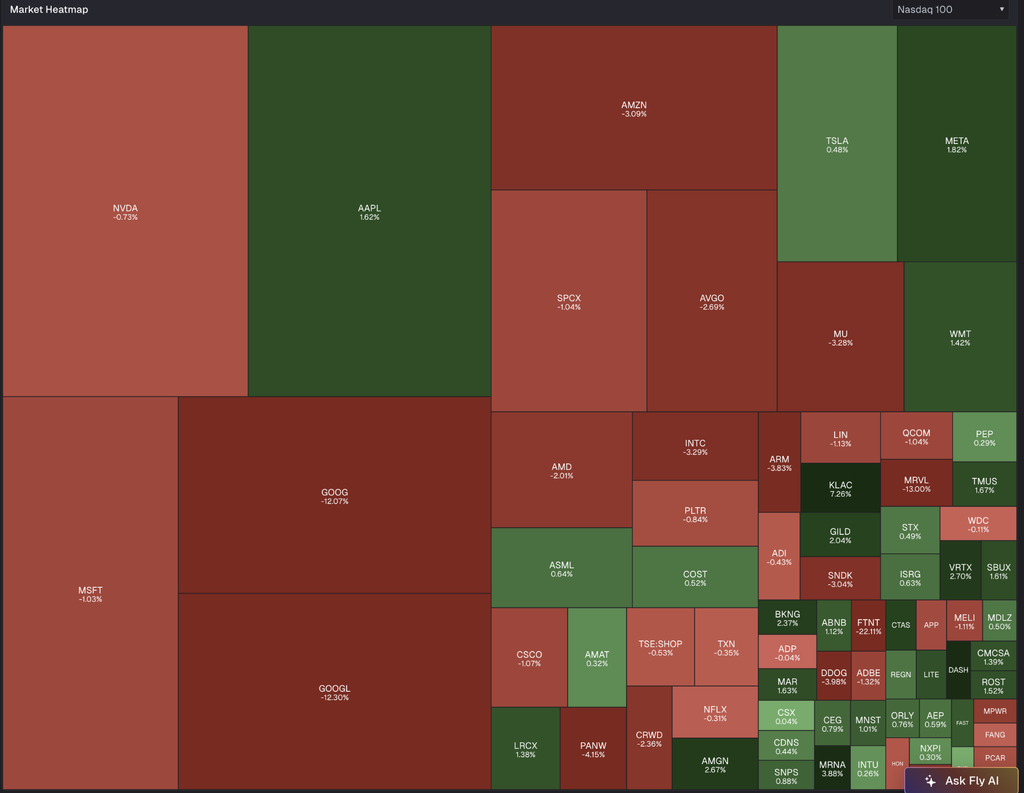
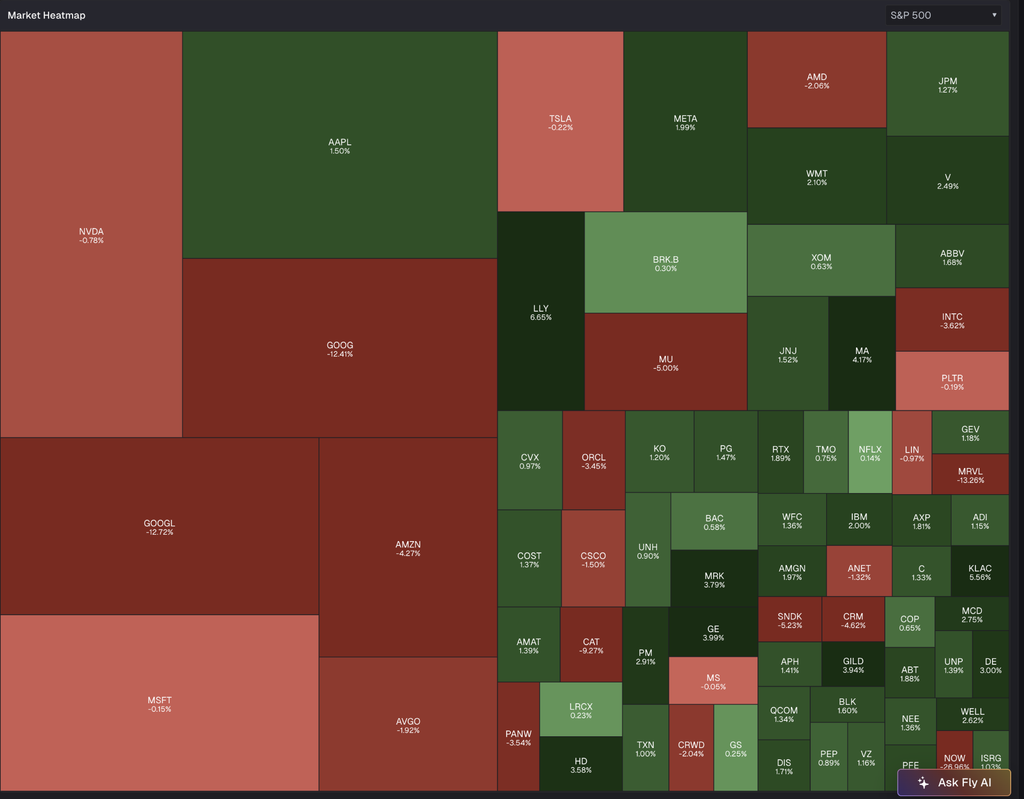
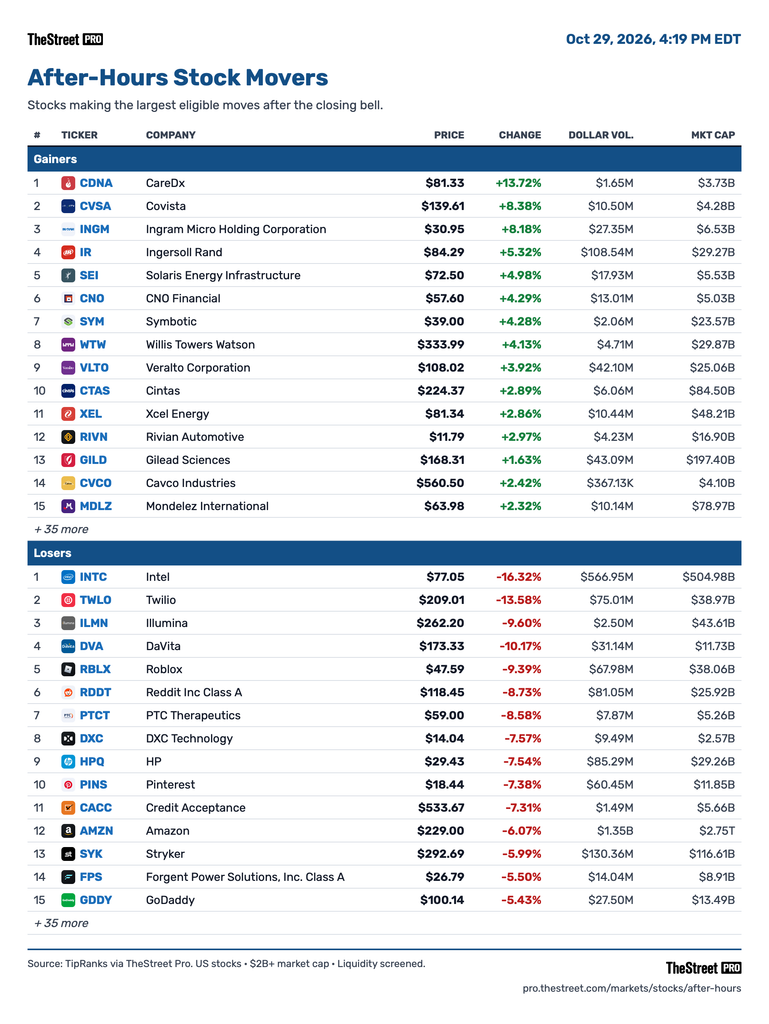
Over 400 of the S&P 500’s components were higher even as the index ended lower and the Russell 2000 gained for a fourth day while Amazon and Intel dropped after hours
With tech stock earnings disappointing investors, does this mean that we’ll see a change in sentiment? Plus, three new ideas from me.
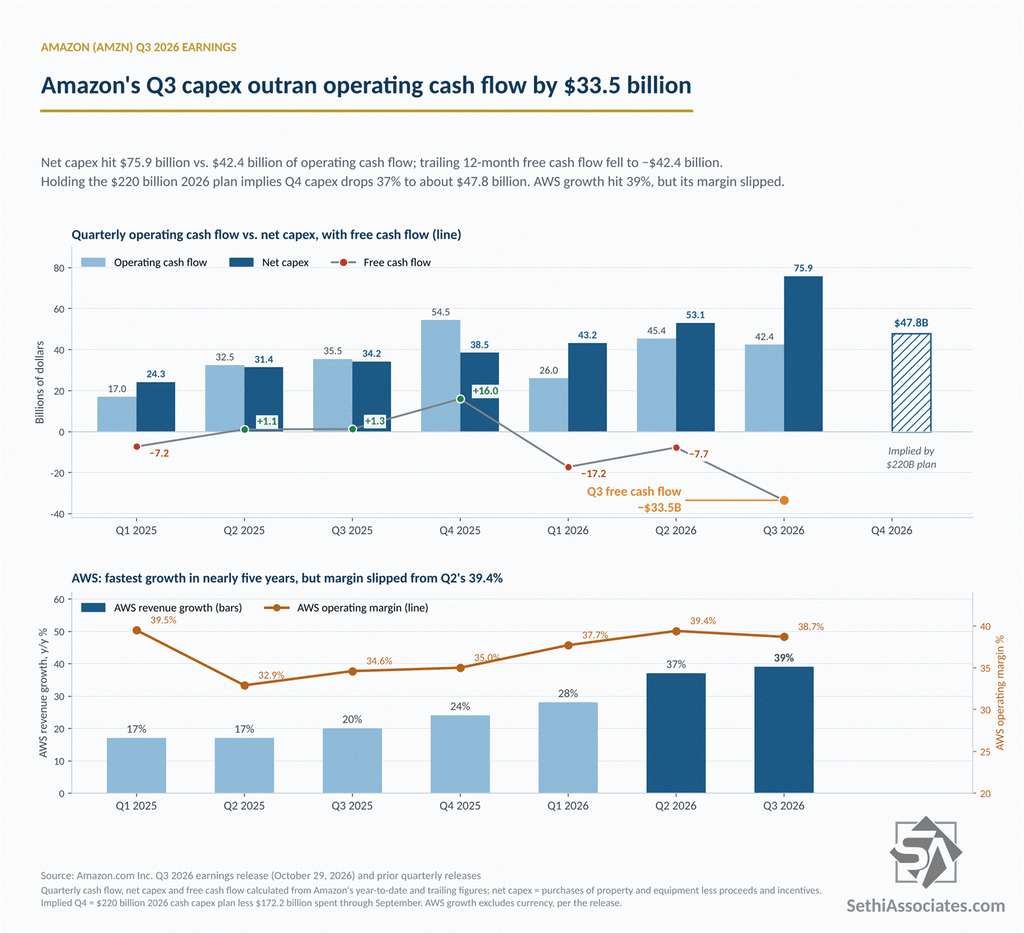
Amazon ($AMZN) shares are down by nearly 6% after hours after the company missed on both the top and bottom lines, per TipRanks, even as Amazon Web Services posted its fastest growth in nearly five years. The bigger story is cash: Amazon spent $75.9 billion on capital expenditures, net of proceeds and incentives, in the third quarter against $42.4 billion of operating cash flow, a $33.5 billion quarterly cash burn.1 The stock had already fallen in the regular session to close at $243.79, per Bloomberg.
Net sales rose 12% (13% excluding currency) to $201.9 billion, per Amazon’s earnings release, just under the top of the company’s $197 billion to $202 billion guidance range and short of the $202.31 billion consensus cited by TipRanks.
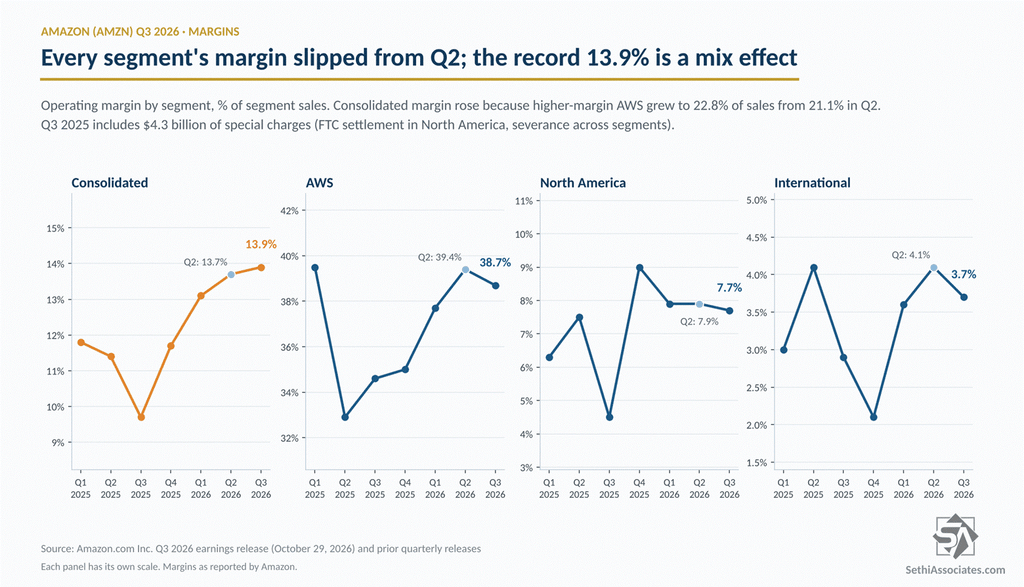
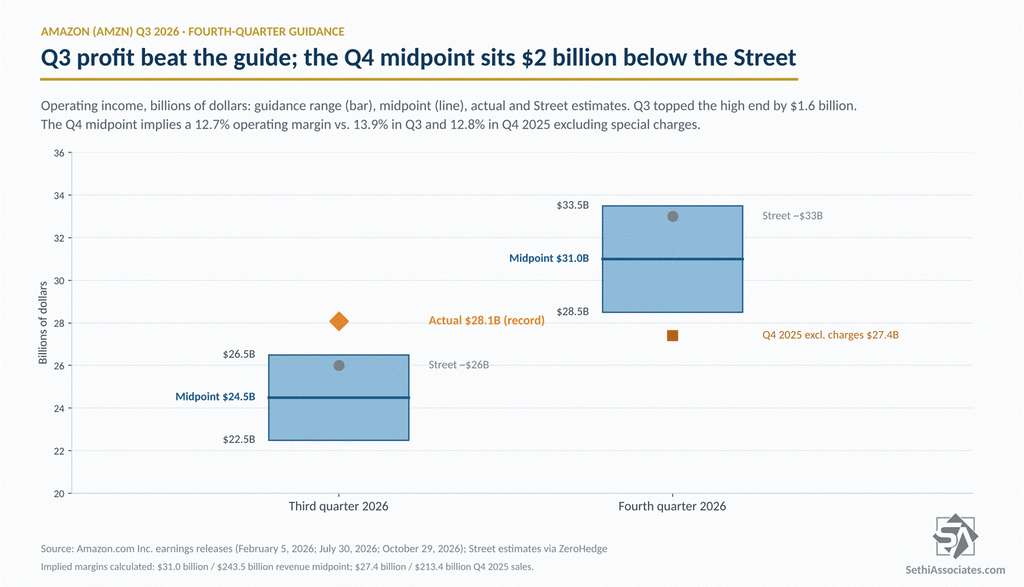
The miss on earnings was despite record operating income of $28.1 billion, a 13.9% margin that Amazon called its highest ever. That cleared the top of the $22.5 billion to $26.5 billion guidance range by $1.6 billion and beat the roughly $26 billion Street estimate, though it only matched the roughly $28 billion buyside whisper, per ZeroHedge.
That said the 61% year-over-year jump in operating income overstates the improvement. The year-ago quarter carried a $2.5 billion charge for the FTC settlement and $1.8 billion of severance, per Amazon’s third-quarter 2025 release. Against that quarter’s $21.7 billion figure excluding charges, operating income rose 29%.4 North America’s 82% gain shrinks to 19% against its $7.3 billion figure excluding the FTC charge.4
Earnings per share of $1.89 missed the $1.96 consensus, per TipRanks. The EPS miss came below the operating line: non-operating items were a $1.2 billion drag, including a tripling of interest expense to $1.7 billion, which now exceeds Amazon’s $1.2 billion of interest income, and a $703 million loss in other income, versus a $10.7 billion gain a year earlier when Amazon booked $9.5 billion of pre-tax gains on its Anthropic stake.
AWS accounted for 59.6% of the $21.8 billion year-over-year revenue increase, with North America contributing 30.2% and International 10.2%.2 AWS rose to 22.8% of total sales from 18.3% a year earlier, while North America fell to 55.9% from 59.0% and International to 21.3% from 22.7%.2 Excluding AWS, revenue grew 6.0%.2
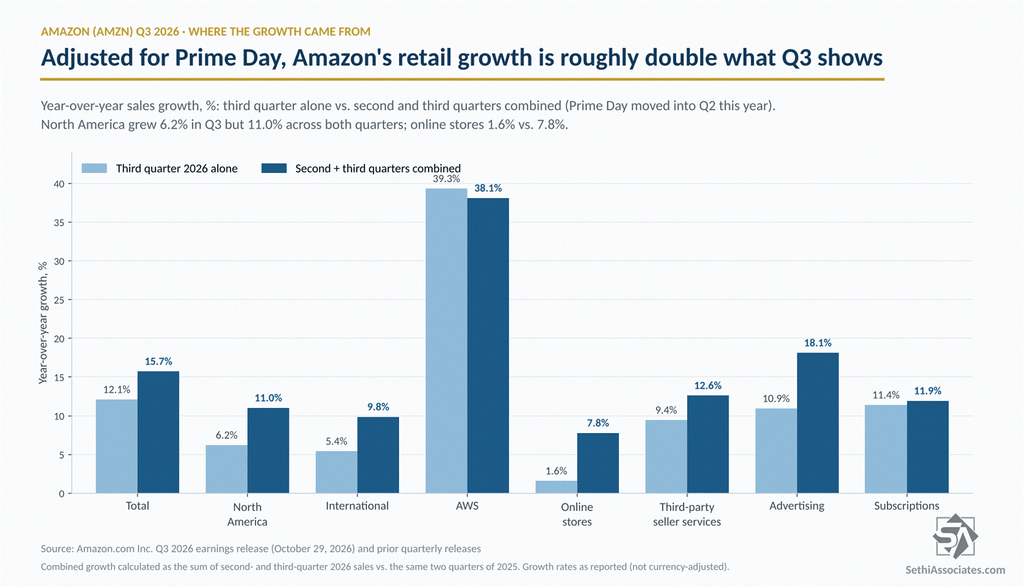
The Prime Day shift distorts the year-over-year comparison. Amazon held Prime Day in the second quarter in most large countries this year, versus entirely in the third quarter in 2025, and said third-quarter growth would have been about 400 basis points higher without the shift. Combining the second and third quarters to wash out the timing, total revenue rose 15.7%, North America 11.0%, International 9.8% and AWS 38.1%.3 Adjusted for Prime Day, the retail business is growing closer to 11% than 6%.3
Sequentially, all three segment margins slipped: AWS to 38.7% from 39.4%, North America to 7.7% from 7.9% and International to 3.7% from 4.1%. Operating margin outside AWS was 6.6%, down from 6.8% in the second quarter but up from 4.1% a year ago.2 The record consolidated margin is a mix effect: it edged up because higher-margin AWS rose to 22.8% of sales from 21.1% in the second quarter.2
AWS revenue rose 39.3% to $46.0 billion, beating the $45.29 billion consensus, per TipRanks, and accelerating from 37% in the second quarter. It still fell short of the roughly 42% the buyside was looking for, per ZeroHedge. AWS operating income rose 55% to $17.8 billion, and CEO Andy Jassy said Amazon is projecting AWS “revenue growth rates of over 40% both in 2027 and in 2028.”
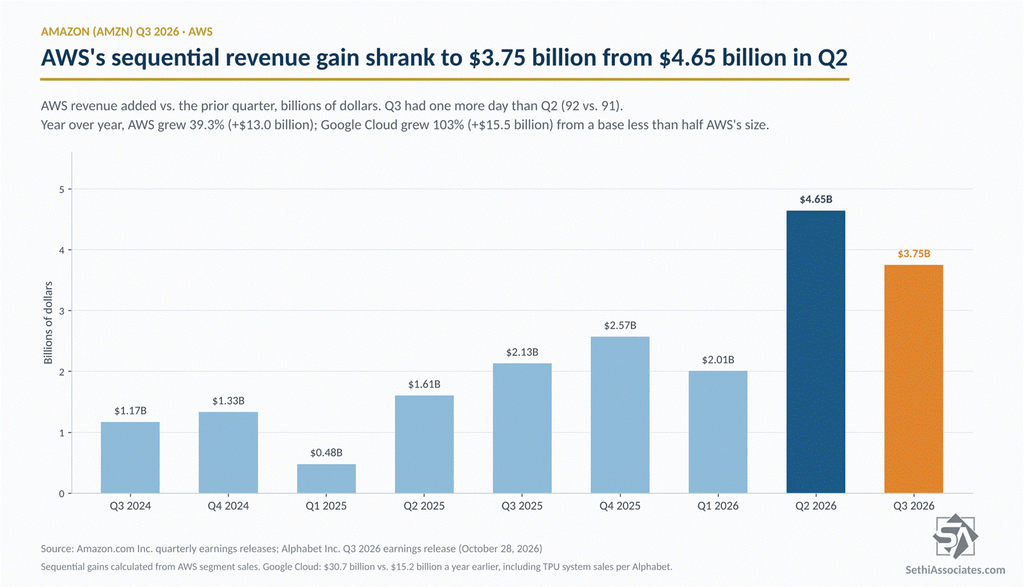
Two numbers look weaker under the beat. AWS added $3.75 billion of revenue sequentially, down from $4.65 billion in the second quarter, despite the third quarter having one more day.5 And its operating margin slipped 0.7 percentage point to 38.7%, against a buyside hoping for the low 40s, per ZeroHedge citing UBS.
For comparison, Microsoft’s ($MSFT) Azure grew 48% and Alphabet’s ($GOOGL) Google Cloud grew 103% to $30.7 billion, per Alphabet’s release, a figure that includes TPU system sales. Google Cloud added about $15.5 billion of revenue year over year, more than AWS’s $13.0 billion, from a base less than half the size.6
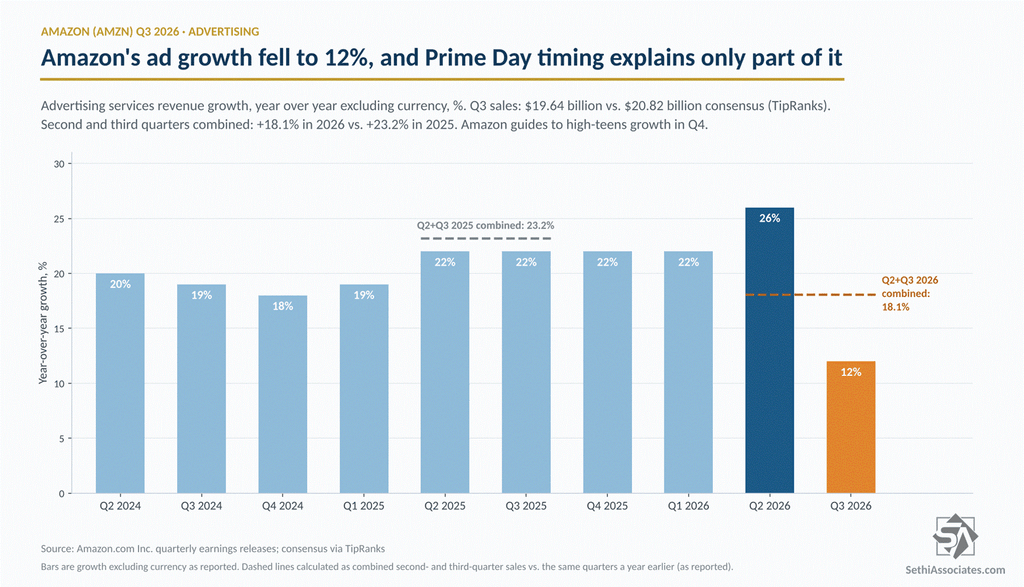
Advertising revenue rose 11% (12% excluding currency) to $19.64 billion, missing the $20.82 billion consensus by 5.7%, per TipRanks, and slowing from 26% growth in the second quarter.7 Amazon blamed “timing anomalies primarily related to Prime Day” and guided to high-teens growth in the fourth quarter. Even washing out Prime Day, advertising grew 18.1% across the second and third quarters, down from 23.2% over the same stretch of 2025.3
Online stores sales rose 1.6% (2% excluding currency) to $68.5 billion, below the $69.68 billion FactSet estimate cited by MarketWatch, while third-party seller services grew 9%. North America sales rose 6% to $112.9 billion, also below the $113.2 billion forecast, per MarketWatch.
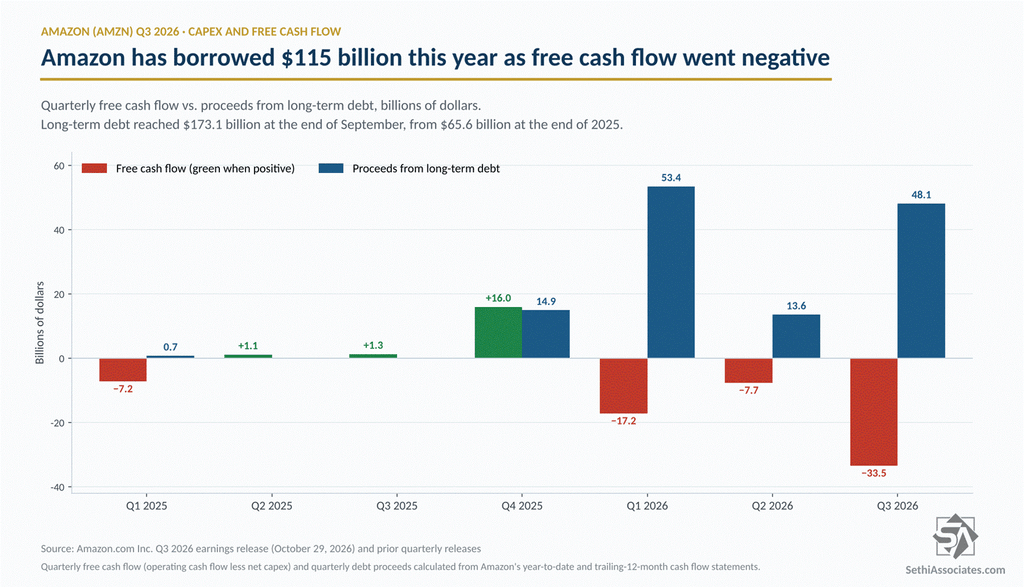
Purchases of property and equipment were $77.3 billion in the quarter, or $75.9 billion net of proceeds and incentives, far above analyst estimates, per Bloomberg. Net capex rose 43% from $53.1 billion in the second quarter and more than doubled from $34.2 billion a year earlier.1
That left a free cash outflow of $33.5 billion for the quarter,1 versus the $7.7 billion outflow Bloomberg consensus expected, per ZeroHedge. On the trailing 12-month basis Amazon reports, free cash flow fell to an outflow of $42.4 billion from an outflow of $7.6 billion in the second quarter and an inflow of $14.8 billion a year earlier.
Amazon said it continues to expect about $220 billion of 2026 cash capex. With $172.2 billion already spent through September, that implies about $47.8 billion in the fourth quarter, 37% below the third quarter.1 So either fourth-quarter capex falls 37% from the third quarter even as Amazon says demand still exceeds supply, or the $220 billion plan gets exceeded. Amazon gave no 2027 figure; Evercore ISI forecasts $320 billion, per MarketWatch. Cash capex also leaves out $26.8 billion of property and equipment acquired but not yet paid for over the trailing 12 months, plus $4.5 billion acquired under finance leases.
Debt is funding the gap. Amazon raised $48.1 billion of long-term debt in the quarter and $115.1 billion year to date, lifting long-term debt to $173.1 billion from $65.6 billion at the end of 2025. Cash and equivalents fell to $55.8 billion from $86.8 billion, though including marketable securities, liquidity fell a more modest $8.8 billion to $114.2 billion.
Amazon guided fourth-quarter net sales to $240 billion to $247 billion, up 12% to 16%, including about 60 basis points of currency drag. The $243.5 billion midpoint is just below the $244.17 billion FactSet consensus cited by MarketWatch.
Operating income guidance of $28.5 billion to $33.5 billion has a $31.0 billion midpoint, below the roughly $33 billion Street estimate, per ZeroHedge. The midpoint implies a 12.7% operating margin, below the third quarter’s 13.9% and roughly flat with the 12.8% of last year’s fourth quarter excluding special charges.8 Against last year’s $27.4 billion fourth-quarter figure excluding charges, per Amazon’s fourth-quarter 2025 release, the midpoint is up 13%.8
Despite the misses, TipRanks shows a Strong Buy consensus among 44 analysts, with an average price target of $331.54.
1 Calculated from Amazon’s cash flow statements. Net capex is purchases of property and equipment ($77.26 billion in the third quarter; $54.21 billion in the second) less proceeds from sales and incentives ($1.38 billion; $1.13 billion). Quarterly free cash flow is operating cash flow ($42.42 billion) less net capex ($75.88 billion). Implied fourth-quarter capex is $220 billion less nine-month net capex of $172.19 billion.
2 Calculated from Amazon’s segment information.
3 Calculated as combined second- and third-quarter sales versus the same two quarters a year earlier (2025 versus 2024 for the advertising comparison).
4 Calculated using the figures excluding charges in Amazon’s third-quarter 2025 release.
5 Calculated from AWS segment sales: $45.98 billion in the third quarter, $42.23 billion in the second and $37.59 billion in the first.
6 Calculated: Google Cloud revenue of $30.7 billion versus $15.2 billion a year earlier; AWS $45.98 billion versus $33.01 billion.
7 Calculated: $19.64 billion actual versus $20.82 billion consensus.
8 Calculated: $31.0 billion divided by the $243.5 billion revenue midpoint; $27.4 billion divided by $213.4 billion fourth-quarter 2025 sales.
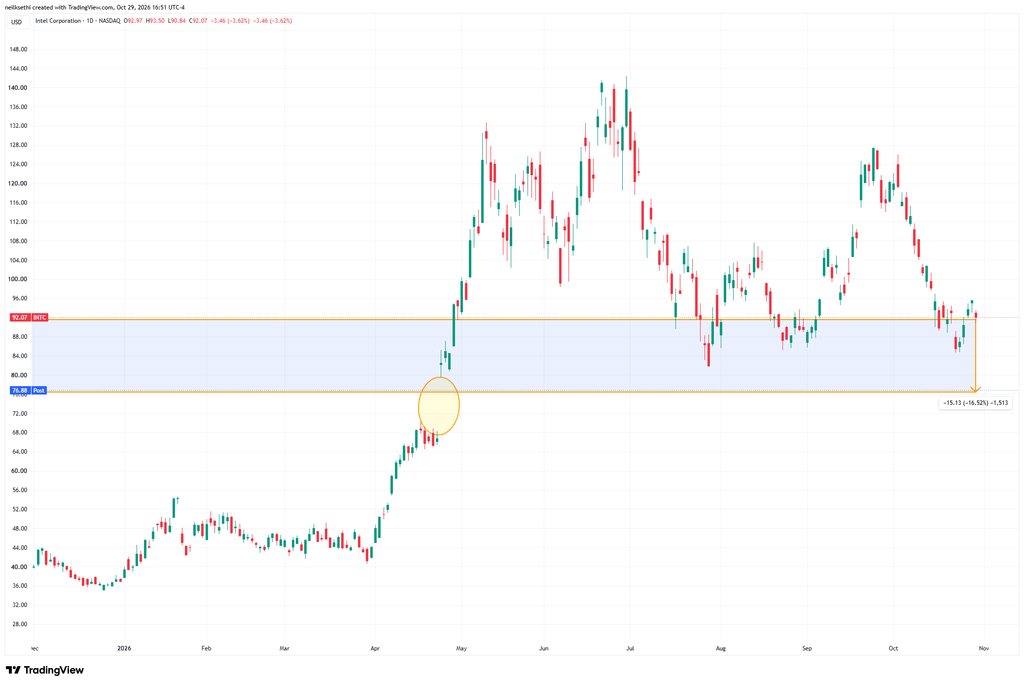
Intel ($INTC) shares are down over 16% after hours Thursday after the chipmaker forecast fourth-quarter revenue and profit well below Wall Street estimates, blaming a deepening PC slump and supply problems, even as its data center business posted its fastest growth in 15 years.
Notably, this would put Intel into a gap formed from its April earnings which extends down another 8% from where it was trading as of 4.50 p.m. ET.
Third-quarter adjusted EPS of 52 cents beat the TipRanks consensus of 41 cents. Revenue rose 21% to $16.51 billion, a hair below TipRanks’ $16.56 billion estimate, Intel said in its earnings release.
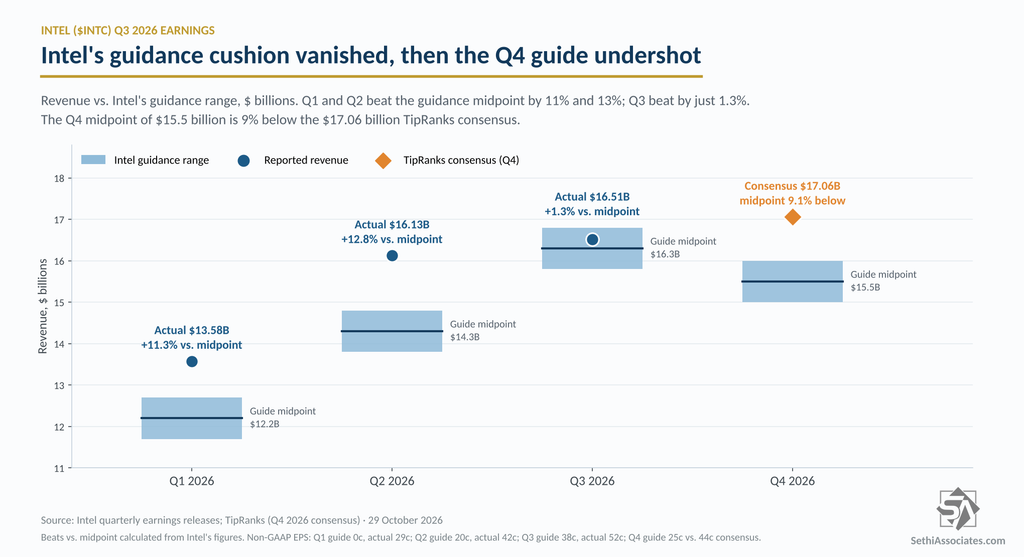
Intel topped its own targets though. In July, it guided third-quarter revenue to $15.8 billion to $16.8 billion, adjusted EPS to 38 cents and a 42.0% non-GAAP gross margin. Revenue landed $213 million above the midpoint, EPS beat that guide by 14 cents and gross margin came in at 44.1%.1
Non-GAAP gross margin rose 4.1 percentage points from a year earlier and 2.3 points from the second quarter. Non-GAAP operating margin climbed to 19.6% from 11.2% a year ago and 17.2% last quarter.
Per-share growth lagged profit growth. Adjusted net income jumped 169% to $2.76 billion, but adjusted EPS rose 126% because the diluted share count grew 17% to 5.31 billion after this year’s equity raises.1 GAAP EPS of 60 cents included a $1.0 billion gain on the mark-to-market of shares held in escrow for the U.S. government, worth 17 cents a share, which Intel excludes from adjusted results.
Data center and AI accounted for 112% of Intel’s $2.86 billion year-over-year revenue increase; excluding it, sales fell 3.6%.1
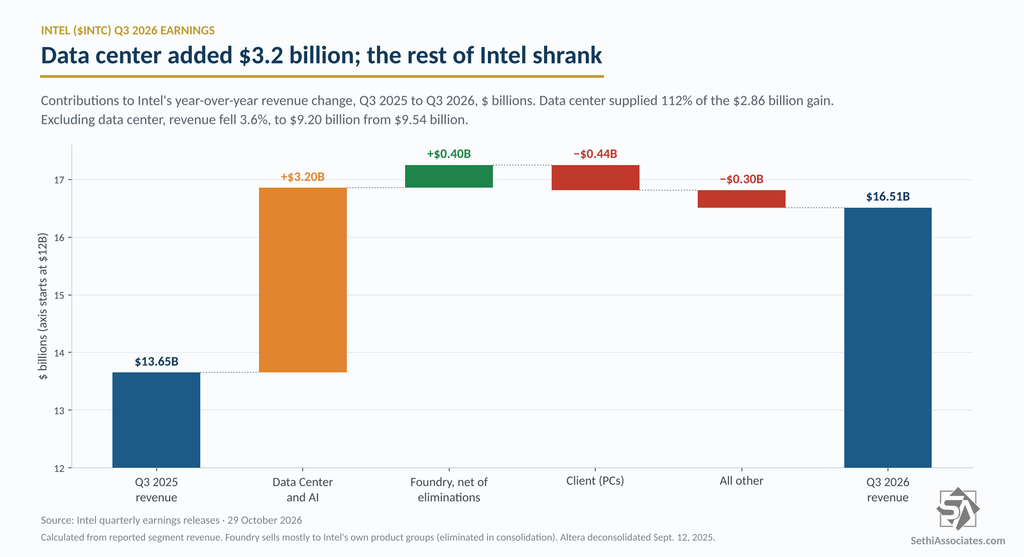
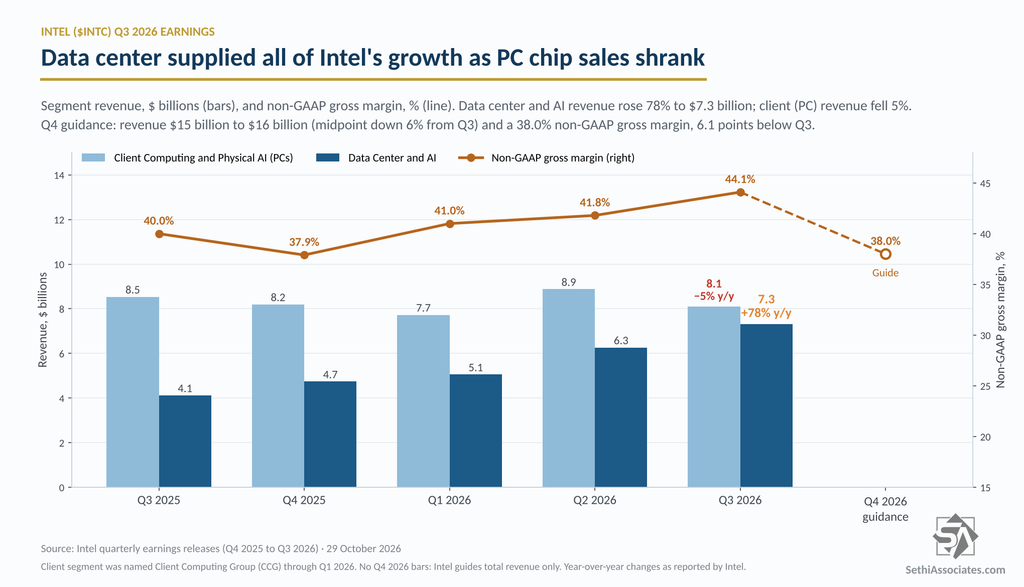
The segment’s revenue rose 78% to $7.3 billion, well above the $6.7 billion analysts expected, MarketWatch reported, and rose 17% from the second quarter. Its operating margin widened to 41.5% from 23.4% a year ago, and about 65 cents of each extra revenue dollar fell to operating income.1 Data center operating income of $3.04 billion topped the client unit’s $2.29 billion for a second straight quarter.
Client Computing and Physical AI, the PC chip unit, fell 5% to $8.1 billion, short of the $8.9 billion FactSet consensus cited by MarketWatch, and dropped 9% from the second quarter. Its operating margin slipped to 28.2% from 31.6%.1
The mix shift is stark. Data center now makes up 47.5% of Intel Products revenue, up from 32.5% a year ago and 41.4% last quarter.1
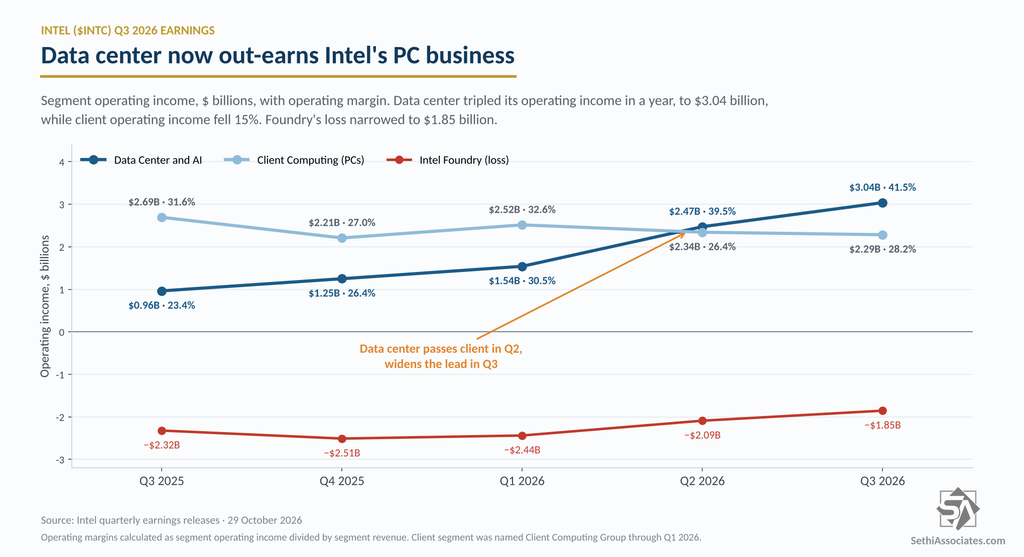
Intel Foundry revenue jumped 58% to $6.7 billion, ahead of the $6.4 billion consensus, per MarketWatch. Most of that is chips made for Intel’s own product groups and is eliminated in consolidation. The foundry operating loss narrowed to $1.85 billion from $2.32 billion a year earlier, cutting its loss margin to 27.7% from 54.8%.1 “All other” revenue fell 30%, partly because Intel deconsolidated Altera on Sept. 12, 2025.
The $15.5 billion midpoint of Intel’s fourth-quarter revenue guide is $1.56 billion, or 9%, below the TipRanks consensus, and its 25-cent EPS guide is 43% below.1
Intel guided revenue to $15 billion to $16 billion, against $17.06 billion expected, and adjusted EPS to 25 cents, versus 44 cents, TipRanks reported. The midpoint implies a 6% sequential decline and slows year-over-year growth to about 13% from 21%.1
Margins take a bigger hit. Intel guided a 38.0% non-GAAP gross margin, 6.1 points below the third quarter’s 44.1%. On a GAAP basis, the guide is 37.1%, which is why some outlets reported 37% and others 38%.
Intel blamed a PC market squeezed by soaring memory prices. CFO David Zinsner said in the release that the PC slowdown will last “at least through the first half of next year.” Intel expects the PC market to shrink 10% in 2027 after a 12% drop in 2026, Bloomberg reported. CEO Lip-Bu Tan told Bloomberg data center sales would have been higher without raw-material shortages and a factory shutdown in Israel. Intel investor relations chief John Pitzer told MarketWatch an explosion at the Israel plant earlier this month weighed on the outlook.
Inventory rose 4.6% from the second quarter to $13.1 billion, and 12.5% since year-end, while client revenue fell.1 Work-in-process inventory, at $8.8 billion, accounts for most of it. Intel says it is building working capital to increase supply, but rising inventory into a PC downturn is worth watching.
The client miss came from the bigger of Intel’s two product businesses. A segment analysts expected to grow 5% shrank 5%, and the fourth-quarter guide suggests the decline deepens.
Operating cash flow was $5.1 billion. Gross capital spending rose to $4.2 billion from $3.0 billion a year earlier, and adjusted free cash flow was $1.64 billion, up from $0.9 billion. Year-to-date gross capex totals $11.8 billion.1 Intel has pledged to spend $20 billion in 2026, the FT reported. If that refers to gross capex, it implies about $8.2 billion in the fourth quarter.1
The $23 billion equity offering completed in the quarter transformed the balance sheet. Cash and short-term investments reached $54.0 billion against $50.1 billion of total debt, a net cash position of $3.9 billion, compared with net debt of $9.2 billion at the end of 2025.1
The AI demand story for Intel held up this quarter, and the data center business is now Intel’s profit engine. But the stock had priced in a smoother transition. Expectations were high with shares up more than 140% this year coming into the print despite a more than 20% drop over the past month, per the FT. A guide that cuts revenue, margins and EPS at once, blamed on PCs, memory costs and a fab disruption, breaks that narrative for at least a quarter. Before the report, analysts’ average price target of $114.23 implied 24.1% upside, per TipRanks.
1 Calculated from figures in Intel’s third-quarter 2026 earnings release and, for prior-quarter and guidance comparisons, its second-quarter 2026 release. Segment contributions to the year-over-year increase use reported segment revenue; Intel Foundry net of intersegment eliminations added $398 million (14%), client subtracted $438 million and “all other” subtracted $301 million. Segment operating margins equal segment operating income divided by segment revenue. Net cash equals cash, cash equivalents and short-term investments minus short- and long-term debt. Consensus figures are from TipRanks unless noted; FactSet figures are via MarketWatch.
Investors that have grown use to beat-and-raise quarters are selling first and asking questions later.
Volume and VIX
– NYSE volume 7% above its one-month average
– NASDAQ volume 9% below its one-month average
– VIX index: up 1.48% to 17.16
Closing Breadth
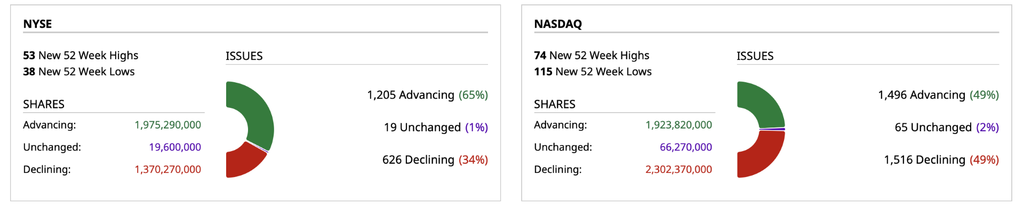
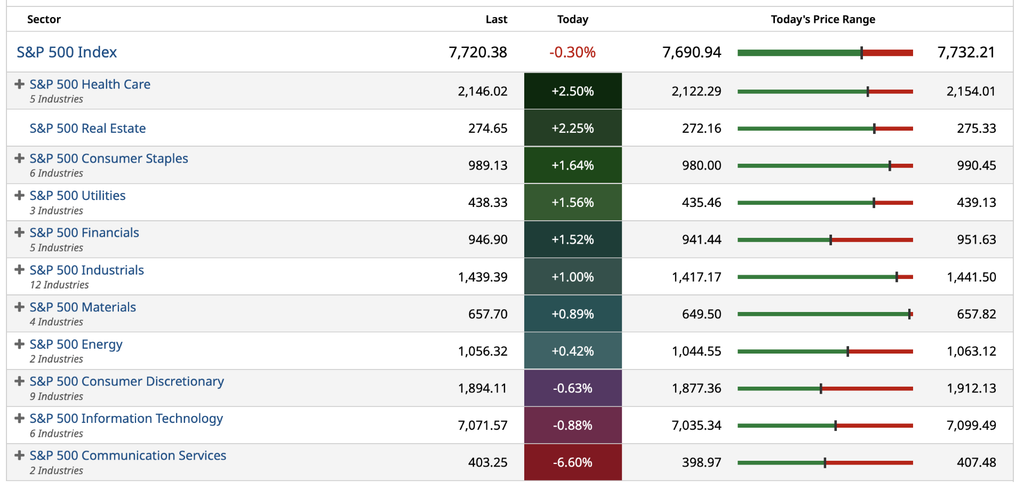
Sectors
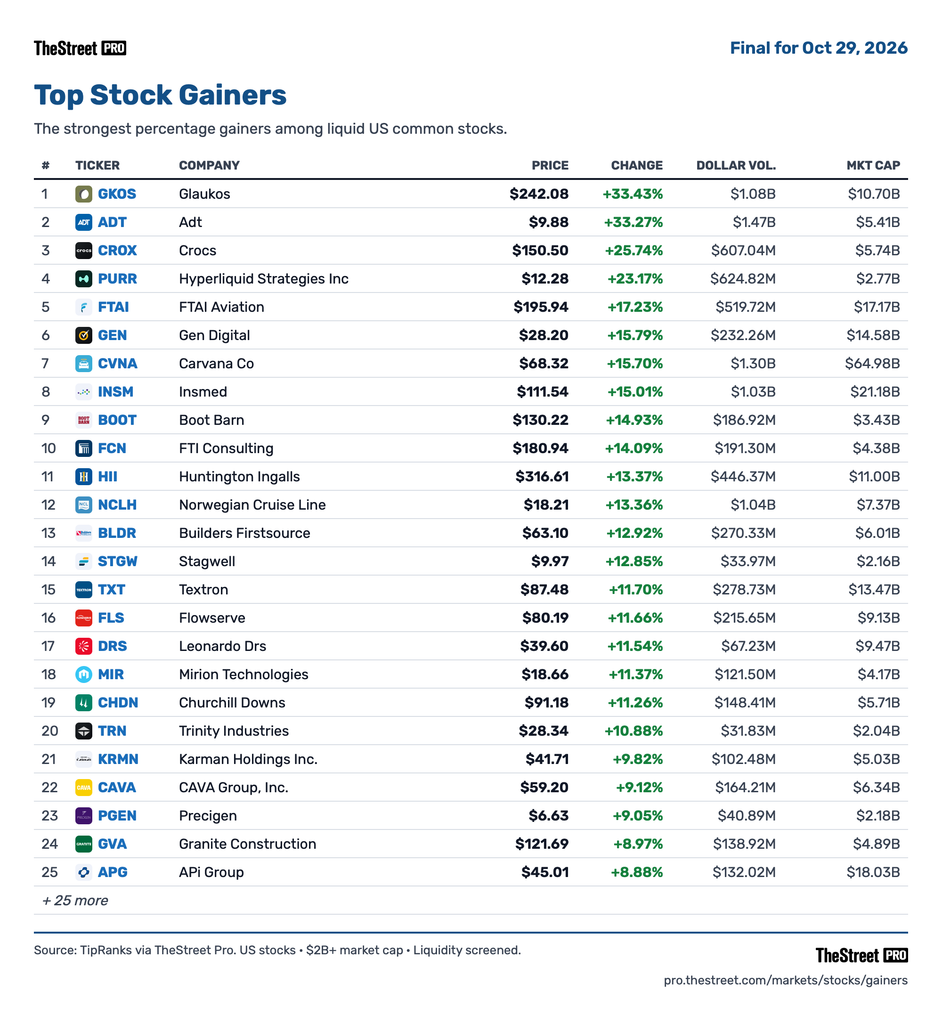
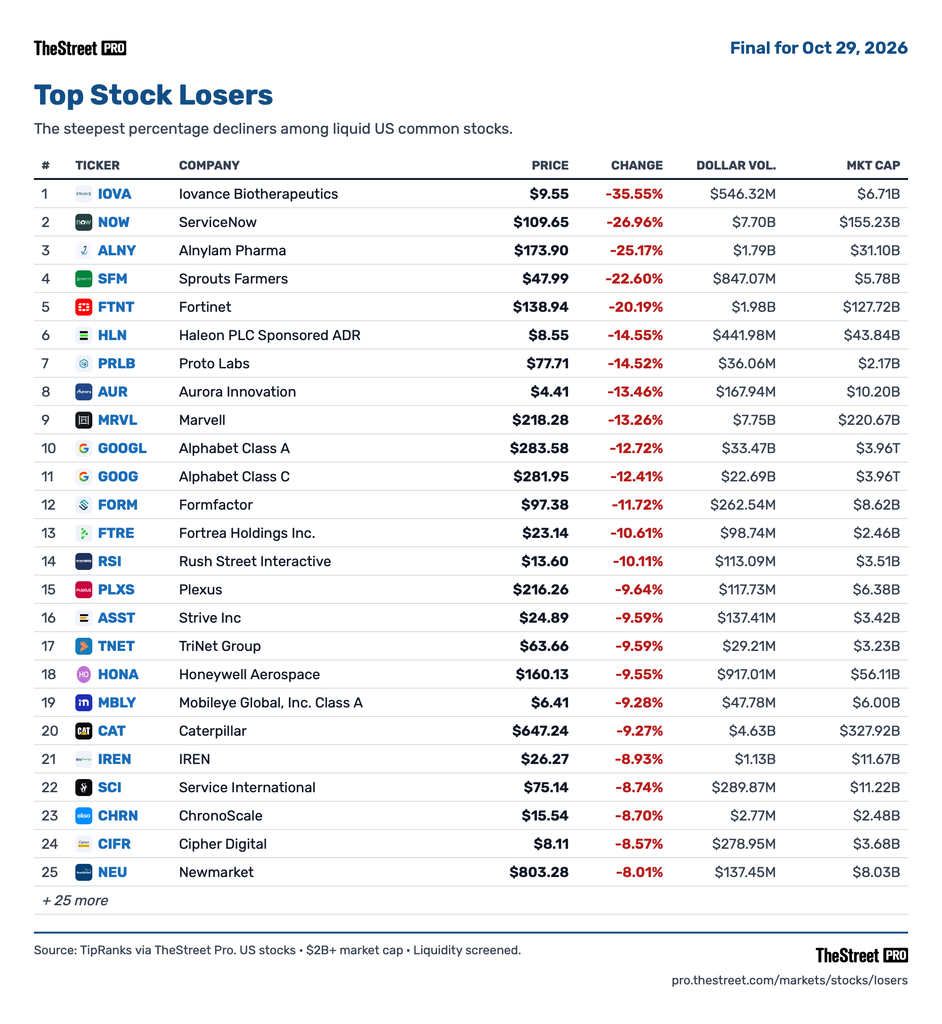
Gainers/Decliners
Nasdaq 100 Heat Map
S&P 500 Heat Map
Position: None
Position: None
I won’t mince words.
If you all don’t now understand my criticism of Fin TV and their absence of analytical rigor/process and self-confident recommendations (among other faults), you might reconsider your view after this week’s earnings surprises.
Position: None
Wolf Street howls about the U.S. economy running hot.
Economy Is Running Hot on Strong Consumer Spending Growth & Massive AI Investment Boom | Wolf Street
Position: None