Tech Sector Is Officially Oversold


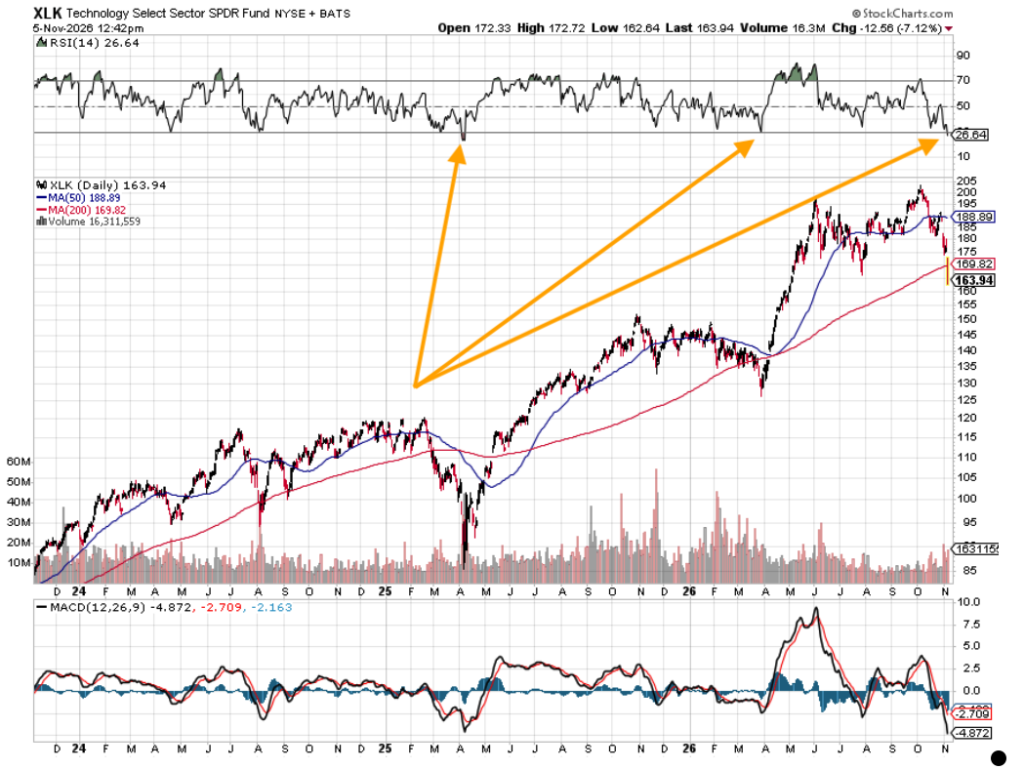
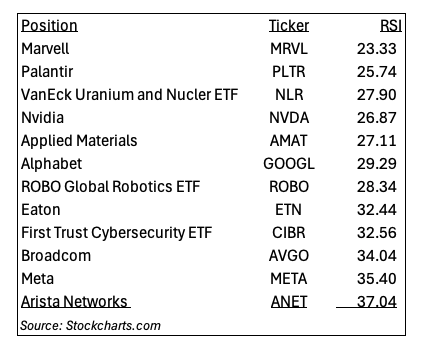
The net result of the Portfolio’s moves over the last two days lifted the Portfolio’s cash position back over 10%. While we’ve made a few additions to the Bullpen, the carnage we are seeing rip through the market has us taking stock of several existing positions that have fallen awfully far, pretty fast due to arguably short-term thinking. As we can see below in the chart, that has pulled the Technology Select Sector SPDR Fund ($XLK) into an oversold condition, and along with it several Portfolio holdings.
However, as we saw with Arm’s ($ARM) quarterly results that were rather good, and we’d toss the beat-and-raise report from Coherent ($COHR) into that camp, the market is not listening.
At least not yet.
But as we discussed on Wednesday, past a certain point we will see the market mood start to shift from extreme skepticism to one that is more valuation and value based relative to opportunities ahead.
That means now is the time for us to do a fresh round of homework, re-connect the dots and, like we did on Wednesday, ask key questions.
What’s interesting to note is the current oversold status of XLK shares, especially given that they did not reach such a condition during the larger market drop in March 2026. In the chart above, we can see it came close… but it didn’t land in one. That’s another reason to think that the rout weighing on the tech sector is overdone. Looking back then, is a reminder that expectation setting can be painful, but focusing on the medium- to longer-term makes the difference.
At the opposite end of the spectrum, and also in quick fashion, other parts of the market have become overbought. The quick fashion in which this happened is another reason to think this is an extreme and short-term move.
Will it be hard to bottom-tick the pullback in the Tech sector? It sure won’t be easy, and odds are the combination of hedge funds over levered to the tech sector as well as adoption of single-stock ETFs, and levered ones, will make it even more of a challenge.
But that’s why we’re doing the work now, so we can be ready to move as footing is found. It also has us keeping close tabs on key support levels, checking to see if they hold. For example, with Palantir ($PLTR) shares that is the 200-day moving average at $153.56 on the daily chart. With Nvidia ($NVDA) shares, it looks to be $174.42 or the 100-day moving average on the weekly chart.
Odds are when we make a move, we’ll still want to be prudent, which means doing so in one, two or maybe even three rounds of smaller bites.
More Pro Portfolio
- Increasing Exposure to This Chip Name as Shortage Endures
- Tracking 49 Signals Across 11 Portfolio Investment Themes
- October Monthly Roundup: Navigating the Tech Pullback. What We Bought and Our Shopping List.
At the time of publication, TheStreet Pro Portfolio was long MRVL, PLTR, NLR, NVDA, AMAT, GOOGL, ROBO, ETN, CIBR, AVGO, META and ANET.
