SpaceX Rocks Telecom. Here’s My Play on Tower Stocks and the Big 3

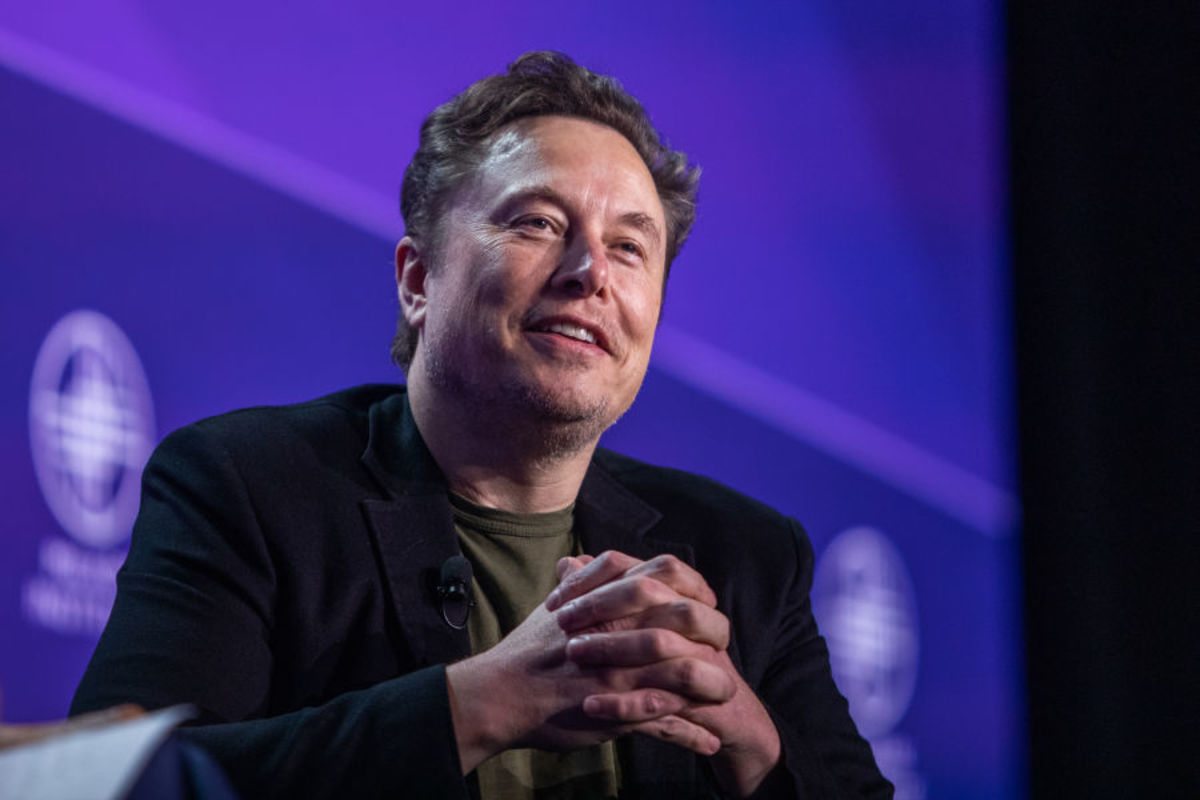
Elon Musk’s latest move could signal the future of telecom. Here’s how I’m trading the initial reaction.
Elon Musk’s latest move could signal the future of telecom. Here’s how I’m trading the initial reaction.
Market participants continue to be resistant and are growing increasingly impatient in their perception of the procedural delays in the rescheduling of cannabis.
By contrast I am using the weakness to further accumulate names in the space as the inevitability (at least to me) of rescheduling to Schedule III and an end date to Schedule I grow clearer. With that rescheduling will likely come more uplistings (and eligibility in index funds), an easing of custodian restrictions and remedy and clarification of UTP treatment (with some retroactive suspension of liabilities and lengthening in tax obligation payouts).
This could lead to a meaningful change in the ownership of cannabis equities from retail to institutional (and index funds) — that has yet to begin.
I suppose this selling was inevitable given the recency bias related to the dramatic decline in share prices over the last five years and the persistent regulatory disappointments — both of which are etched in traders’ and investors’ memories. (It doesn’t help that the general market has become unstable.)
I remain a buyer.
Position: Long MSOS common (VL) and calls (VS)
In today’s Market Recon, Tech’s Capital Problem, Sarge shared the following quote from Nvidia’s ($NVDA) Jensen Huang:
“If you look at the fundamentals, the demand for the neoclouds is off the charts.” Huang paused and then he added, “What is missing in the middle is the working capital to fuel that growth… because there’s just so much demand across so many sectors of AI, there’s a scarcity of capital.”
Then he said: “The demand of the capital is much greater than the availability of the capital.”
This got me thinking. Yeah, I understand that early-stage ideas need capital to grow. But a business needs customers that are willing to pay a fair market price for the thing they’re buying.
In the case of AI, the demand is there, but paying customers are not. Or, at least, customers willing to pay what the product is believed to be worth.
Yes, these companies are growing fast. But when will people be willing to pay what the services are “worth”?
When the demand comes from investors and not customers, is that the sign of a healthy product? Or has AI gotten ahead of itself?
There are lots of good businesses that would make the world a better place that failed for a lack of “capital.” Or was it a lack of paying customers?
I’m not saying AI will fail. On the contrary. It will succeed because the people with the money will make sure that we can’t live a modern life without it. I guess that’s when we’ll all start paying a fair market value for it.
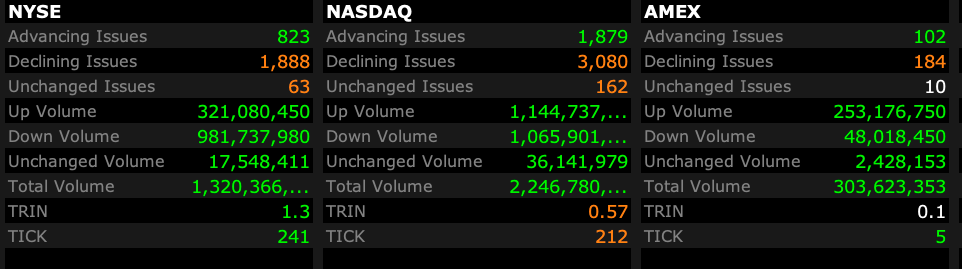
– NYSE volume flat to its one-month average;
– Nasdaq volume 16% below its one-month average;
– VIX index: up 0.79% to 19.18
SOURCE: Interactive Brokers
SOURCE: Interactive Brokers
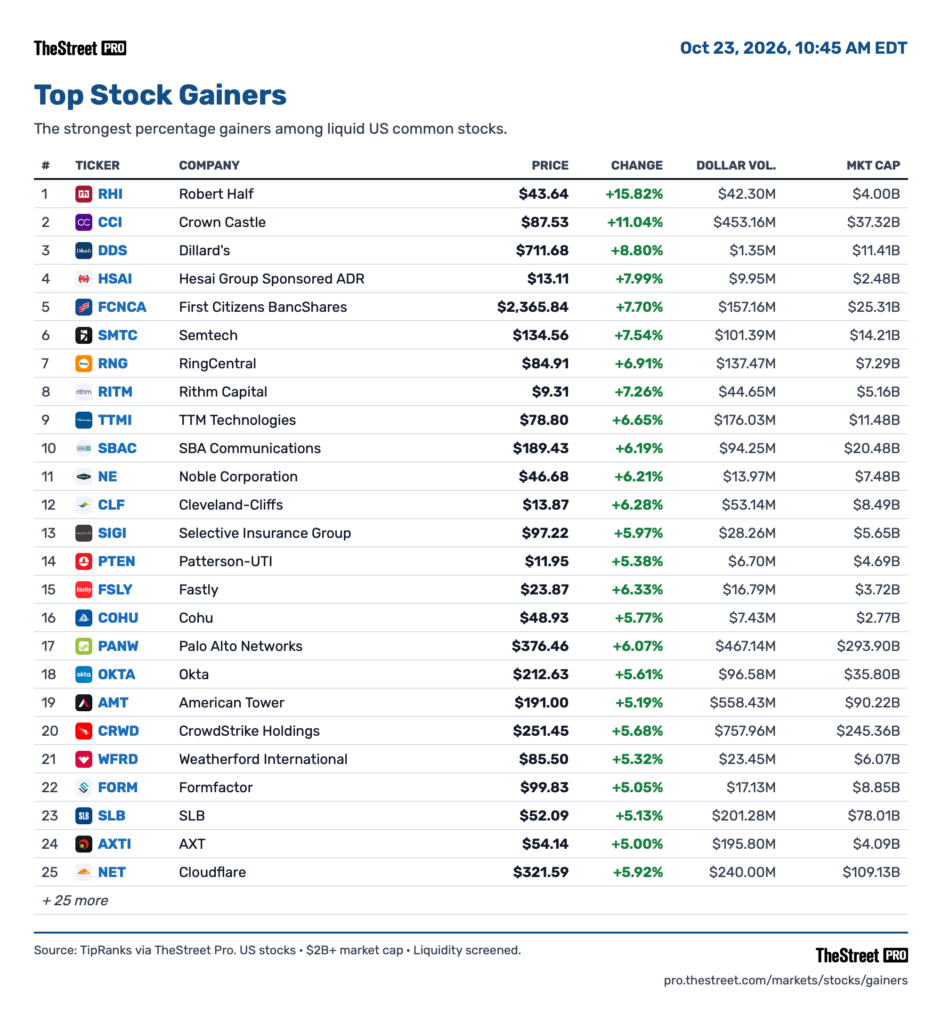
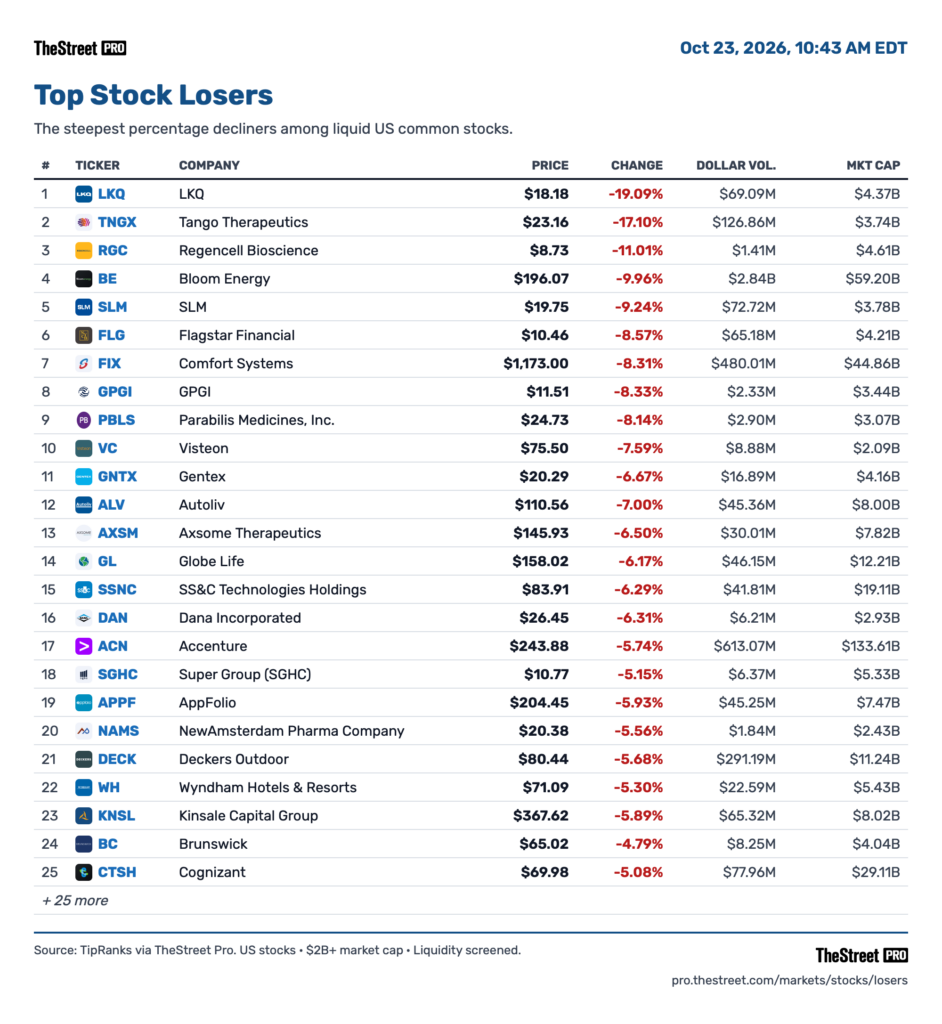
SOURCE: TheStreet Pro
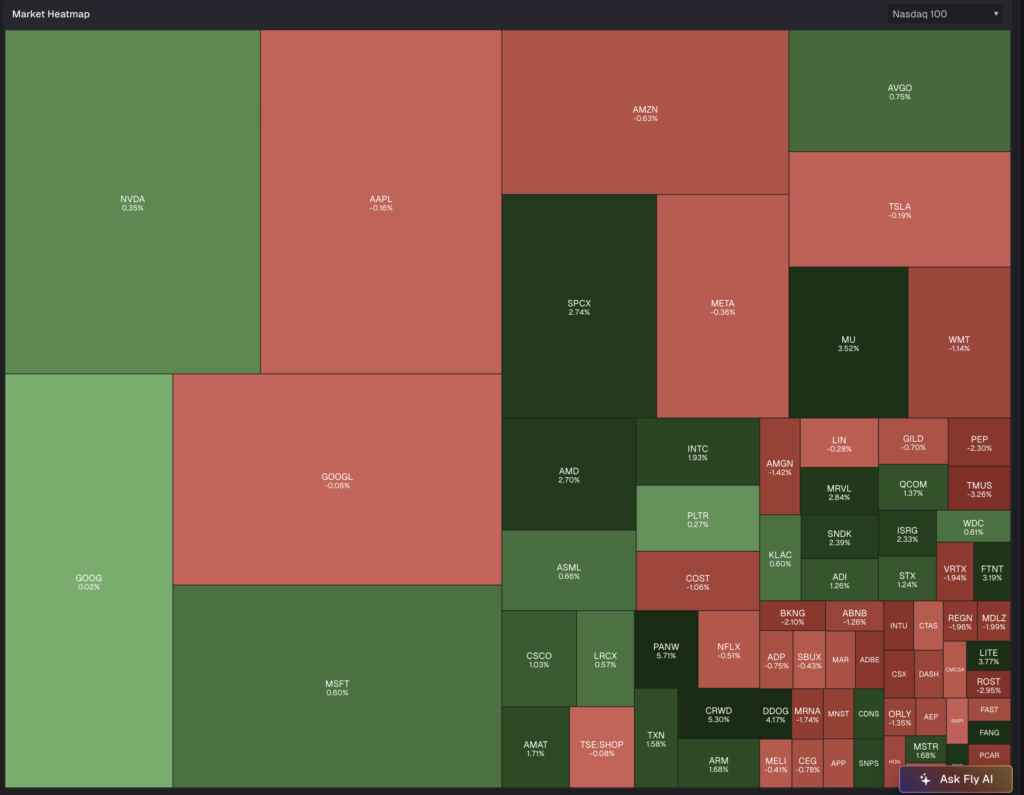
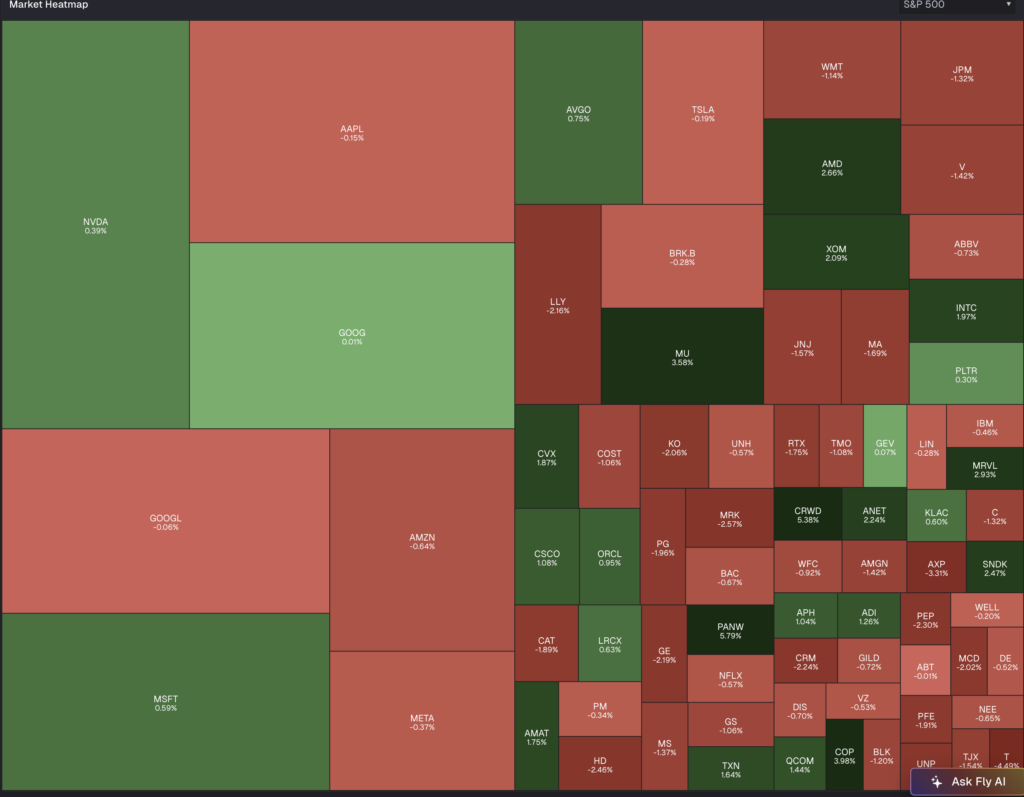
SOURCE TheFly
Is the housing market close to a bottom? Let’s take a look.
Positions: None.
Job creation picked up during the month, leaving the Fed to focus on inflation.
Dougie Kass
3m ago
The tide is going out and now you understand my resentment towards Fin TV.
Look at their favorite stocks – $BABA $UBER $NFLX $SHAK $GEV $CAT Paramount, $BA, $RDDT the banks/brokers/private equity et al
They are swimming naked.
Memo to retail investors – they will not take ownership of their mistakes, the will continue to smile, they will be confident in view, they will take your assets.
They will cost you money.
Turn off your TVs.
Positions: None
Meta’s 2-for-1 split comes with a catch. Here’s what to know and how I’m playing it.
Post them in the Portfolio Forum, marking them with #OfficeHours.