Boockvar: What a Data Dump

From Peter Boockvar:
The August Philly non-manufacturing index flipped back to negative territory at -10.6 vs +7.4 in July. It’s been below zero for 21 of the last 22 months. As the national figure has been consistently positive, I can’t explain the particular weakness in this region relative to the rest of the country. The Beige Book on the Philly region said this a few weeks ago on two key areas of services, “Retailers, both auto and nonauto, reported mostly steady sales. Tourism, which was boosted by mega events in the region, rose moderately.”
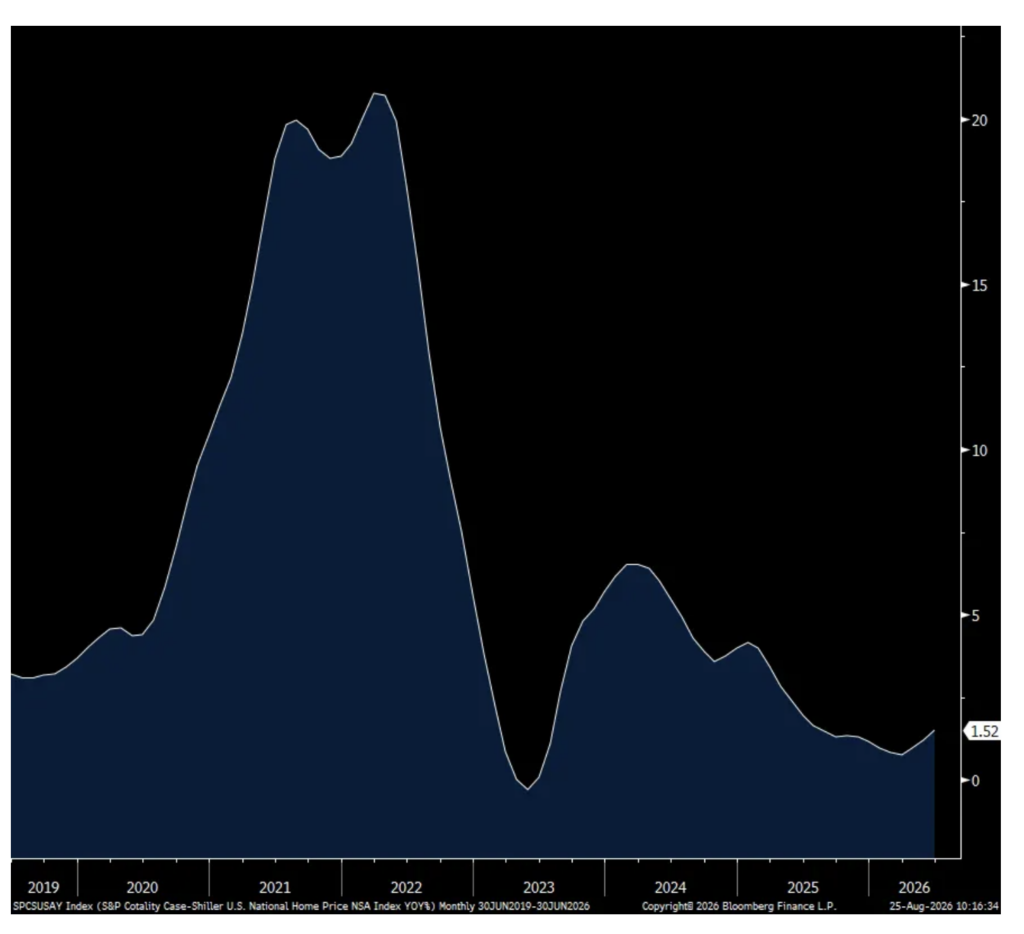
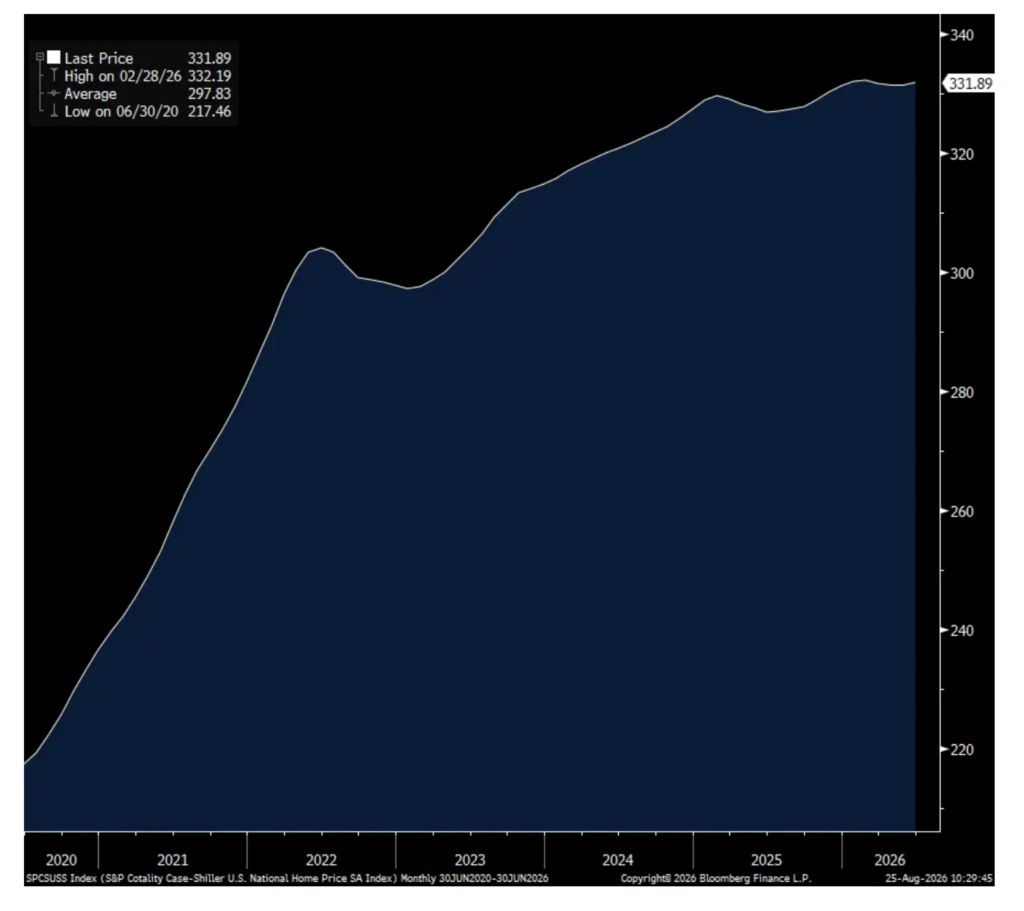
The June (thus somewhat dated) S&P Cotality national home price index showed a 1.5% y/o/y price gain after a 1.2% rise in May. The strongest markets are those with the most limited inventory like Chicago, New York, Cleveland, San Francisco, and Boston. Prices fell in Las Vegas, Seattle, Denver, Tampa, Phoenix, Dallas and Portland. Thus, of the top 20 cities where these mentioned are included, the price situation is pretty bifurcated.
Bottom line, while those who own a home don’t want to see a decline in home prices, I think it is needed in order to improve the affordability picture more dramatically for first time buyers that can in turn trigger more transactions. Also of course a continued rise in wages that quicken faster than the rise in prices can help with affordability. As for relying on lower mortgage rates, I unfortunately don’t expect it.
Fyi, this index is now up 53% over the past six years, thus capturing all the monetary easing during Covid and the tightened that followed.
Also out was the July new home sales figure which totaled 607k annualized, 13k less than expected but June was revised up by 50k to 678k. Smoothing out this volatile data set puts the 3 month average at 638k vs the 6 month average of 641k and which compares with the 12 month average of 664k. For perspective, the average in 2019 when mortgage rates were much lower was 685k but with a US population that was about 17 million person smaller.
S&P Home Price Index y/o/y
S&P Home Price Index
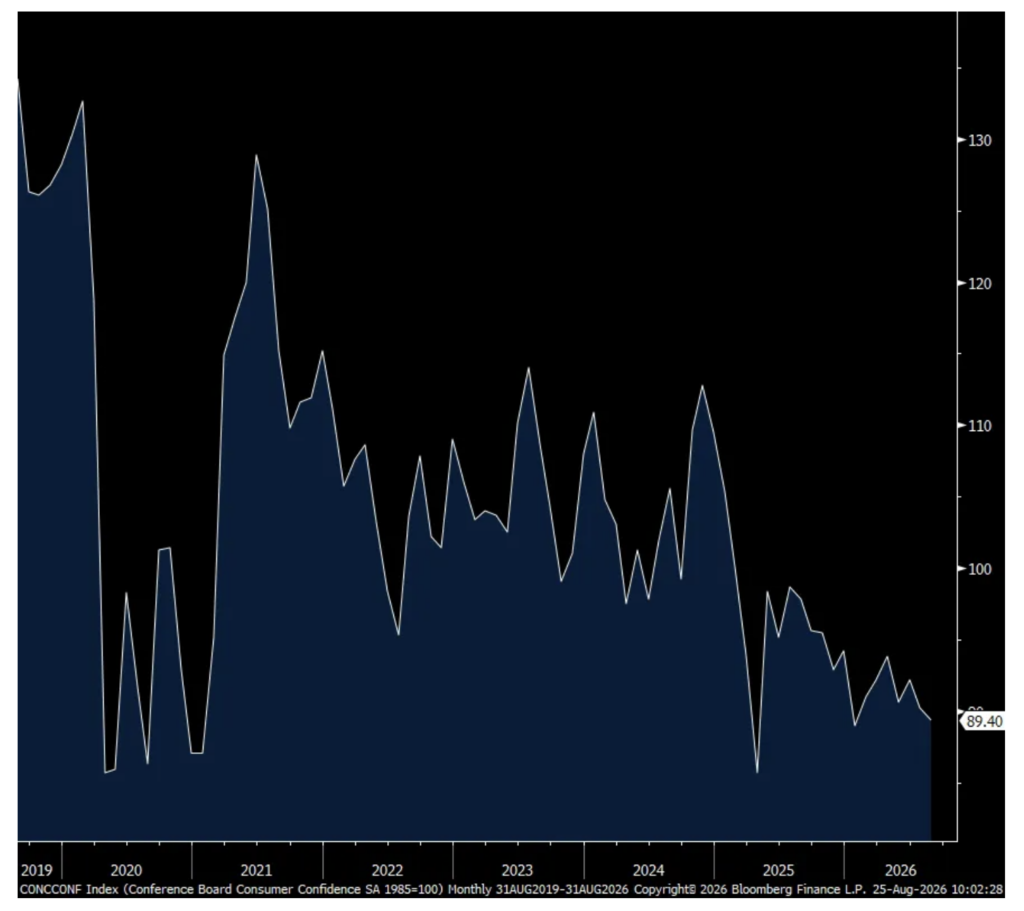
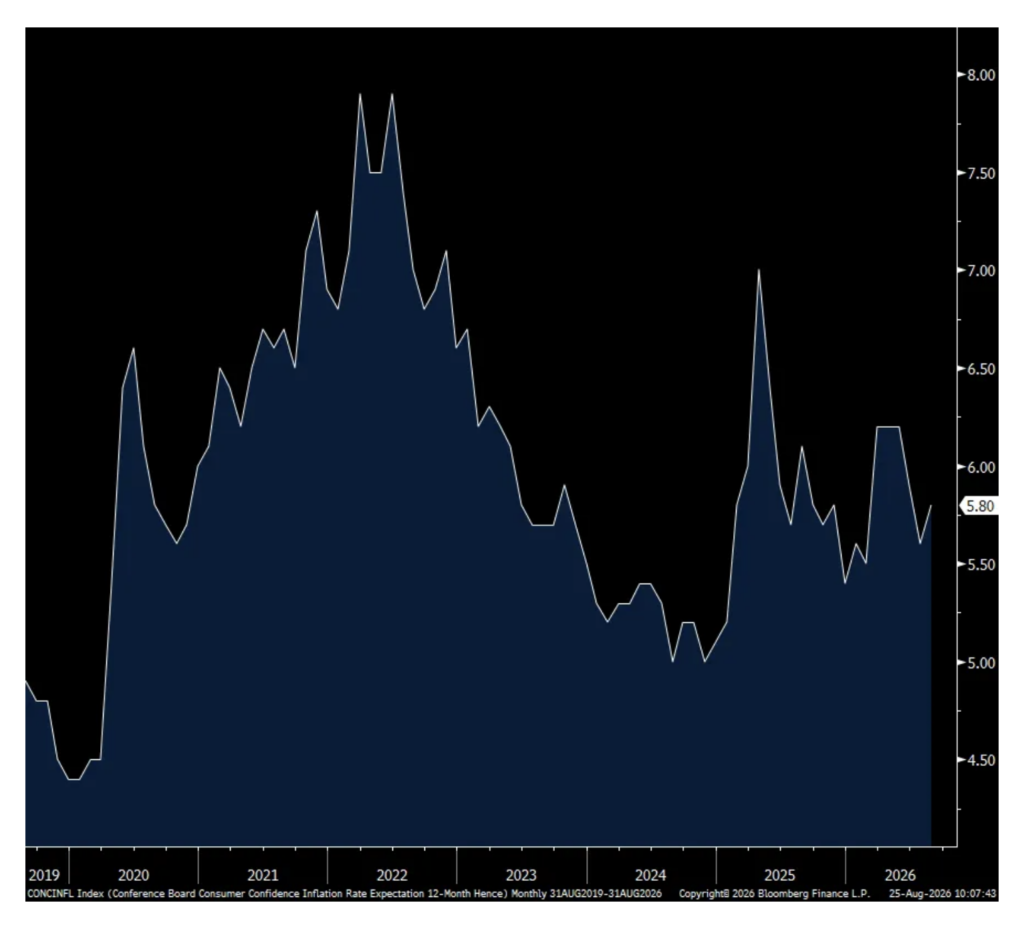
The Conference Board’s Consumer Confidence index slipped to 89.4 from 90.2 and less than one point below expectations. For perspective, the year-to-date average in this index is 91. The internals were very mixed as the Present Situation rose about 7 pts while Expectations fell by about 6 pts. One year inflation expectations rose to 5.8% from 5.6% in July and vs 5.9% in June.
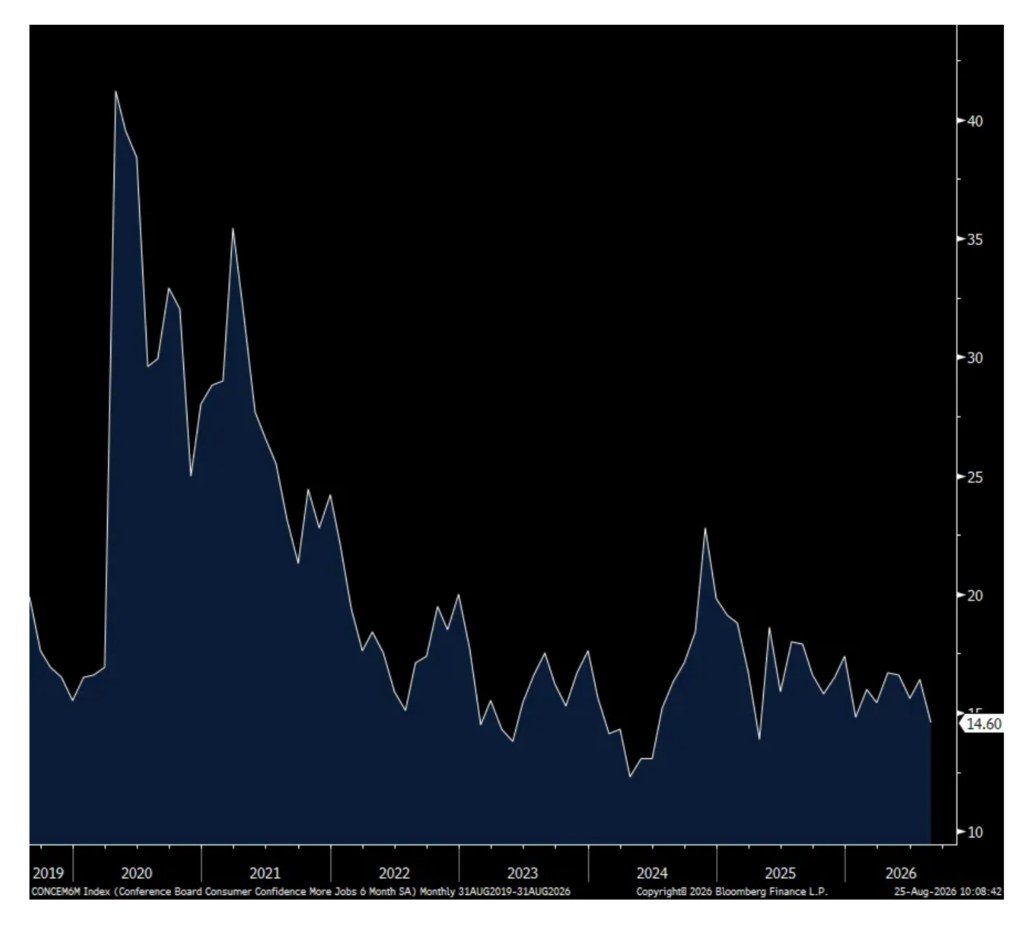
Positively, the answers to the labor market questions improved and was the main factor in the 7 pt rise in ‘Present Situation.’ Jobs were Plentiful rose and those Hard to Get fell, both to levels seen 5 months ago. The optimism though is short term as those expecting ‘More Jobs’ in the coming six months fell 1.8 pts to the lowest since April 2025.
Spending intentions for both autos and homes declined m/o/m and for major appliances too. On the service side, “restaurants/bars/take-out, utilities, and streaming/internet/mobile services, ranked among the top three spending targets, while planned spending on beauty and personal care fell.”
The Conference Board said, “Consumers’ write-in responses on factors affecting the economy were slightly more pessimistic in August. References to prices in general—and oil and gas specifically—remain elevated. Comments about war/conflict, food/groceries, trade, and jobs rose in August.” Not surprisingly.
Demographically, “On a six-month moving average basis, confidence across all age groups trended down slightly, remaining highest among consumers under 35. By income, confidence was mixed, but generally higher-income groups were more optimistic. By generation, confidence for Gen Z remained the highest, followed closely by Millennials on a six-month moving average basis. The three oldest generations—Generation X, Baby Boomer, and Silent Generation—trailed in confidence by a wider margin.” And, “Beyond the top three, consumers anticipated spending less on many activities within the next six months, such as movies, hotels for personal travel, airfare, amusement parks, and museums and historical sites, although spending plans for pet care remained strong.” Our pets are family, right?
Bottom line, overall consumer confidence remains depressed but we know the internals are hugely bifurcated and that inflation remains the biggest economic pain point for many lower to middle income consumers in particular.
Consumer Confidence
One yr Inflation Expectations
Expecting More Jobs in Coming 6 Months
Finally with this data dump, the August Richmond manufacturing index was little changed but stayed above zero at +4 vs +5 in July. This follows positive prints in the NY and Philly regions and adds to the manufacturing recovery theme after 3 tough years.
Position: None
