Late Morning Market Stats and Charts

– NYSE volume 7% above its one-month average;
– Nasdaq volume 10% above its one-month average;
– VIX index: down 7.81% to 16.30
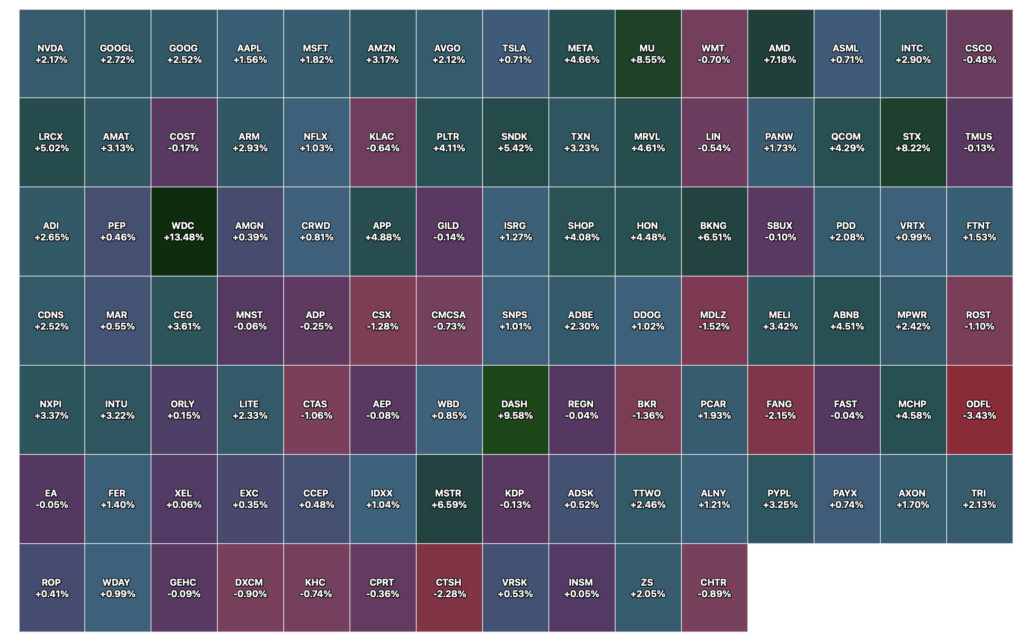
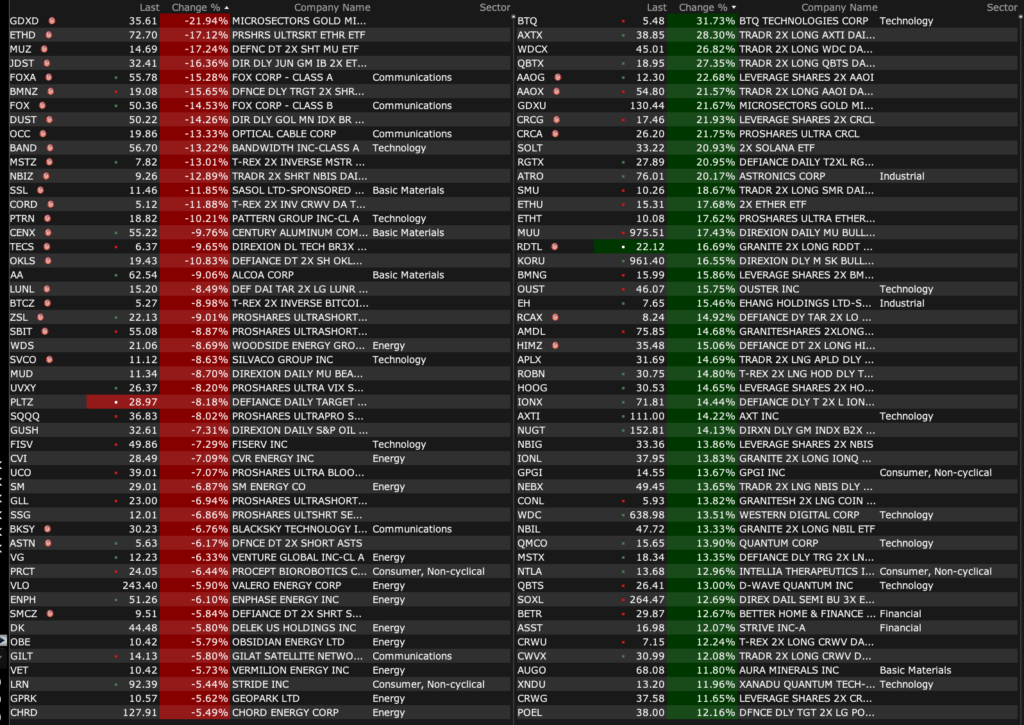
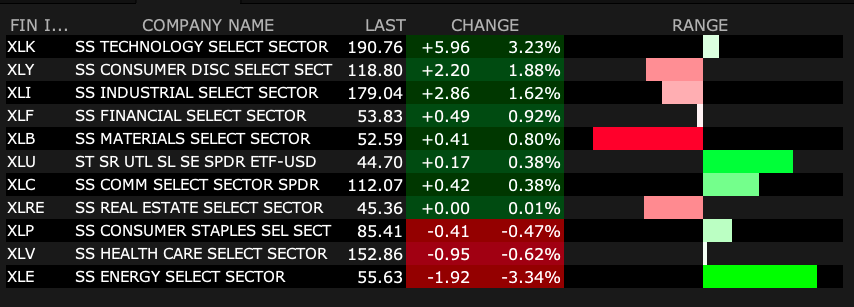
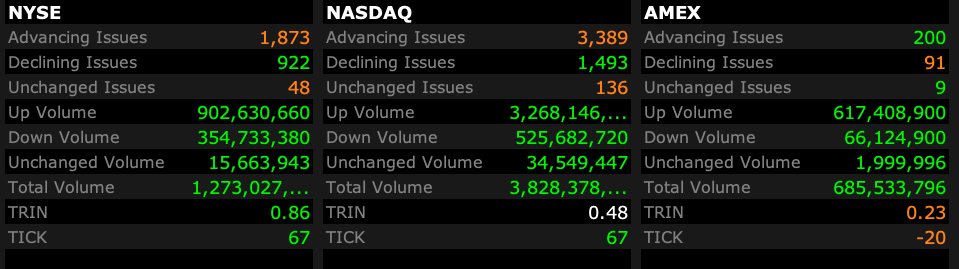
Positions: None.
– NYSE volume 7% above its one-month average;
– Nasdaq volume 10% above its one-month average;
– VIX index: down 7.81% to 16.30
Positions: None.
Positions: None.
From Peter Boockvar:
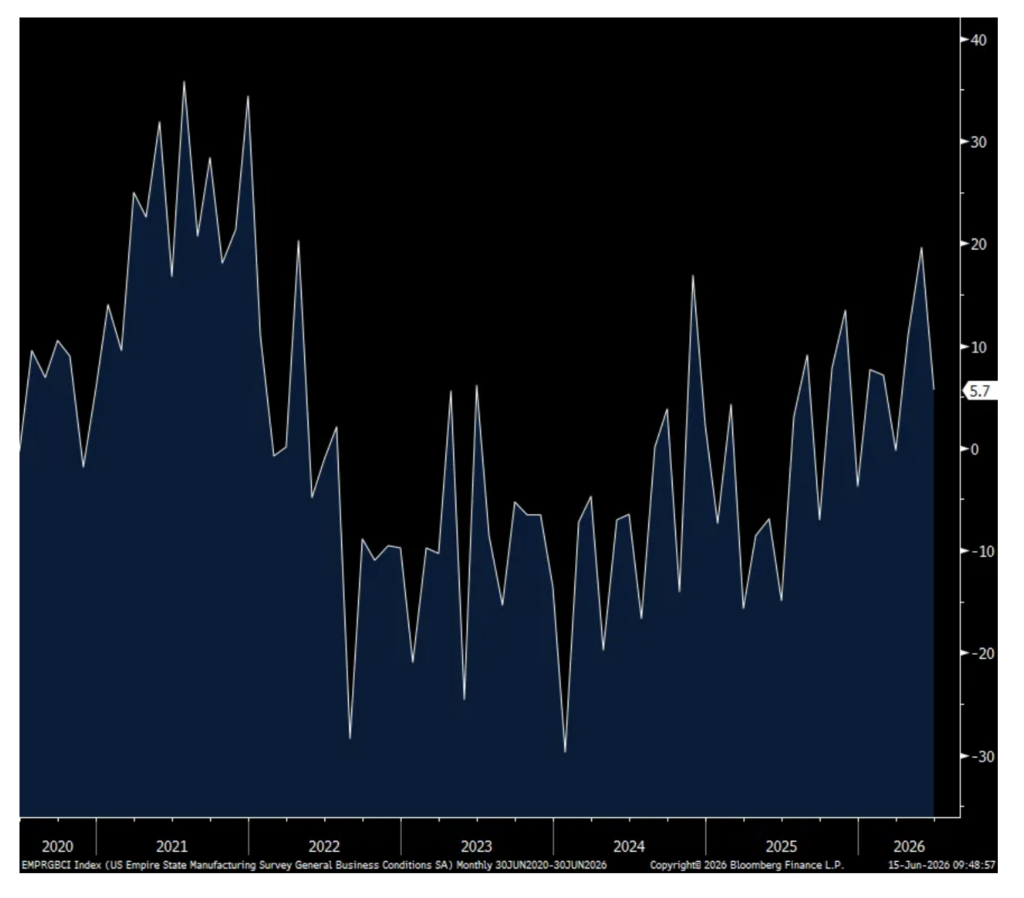
Now we watch to see the extent to which orders were pulled forward over the past few months. Ahead of this but reflecting that some of this has already taken place, the June NY manufacturing index fell to 5.7 from 19.6. Specifically, new orders fell to 3.5 from 22.7 in May and 19.3 in April while inventories dropped to zero from 9.7 in May and 5.1 in April. Backlogs though were little changed m/o/m at 5.0.
Delivery Times gave back the May jump but remained elevated at 11.9. Prices paid stayed high but a bit less so at 61, down 1.6 pts. Prices received at 31.4 was also little changed m/o/m but 7.6 pts above its 6 month average. Employment stayed above zero at 9.6 but the workweek fell, though was above zero.
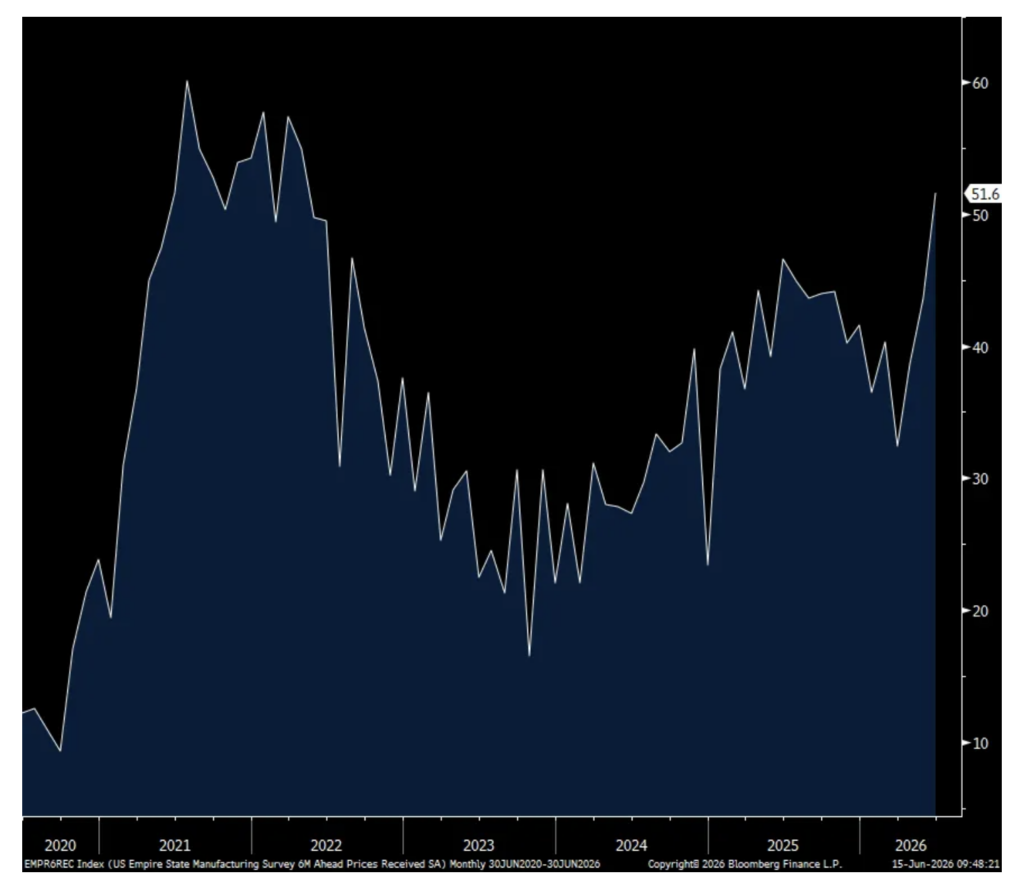
The six month business outlook at 30.1 was down 3.4 pts m/o/m and about where the half year average is. Of note, the six month expectation for price received rose 8 pts to the highest since April 2022. The six month outlook for prices paid slipped by 2.7 pts to 59.4 but that is still above its half year average. Capital spending plans dropped by 4.6 pts to 10.9, a 5 month low.
Bottom line, as stated, we now get to see how much of the recent lift in manufacturing was organic end demand and how much of it was the front loading of orders ahead of expected price increases and/or supply challenges. On the cost side, price pressures are clear on the producer side that will hopefully now get some relief but unless things go back to the cost structure of pre March, companies will still do what they can to recapture lost profit margins. That will be done either thru further productivity gains and/or cost cuts and/or less hiring and/or price increases.
NY Mfr’g
Expectations for Prices Received
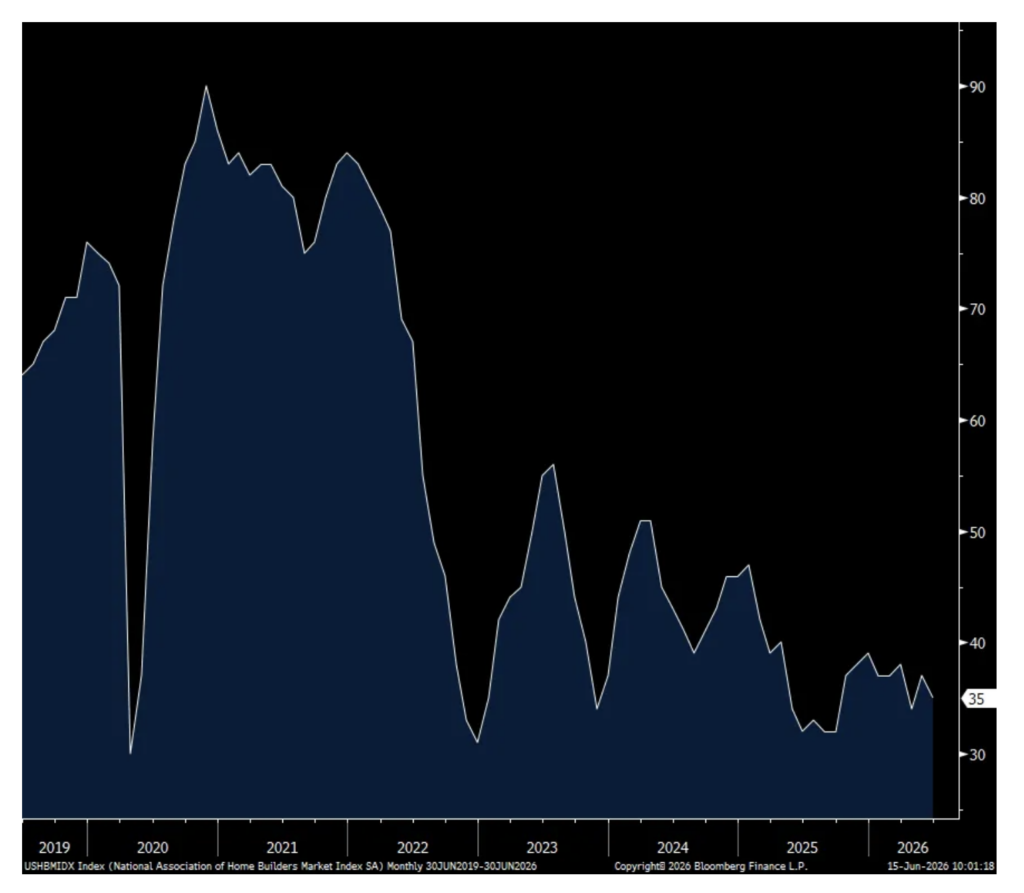
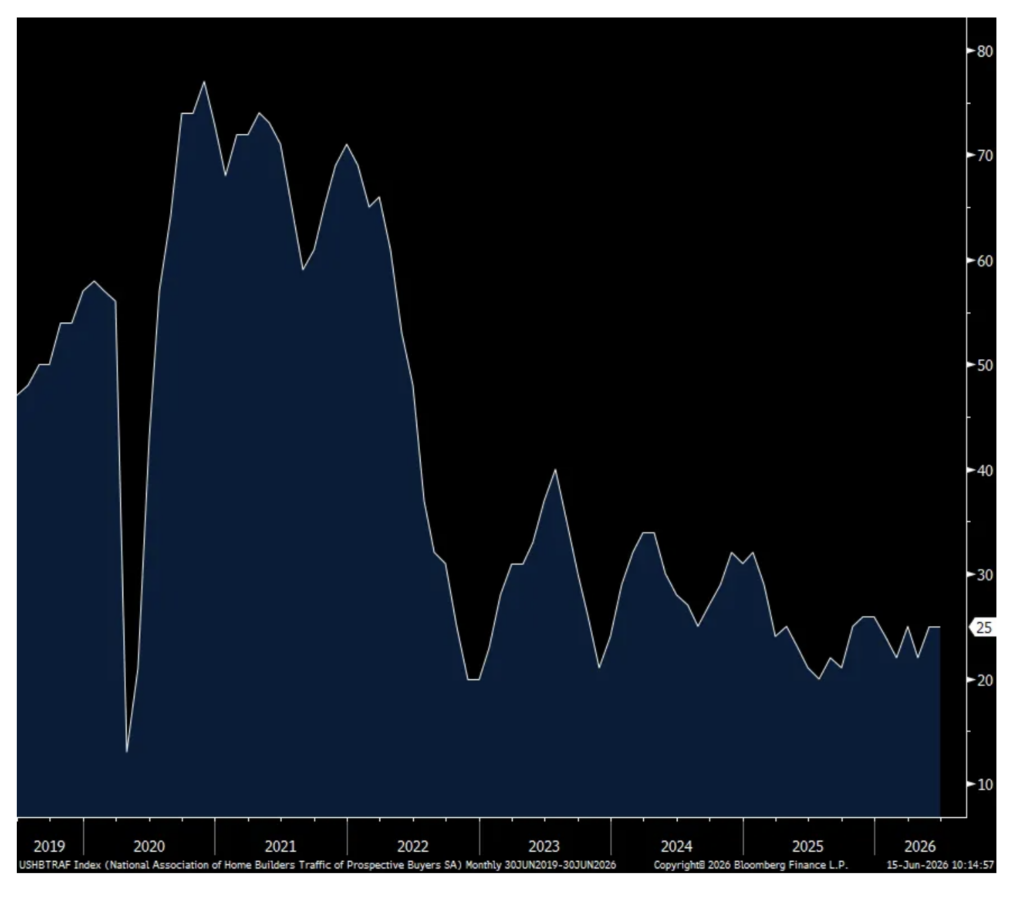
The June NAHB home builder sentiment index fell to 35 from 37 and vs the estimate of no change and thus remaining well below the breakeven of 50. The Present situation fell 2 pts to 38 after rising by 3 pts last month. The Future outlook was unchanged at 45. Prospective Buyers Traffic remained depressed at 25.
The NAHB talked about what builders are doing to drive sales, “The latest HMI survey also revealed that 35% of builders cut prices in June, up from 32% in May. The average price reduction was 6% in June, the same rate as the previous month. The use of sales incentives was 62% in June, up slightly from 61% in May, and marking the 15th consecutive month this share has reached 60% or higher.”
They also blamed government policy that is limiting the ability to deliver supply. “Costly and inefficient regulatory policy is clearly impeding the ability of builders to increase the housing supply. According to a new NAHB study, government regulation, taxes, fees and other costs add more than 26% to the price of an average single-family home. Easing permitting bottlenecks, density limits and inefficient zoning rules would help reduce costs and support the housing growth the nation needs.”
With respect to mortgage rates, they averaged 6.54% in June vs 6.41% in May. We know all about the affordability challenges and they remain until proven otherwise.
NAHB
Prospective buyers traffic
Positions: None.
With these index shorts I am moving closer to medium-sized:
* SPY ($SPY) $753.96
* QQQ ($QQQ) $741.72
Positions: Short SPY S QQQ S
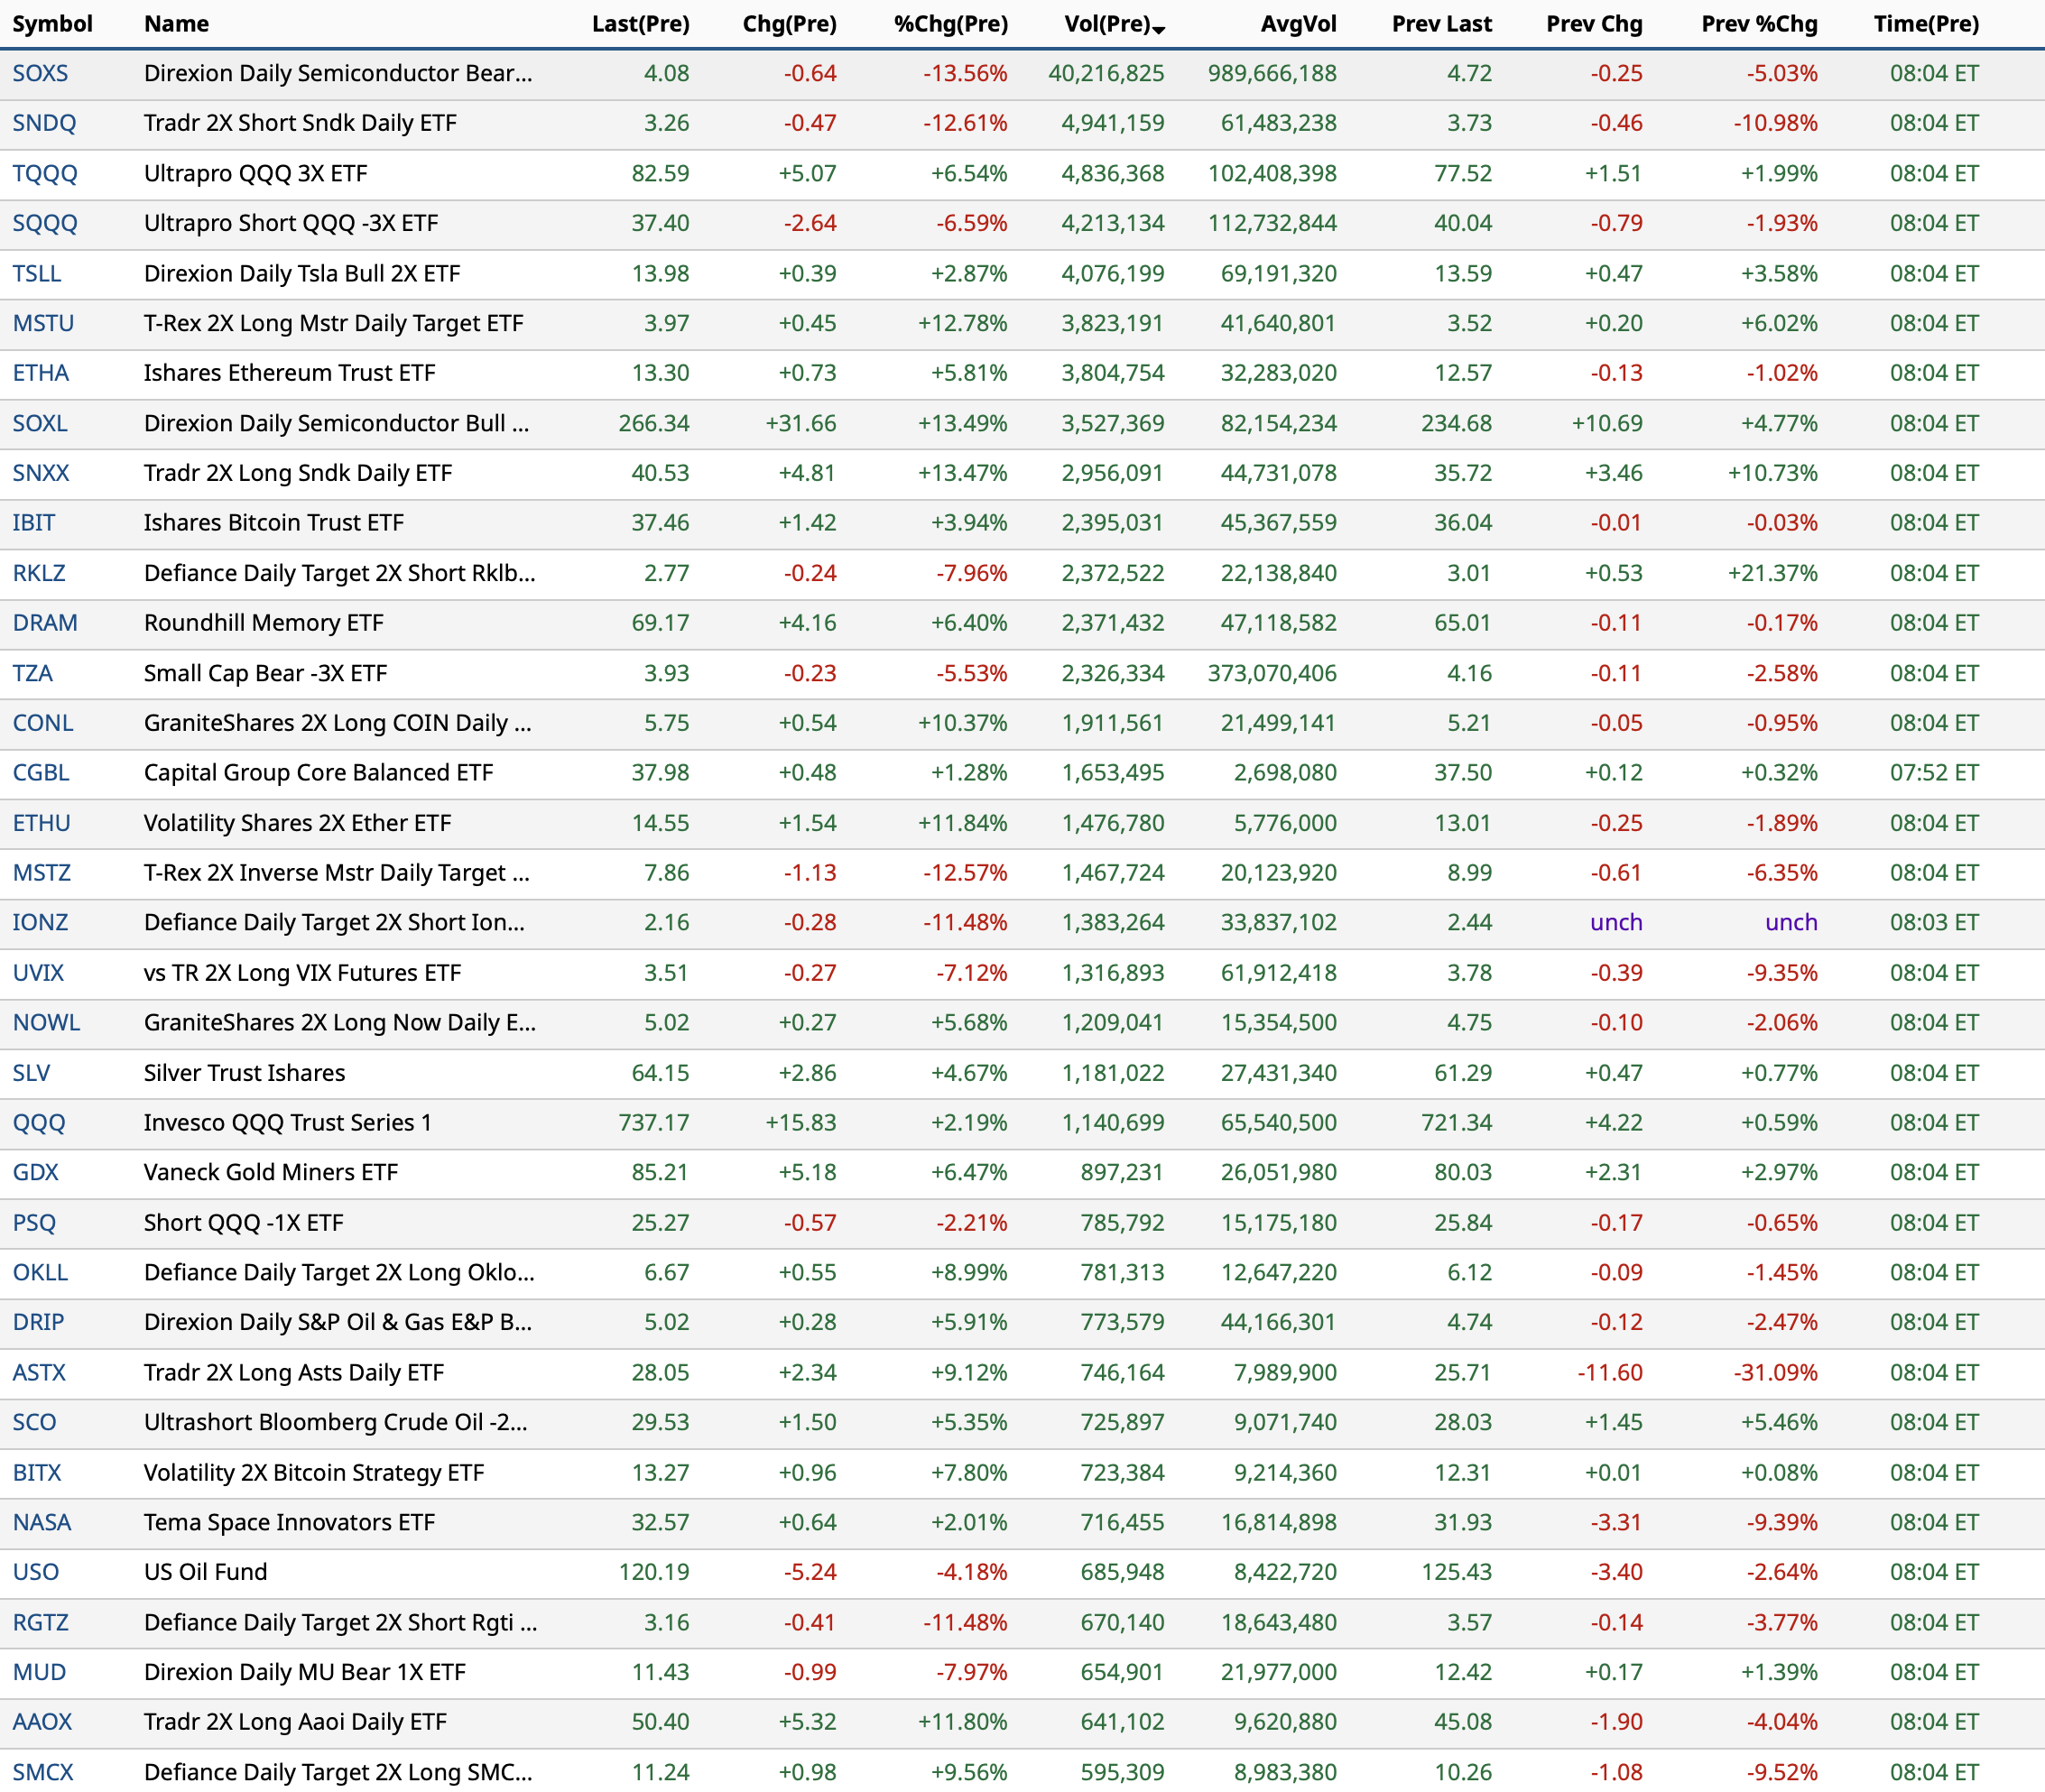
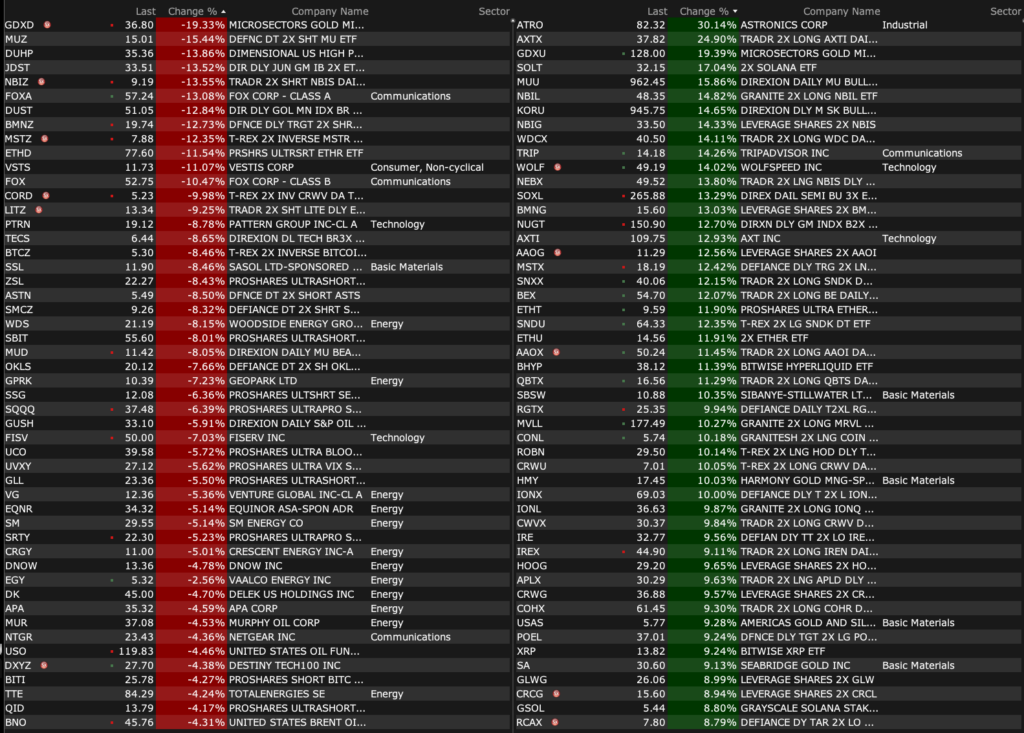
-TRIP +13% (sells European restaurant reservation platform TheFork to American Express for $700M cash)
-CMTL +12% (earnings; sells most of Satellite and Space Communications segment to Gilat for $157.5M)
-MU +8.1% (multiple broker price target hikes)
-NBIS +7.2% (added to NASDAQ 100 index)
-SPCX +5.9% (momentum)
-CEVA +4.2% (Needham Initiates CEVA with Buy, price target: $55)
-PAYO +3.7% (confirms to be acquired by Nuvei at $7.40/shr in cash)
-DDOG +3.5% (Truist Raised DDOG to Buy from Hold, price target: $300 from $190)
-PSKY +3.1% (DOJ approves Paramount’s acquisition of Warner Bros)
-PGY +2.7% (closes upsized $800M AAA-rated personal loan ABS transaction
-PAYX +2.2% (CitiGroup Raised PAYX to Buy from Neutral, price target: $140 from $99)
-ELTX -64% (Phase 2 AMPLIFY-7P Study did not meet the pre-specified primary endpoint of disease-free survival (“DFS”) in the intent-to-treat population)
-NMRA -49% (discontinues navacaprant Phase 3 development in KOASTAL-2 and -3 after missing primary and key secondary endpoints)
-TRAW -18% (Phase 2a tivoxavir marboxil influenza challenge study deferred after MHRA review)
-FOX -12% (ROKU to be acquired by Fox Corp at $160/shr in $22B cash-stock deal)
-PTRN -8.8% (Holders file to sell 8M Class A shares)
-FISV -6.1% (names new CEO; affirms FY26 outlook)
-BAND -4.6% (files to sell $275M convertible senior notes due 2032)
Positions: None.
Positions: None.
Positions: None.
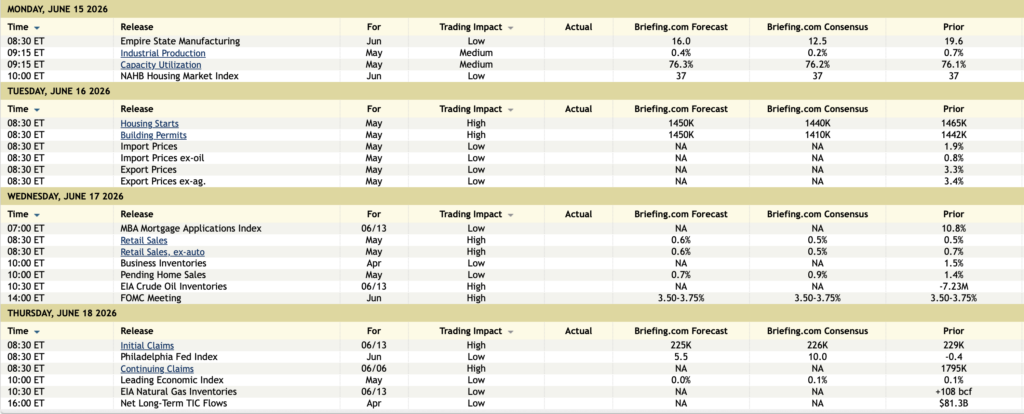
8:00 a.m.: Fed Treasury Repo Reference Rate;
11:00 a.m.: Treasury buyback announcement (liq sup-port);
11:30 a.m.: Treasury hosts an $89 billion 3 and a $77 billion Month Bill Auction
Positions: None.
From Peter Boockvar:
A big high five to all my fellow life long Knick fans and also to those more recent. It’s amazing the emotions that sports can bring.
For frame of reference I’m going to compare current prices of a variety of things to where they stood on the last trading day of February, right before the conflict began that weekend. Also note that many prices started to price in a deal beginning in early April when the White House started to signal that they wanted one. And we know the GenAI tech trade has been completely immune from the events of the Middle East.
WTI July contract
$66.18 vs $80.25 today
WTI Dec contract
$63.73 vs $74.81 today
Brent Aug contract
$70.88 vs $82.83 today
Brent Dec contract
$68.64 vs $79.95 today
DAP Nola Phosphate
$627.50 per ton vs $782.50 Friday
US Gulf Nola Urea
$470 per ton vs $386 Friday
US Natural Gas
$3.34 vs $3.04 today
TTF in Europe
$31.61 vs $44.09 today
Bloomberg Agriculture Index
54.56 vs 53.91 Friday
Aluminum
$3,140 per ton vs $3,426 Friday
Copper
$6.17 per pound vs $6.56 today
European Naphtha
$563.9 vs $706.23 Friday
Polyethylene
$6,393 per ton vs $7,853 Friday
US 10 yr Treasury Yield
3.94% vs 4.45% today
US 2 yr Treasury Yield
3.38% vs 4.04% today
US 10 yr Inflation Breakeven
2.26% vs 2.32% today
German 10 yr Bund Yield
2.64% vs 2.96% today
German 2 yr Bund Yield
2.00% vs 2.56% today
Japanese 10 yr JGB Yield
2.12% vs 2.58% today
Japanese 2 yr JGB Yield
1.23% vs 1.40% today
DXY
97.60 vs 99.55 today
NASDAQ 100
24,960 vs 30,228 indicated this morning
S&P 500
6879 vs 7520 indicated this morning
S&P 500 Equal Weight
8290 vs 8556 Friday
Euro STOXX 600
633.85 vs 637.56 today
South Korean Kospi
6244 vs 8546 today
I will also add my belief that the global trend that started last year to diversify capital and trade flows around the world and to be less dependent (though still very reliant) on the US will only continue. And certainly the work has begun to shift supply chains away from the Strait of Hormuz. Iran will only lose more leverage as the years progress from here.
Positions: None.