Thinking Further on IBM
Yes, I’ve added to IBM ($IBM) on today’s weakness.
Readers will see that after falling out of bed late this past winter, the shares of IBM had developed a rectangle pattern with a $258 pivot over the following three-month period. The stock broke out of that pattern in response to the above news flow. In doing so, IBM took back its 21-day EMA, 50-day SMA and 200-day SMA.
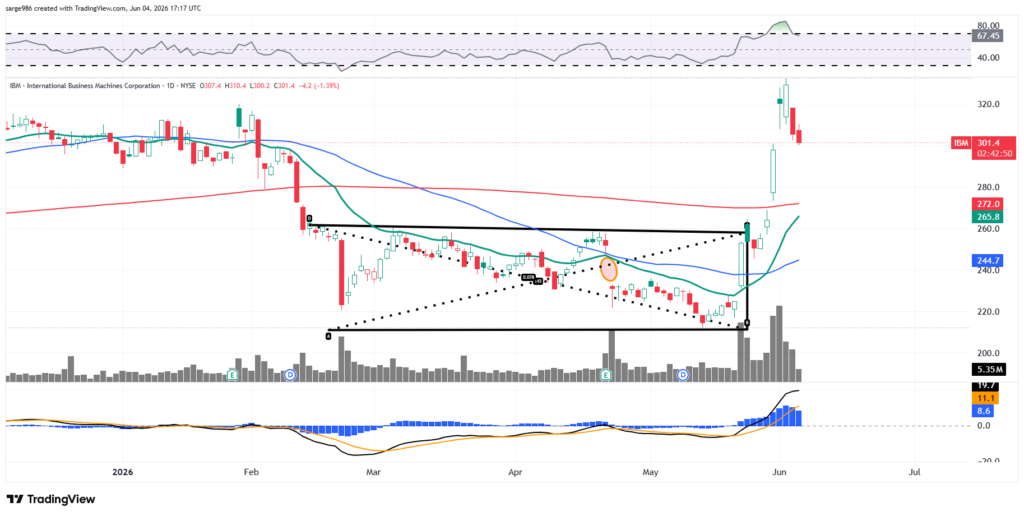
Relative Strength is still quite robust but has now come off of a technically overbought level. Below the chart, the MACD now has a lot of bullish momentum, and is still postured in that way. Within that indicator, the histogram of the 9-day EMA is now well into bullish territory while the 12-day EMA is holding its ground above the 26-day EMA.
What if we strip away the rectangle? Take a look:
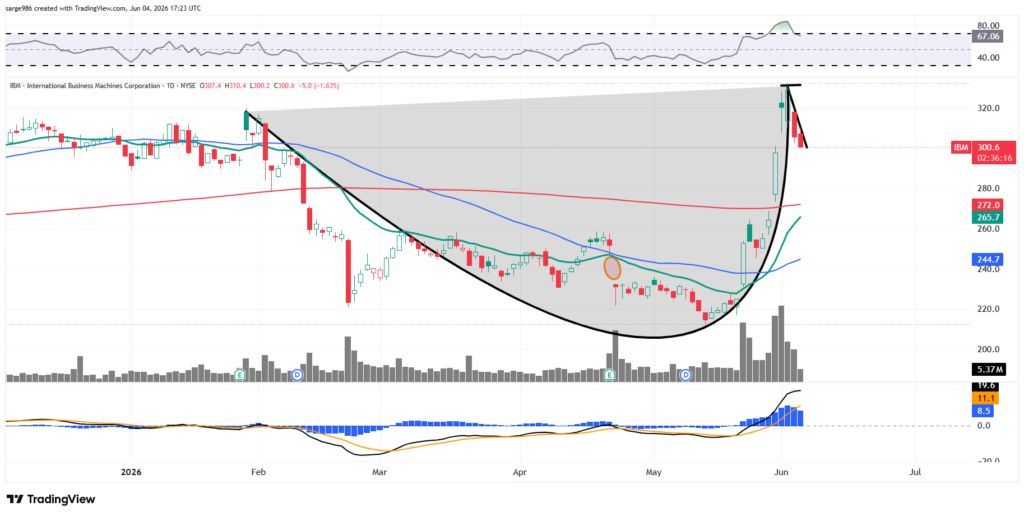
It’s a little lopsided, but IBM has developed a “cup with handle” pattern bearing a $331 pivot. This, in my opinion, refreshes the bullish setup for this stock.
International Business Machines (IBM)
Price Target: $397 (up from $337)
Pivot: $331
Add: Down to 200-day SMA (Currently $272)
Panic: Loss of that 200-day line.
Position: Long IBM equity