Who Gets Paid When You Ask AI a Question?


Let’s follow the money behind every AI answer.
We face additional headwinds this week, but I also continue see many reasons to be bullish.
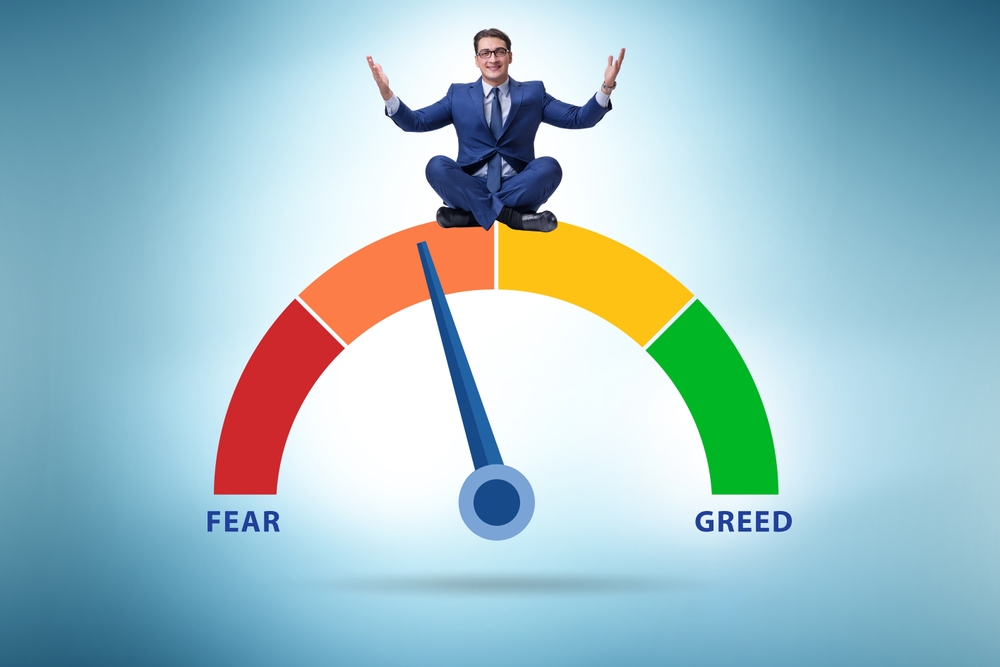
It’s been a while since I provided an update on CNN’s (mine) Fear & Greed Index. So, let’s do it!
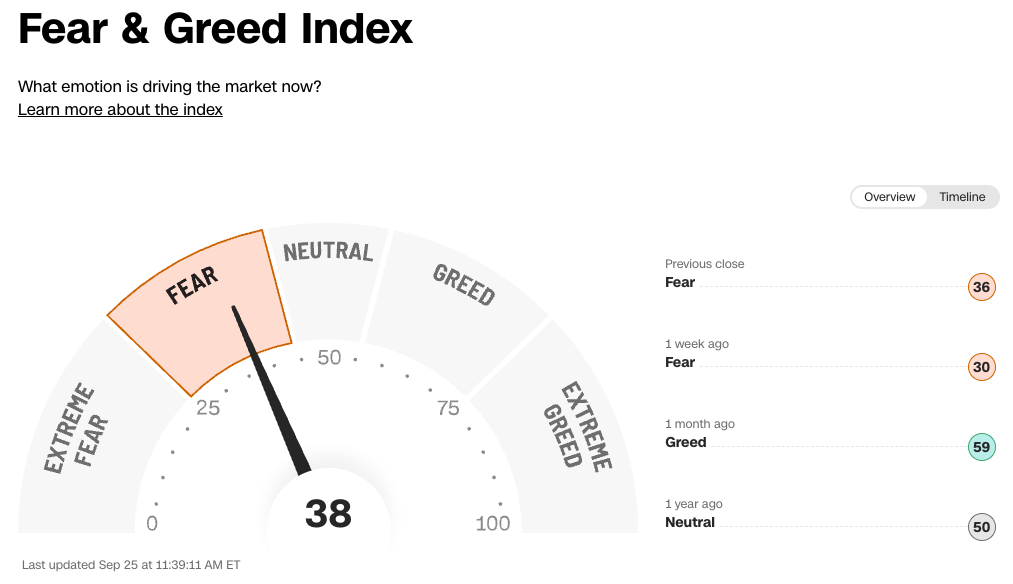
The headline number of 38 is 11 points off the low of 27 set on 9/16. The stock market is up a bit in that time, too, but are we feeling less fearful? The stocks that drove those gains are the same ones we’ve all been focused on this year, the mega-cap techs. Specifically, $NVDA, $META, & $AAPL. Not all of the big names have been participating, though. In fact, NVDA, while it did rally off the 9/16 low, is still stuck, having set its yearly high in May.
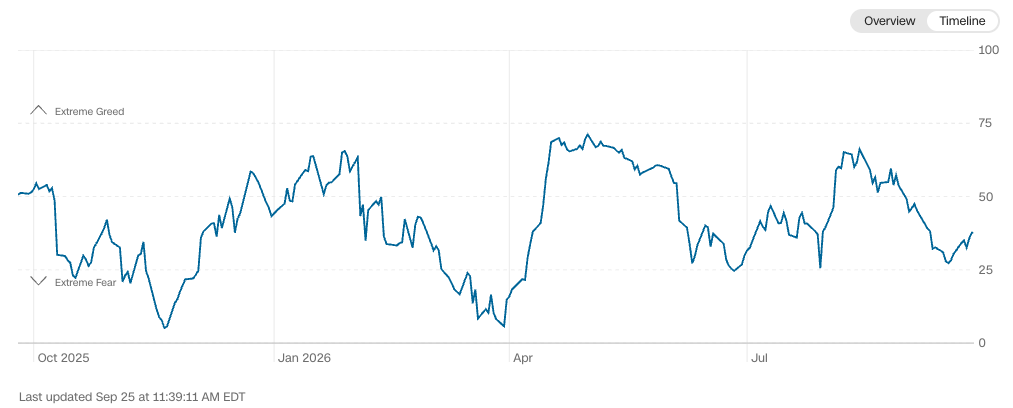
Overall, breadth remains narrow, with net new 52-week lows dominating new highs by a big margin on the NYSE. Downside volume has swamped upside volume, too. As a result, even though the S&P 500 is near all-time highs, it’s gone sideways for the last 6 weeks.
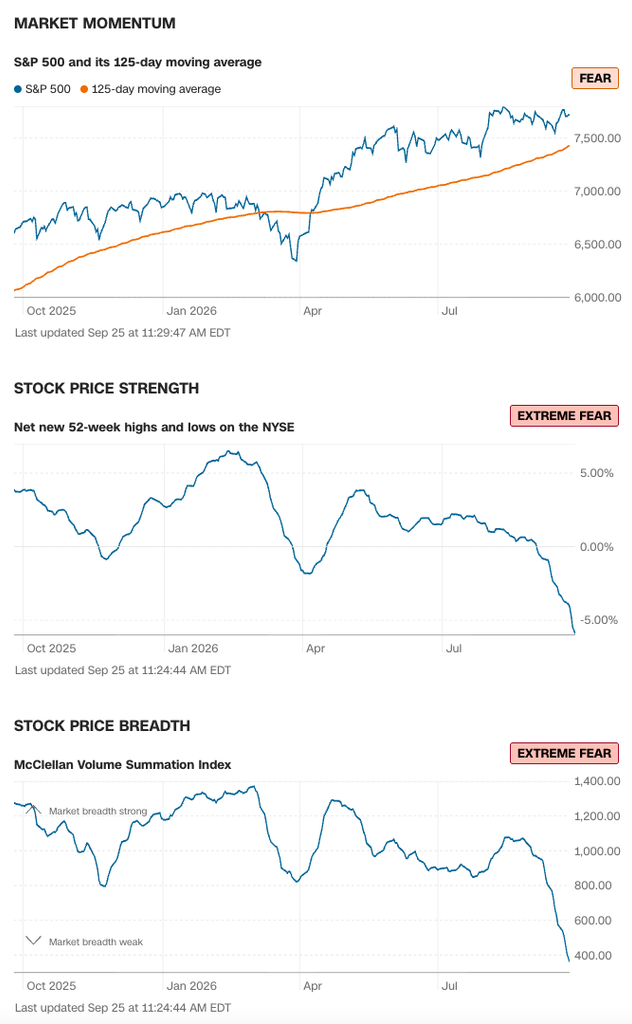
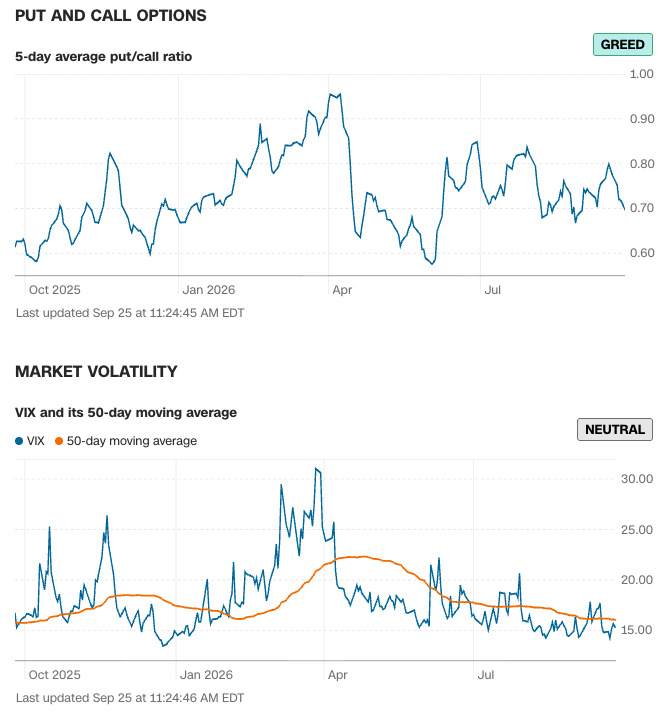
The options indicators have gone sideways and show no fear. They seem to reflect only the performance of the mega-caps and not the performance of the other 490ish stocks. $RSP is down about 6% since August, and small caps (RUT) are off 7%. Helene Meisler says that investors are getting complacent, and I don’t disagree.
So, how are bonds doing? The Safe Haven Demand indicator includes treasuries, while the Junk Bond Demand indicator is corporate-focused, high-yield corporates ($HYG) vs. investment-grade ($LQD), so the treasury decline isn’t reflected there. What we see is that stocks are beating bonds. No surprise. Small surprise, however, is that Junk is beating Investment Grade. Not by much, and both are down, but Junk has the edge.
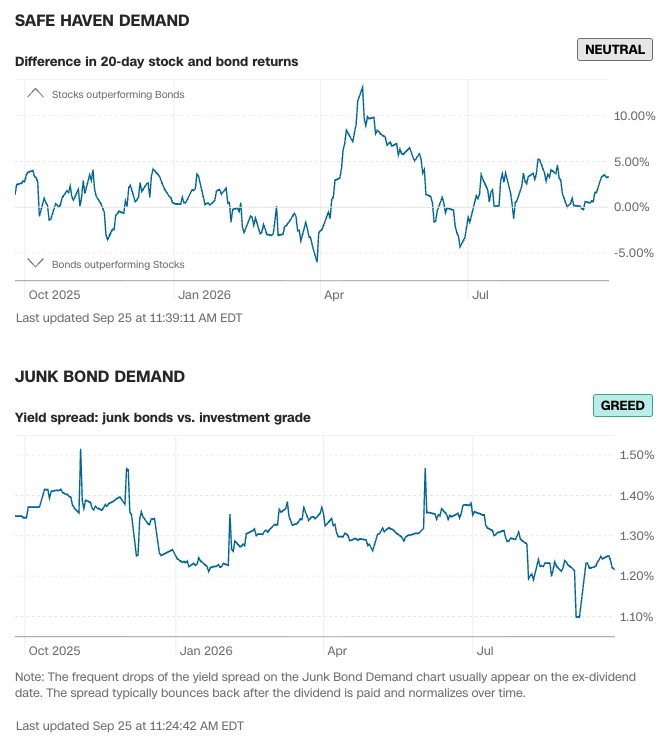
So, like Helene said, investors are complacent in the face of a market that is not holding up as well as the big-cap weighted indexes would have us believe.
Fear & Greed hasn’t been over 60 since last spring, and that’s my line in the sand. Until we can get above that level, stocks may rally, but it will likely be narrow and not be a healthy rally.
Bringing this back to the Diary, as Crazy1 said this morning, there could be some good tax loss harvesting opportunities this fall.
All charts are from CNN Business: https://www.cnn.com/markets/fear-and-greed
This commentary was originally posted in the Daily Diary on TheStreet Pro.
Amazon sports three wide moat businesses and almost universally positive analyst coverage. So why isn’t it a buy?
It’s been a while since I provided an update on CNN’s (mine) Fear & Greed Index. So, let’s do it!
The headline number of 38 is 11 points off the low of 27 set on 9/16. The stock market is up a bit in that time, too, but are we feeling less fearful? The stocks that drove those gains are the same ones we’ve all been focused on this year, the mega-cap techs. Specifically, $NVDA, $META, & $AAPL. Not all of the big names have been participating, though. In fact, NVDA, while it did rally off the 9/16 low, is still stuck, having set its yearly high in May.
Overall, breadth remains narrow, with net new 52-week lows dominating new highs by a big margin on the NYSE. Downside volume has swamped upside volume, too. As a result, even though the S&P 500 is near all-time highs, it’s gone sideways for the last 6 weeks.
The options indicators have gone sideways and show no fear. They seem to reflect only the performance of the mega-caps and not the performance of the other 490ish stocks. $RSP is down about 6% since August, and small caps (RUT) are off 7%. Helene Meisler says that investors are getting complacent, and I don’t disagree.
So, how are bonds doing? The Safe Haven Demand indicator includes treasuries, while the Junk Bond Demand indicator is corporate-focused, high-yield corporates ($HYG) vs. investment-grade ($LQD), so the treasury decline isn’t reflected there. What we see is that stocks are beating bonds. No surprise. Small surprise, however, is that Junk is beating Investment Grade. Not by much, and both are down, but Junk has the edge.
So, like Helene said, investors are complacent in the face of a market that is not holding up as well as the big-cap weighted indexes would have us believe.
Fear & Greed hasn’t been over 60 since last spring, and that’s my line in the sand. Until we can get above that level, stocks may rally, but it will likely be narrow and not be a healthy rally.
Bringing this back to the Diary, as Crazy1 said this morning, there could be some good tax loss harvesting opportunities this fall.
All charts are from CNN Business: https://www.cnn.com/markets/fear-and-greed
We’ve already got a market-relevant impact on tariffs, but what are the other main points of contention as the “G2” gather?
Check this out.
Most readers probably already know that I have been very positive on both Advanced Micro Devices ($AMD) and Intel ($INTC). AMD literally for years and INTC for this year at least. Most readers likely also know that I remain long Nvidia ($NVDA), but don’t write on it very often. Looking at The Sarge-folio, AMD is a top-five name in terms of weighting, INTC is a top-10 name and NVDA is a top-15 name. That’s the way that I have had them weighted for some time now.
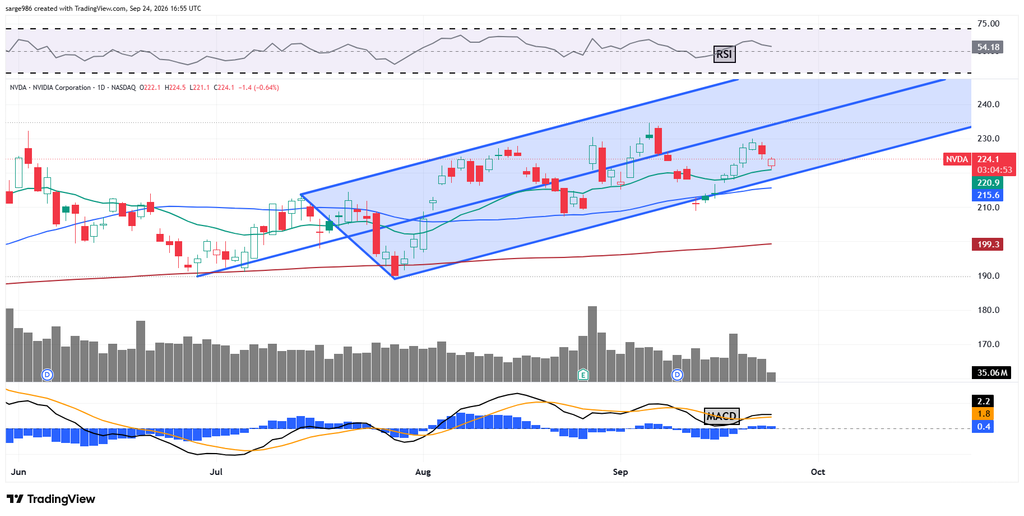
NVDA continues to trade within my Pitchfork model. This morning, the stock found support at its 21-day EMA as, I think, swing traders came to the rescue. Still, this is a dangerous spot as swing trades are notoriously fickle and if that line fails, how far away can a test of the 50-day SMA be? I still have a $290 target on NVDA, but I am starting to lose confidence in this one.
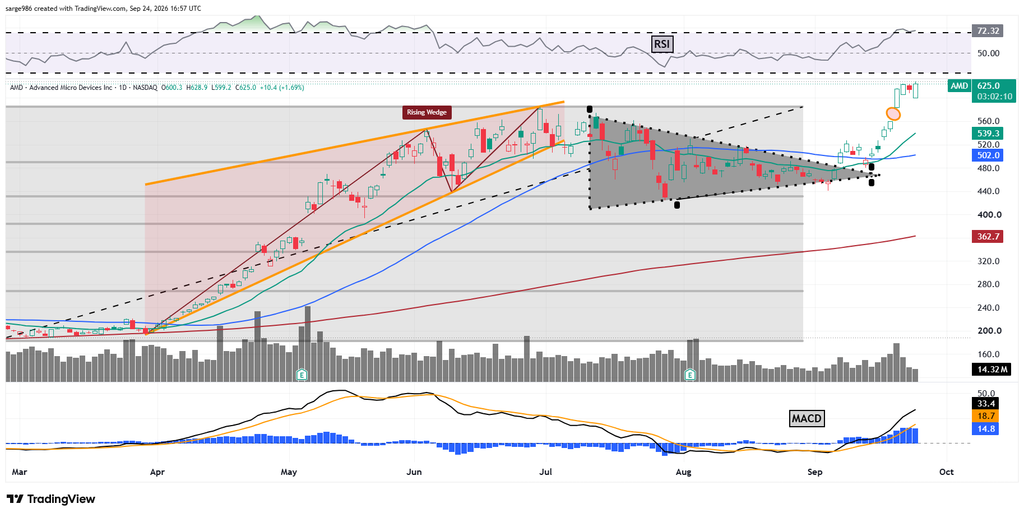
It looks to me like AMD may be starting to consolidate, which is healthy. The recent move was nearly parabolic in nature and needs to be digested. I am very comfortable with my current $790 price target.
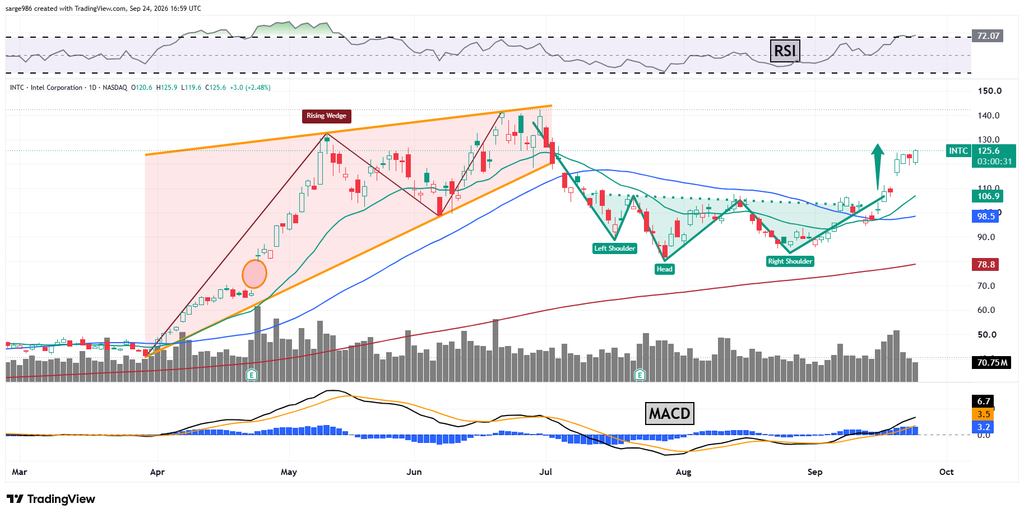
INTC also seems to be setting up for some consolidation, which would be welcome. Here, too, the chart is very positive. My $178 target may be a little aggressive, but this stock still may be underrated. Lip-Bu-Tan is the best CEO this company has had in many, many years.
Position: Long AMD, INTC and NVDA equity.
Elite fundamentals, a decade-low multiple, solid technicals, and analyst enthusiasm all point the same way. So why don’t I own more?
SI will destroy and create major economic shifts. Let’s discuss the emerging investment opportunities.
Tech’s continued rebound along with falling oil prices and Treasury yields drove a powerful rally to start the week.