Is the AI Gravy Train About to Get a Yellow Signal?


The market may not be selling off solely because of oil and Iran. Investors may be starting to price in another troubling risk.
The market may not be selling off solely because of oil and Iran. Investors may be starting to price in another troubling risk.
Bond yields hit fresh multi-year highs, while oil whipsawed on Iran headlines, sending the S&P 500 into the red for September.
Let me explain how I’m playing SPCX and how it fits into my trading style.
– $KOD +60% (pivotal Phase 3 DAYBREAK wet-AMD trial met its primary noninferiority endpoints, with most patients reaching a 24-week dosing interval)
– $ARAY +39% (agrees to explore integrating Samsung NeuroLogica volumetric imaging technology with the CyberKnife platform)
– $MEDS +28% (launches a GLP-1 care app offering telehealth consultations and access to branded medications)
– $WBUY +27% (first-half revenue nearly doubled, gross profit rose 132% and the net loss narrowed)
– $MTEK +21% (receives a record $10 million order for advanced video systems on next-generation airborne defense platforms)
– $AMPX +12% (wins a Defense Department grant of up to $75 million for domestic high-energy-density battery production, with about $22 million obligated initially)
– $SRFM +7.1% (selected as a participating airspace user in the FAA SMART program)
– $NTES +4.6% (no clear fresh catalyst identified; unusually large, liquid premarket move)
– $SM +2.6%, FRO +2.9%, APA +2.5%, OXY +1.7%, XOM +1.5%, CVX +1.5% (energy names rise as crude advances after the US rejected Iran’s conditions for reopening the Strait of Hormuz)
– $CF +2.4% (Rothschild Redburn upgrades to Neutral from Sell, citing a tighter nitrogen-market outlook)
– $GFI -13% (confirms a rejected A$27-per-share cash-and-stock proposal for Northern Star that would leave target holders owning about 33% of the combined company)
– $MNOV -12% (Phase 2 trial failed to show a statistically significant triglyceride benefit versus placebo at Week 24)
– $AU -5.6%, AG -4.5%, CDE -5.1%, HL -4.9%, EGO -4.6%, NEM -4.0% (precious-metals miners fall as gold and silver tumble on a stronger dollar, rising yields and increased Fed rate-hike expectations)
– $FCX -3.3%, SCCO -3.4%, HBM -3.8% (base-metal miners fall as the stronger dollar and rising yields pressure commodity prices)
– $META -2.7% (pulls back after last week’s sharp AI-led rally as rising Treasury yields pressure megacap growth stocks)
– $BE -2.6%, GLW -2.0%, MOD -3.0% (data-center infrastructure names retreat in the higher-yield risk-off tape)
– $CRCL -2.0% (crypto-linked shares weaken as Bitcoin falls about 2%)
– $TTMI -1.8%, CRDO -2.5%, SKHY -3.3%, INTC -2.4%, ARM -2.1%, SNDK -2.7% (high-beta chip and memory names retreat as oil-driven inflation fears lift Treasury yields and pressure the Nasdaq tape)
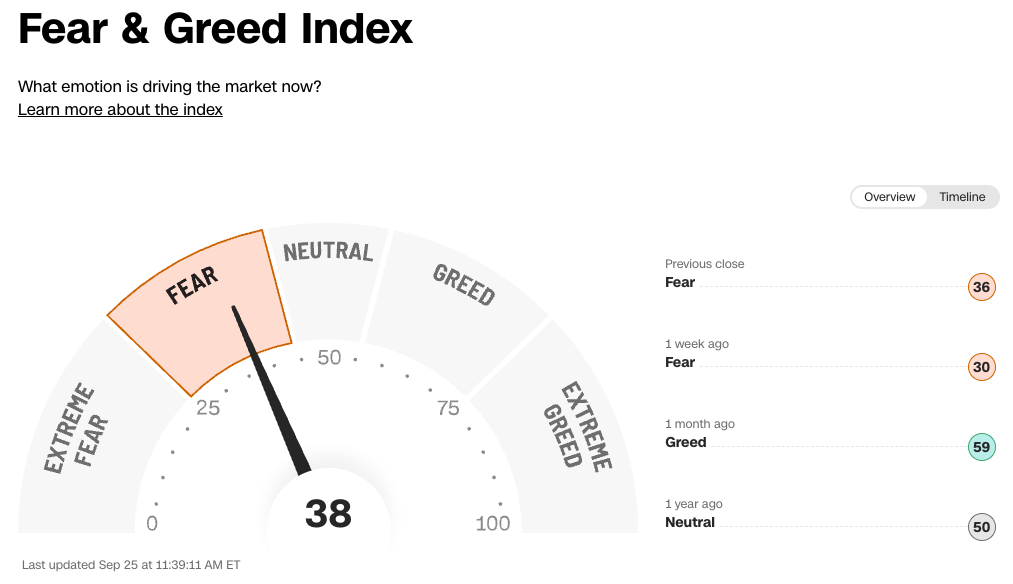
It’s been a while since I provided an update on CNN’s (mine) Fear & Greed Index. So, let’s do it!
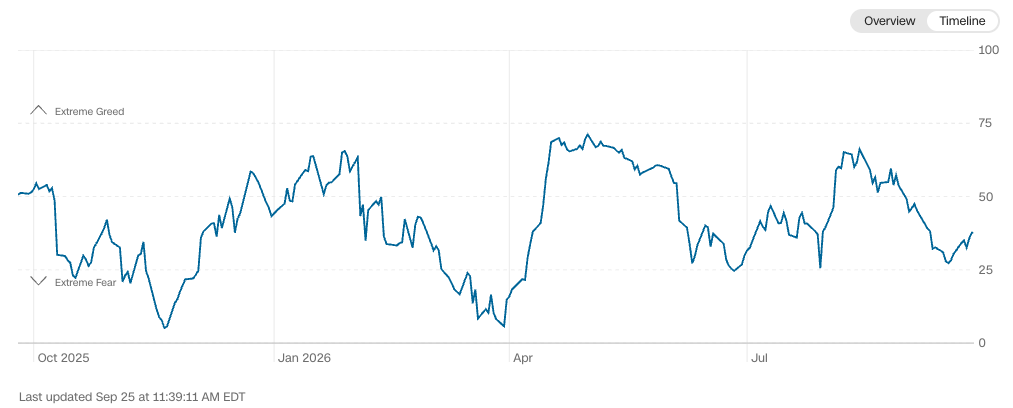
The headline number of 38 is 11 points off the low of 27 set on 9/16. The stock market is up a bit in that time, too, but are we feeling less fearful? The stocks that drove those gains are the same ones we’ve all been focused on this year, the mega-cap techs. Specifically, $NVDA, $META, & $AAPL. Not all of the big names have been participating, though. In fact, NVDA, while it did rally off the 9/16 low, is still stuck, having set its yearly high in May.
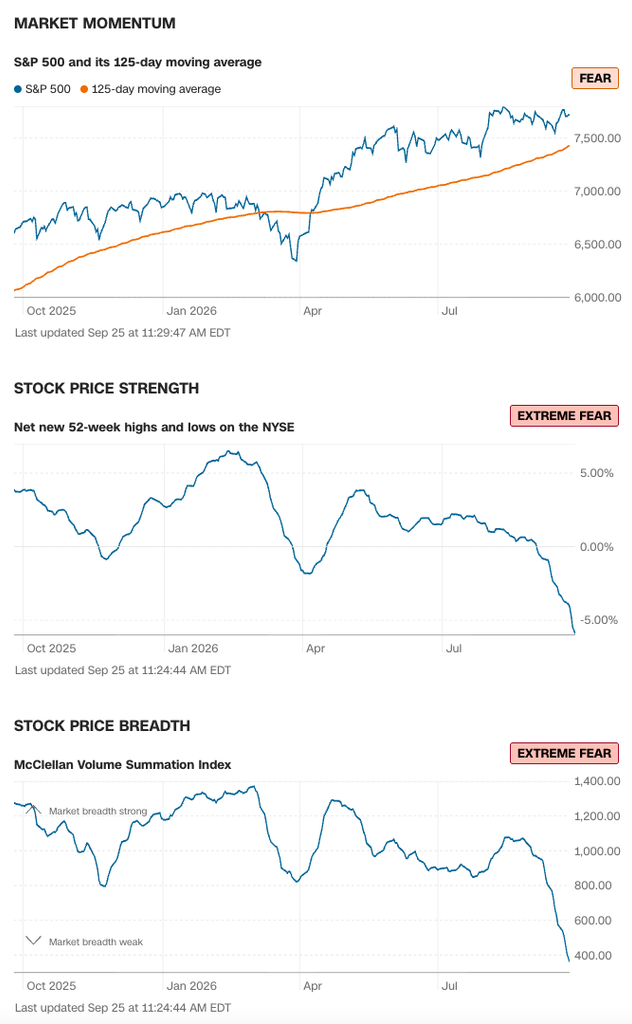
Overall, breadth remains narrow, with net new 52-week lows dominating new highs by a big margin on the NYSE. Downside volume has swamped upside volume, too. As a result, even though the S&P 500 is near all-time highs, it’s gone sideways for the last 6 weeks.
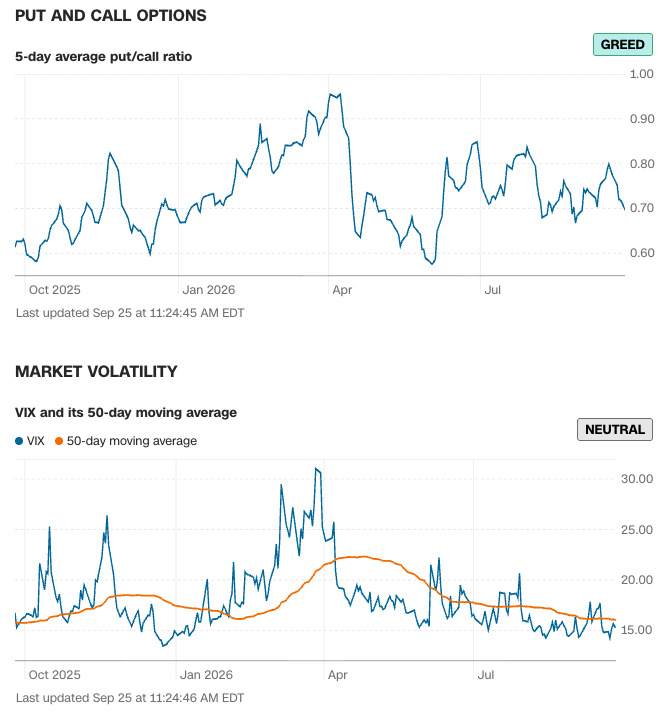
The options indicators have gone sideways and show no fear. They seem to reflect only the performance of the mega-caps and not the performance of the other 490ish stocks. $RSP is down about 6% since August, and small caps (RUT) are off 7%. Helene Meisler says that investors are getting complacent, and I don’t disagree.
So, how are bonds doing? The Safe Haven Demand indicator includes treasuries, while the Junk Bond Demand indicator is corporate-focused, high-yield corporates ($HYG) vs. investment-grade ($LQD), so the treasury decline isn’t reflected there. What we see is that stocks are beating bonds. No surprise. Small surprise, however, is that Junk is beating Investment Grade. Not by much, and both are down, but Junk has the edge.
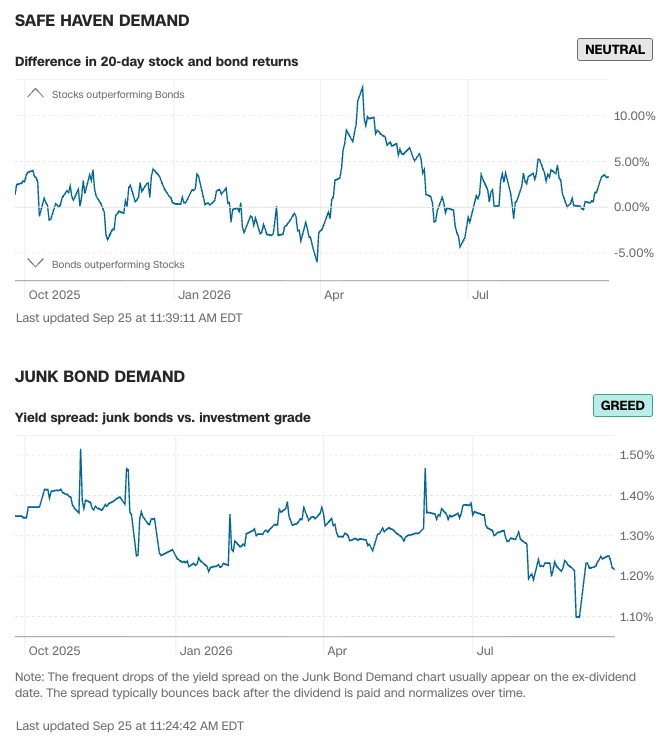
So, like Helene said, investors are complacent in the face of a market that is not holding up as well as the big-cap weighted indexes would have us believe.
Fear & Greed hasn’t been over 60 since last spring, and that’s my line in the sand. Until we can get above that level, stocks may rally, but it will likely be narrow and not be a healthy rally.
Bringing this back to the Diary, as Crazy1 said this morning, there could be some good tax loss harvesting opportunities this fall.
All charts are from CNN Business: https://www.cnn.com/markets/fear-and-greed
This commentary was originally posted in the Daily Diary on TheStreet Pro.
It’s been a while since I provided an update on CNN’s (mine) Fear & Greed Index. So, let’s do it!
The headline number of 38 is 11 points off the low of 27 set on 9/16. The stock market is up a bit in that time, too, but are we feeling less fearful? The stocks that drove those gains are the same ones we’ve all been focused on this year, the mega-cap techs. Specifically, $NVDA, $META, & $AAPL. Not all of the big names have been participating, though. In fact, NVDA, while it did rally off the 9/16 low, is still stuck, having set its yearly high in May.
Overall, breadth remains narrow, with net new 52-week lows dominating new highs by a big margin on the NYSE. Downside volume has swamped upside volume, too. As a result, even though the S&P 500 is near all-time highs, it’s gone sideways for the last 6 weeks.
The options indicators have gone sideways and show no fear. They seem to reflect only the performance of the mega-caps and not the performance of the other 490ish stocks. $RSP is down about 6% since August, and small caps (RUT) are off 7%. Helene Meisler says that investors are getting complacent, and I don’t disagree.
So, how are bonds doing? The Safe Haven Demand indicator includes treasuries, while the Junk Bond Demand indicator is corporate-focused, high-yield corporates ($HYG) vs. investment-grade ($LQD), so the treasury decline isn’t reflected there. What we see is that stocks are beating bonds. No surprise. Small surprise, however, is that Junk is beating Investment Grade. Not by much, and both are down, but Junk has the edge.
So, like Helene said, investors are complacent in the face of a market that is not holding up as well as the big-cap weighted indexes would have us believe.
Fear & Greed hasn’t been over 60 since last spring, and that’s my line in the sand. Until we can get above that level, stocks may rally, but it will likely be narrow and not be a healthy rally.
Bringing this back to the Diary, as Crazy1 said this morning, there could be some good tax loss harvesting opportunities this fall.
All charts are from CNN Business: https://www.cnn.com/markets/fear-and-greed
During a volatile week, we updated the Portfolio’s shopping list, and locked in a sizable tech gain.
The reason is not that the market is fine. The damage is hidden.
Rumors of a potential deal to open the Strait of Hormuz lifted stocks out of the red, but another rise in yields and oil prices kept them under pressure.