What Would a Blue-Wave Victory Mean for Asian Investors?

Here’s my prediction for the outcome of today’s elections, and how the Trump administration will respond if it’s dealt a setback.
Here’s my prediction for the outcome of today’s elections, and how the Trump administration will respond if it’s dealt a setback.
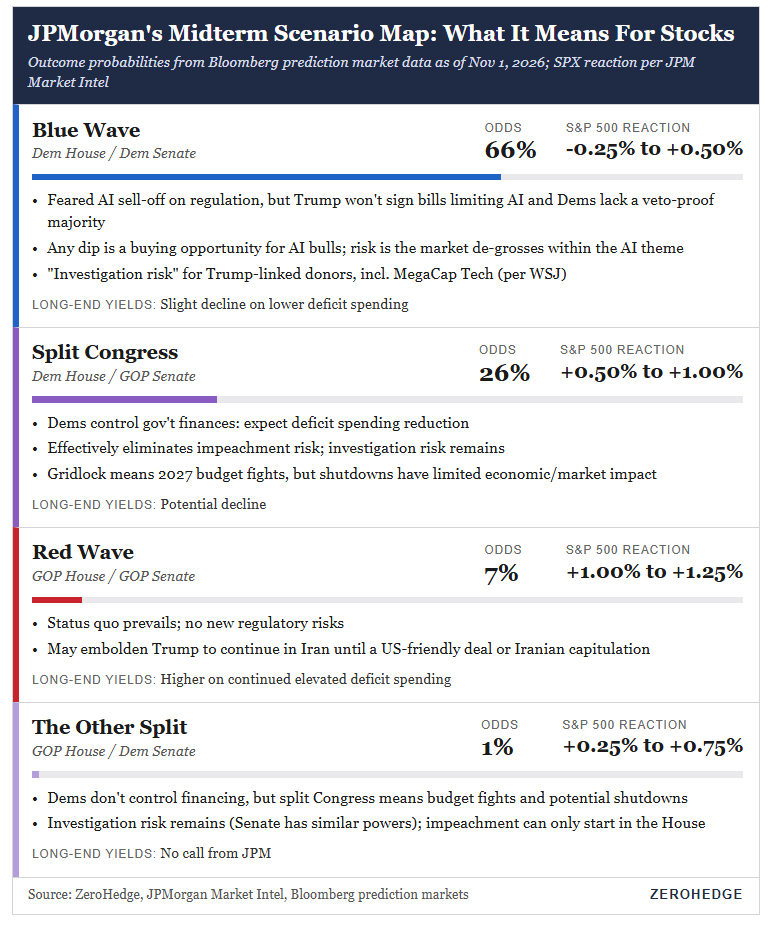
Just for fun, here are the thoughts from JPMorgan’s trading desk via ZeroHedge:
Blue Wave (Dem House / Dem Senate), 66% odds: S&P 500 ranges from down 0.25% to up 0.50%. The feared AI sell-off on regulation is likely limited because Trump won’t sign bills restricting AI and Dems lack a veto-proof majority. JPM sees any dip as a buying opportunity for AI bulls, with the main risk being de-grossing within the AI theme. There’s also “investigation risk” for Trump-linked donors, including megacap tech. Long-end yields are seen slightly lower on reduced deficit spending.
Split Congress (Dem House / GOP Senate), 26% odds: S&P 500 up 0.50% to 1.00%. Dems control government finances, so JPM expects deficit spending to come down. Impeachment risk is effectively gone, but investigation risk remains. Gridlock points to 2027 budget fights, though shutdowns have had limited economic and market impact. Long-end yields could decline.
Red Wave (GOP House / GOP Senate), 7% odds: S&P 500 up 1.00% to 1.25%. The status quo holds with no new regulatory risks. This outcome may embolden Trump to stay the course in Iran until there’s a US-friendly deal or Iranian capitulation. Long-end yields move higher on continued elevated deficit spending.
The Other Split (GOP House / Dem Senate), 1% odds: S&P 500 up 0.25% to 0.75%. Dems don’t control financing, but a split Congress still means budget fights and possible shutdowns. Investigation risk remains because the Senate has similar powers, while impeachment can only start in the House. JPM makes no call on long-end yields.
The most likely outcome is also the weakest one for stocks. Even so, JPM’s worst case across all four scenarios is only a 0.25% decline
If you didn’t make it down to the end of the Week Ahead this week (The Week Ahead – Apple, Midterms and Jobs Test a Market on Edge), I mentioned that some caution on the post-midterm rally everyone is expecting may be appropriate.
Based on a Truist composite chart of midterm seasonality since 1950, the S&P 500 is normally up only about 1% at the end of October, then finishing up about 5%. This year, though, the S&P 500 was already up 10.7% through October.
Bulls, though, can argue that while equities generally rise from the start of October into the election, in this case they are down approximately 3.5% from the October peak.

