SOX Faces Major Test After Relief Rally


Is it still the semis’ world and we’re just living in it? It seems that it is. Just take a look at how, as soon as the semis started rallying on Friday, the others started backing off. It’s clear that these charts cannot work and play well together!
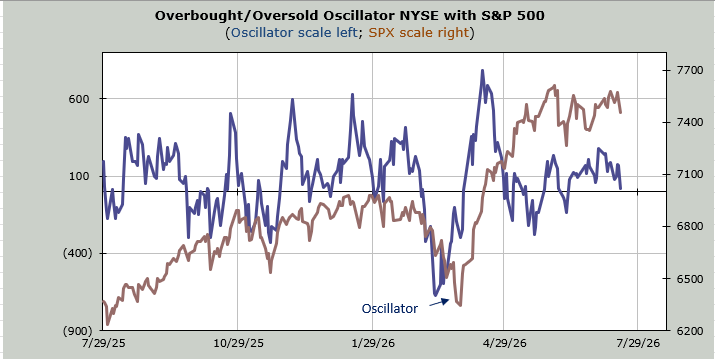
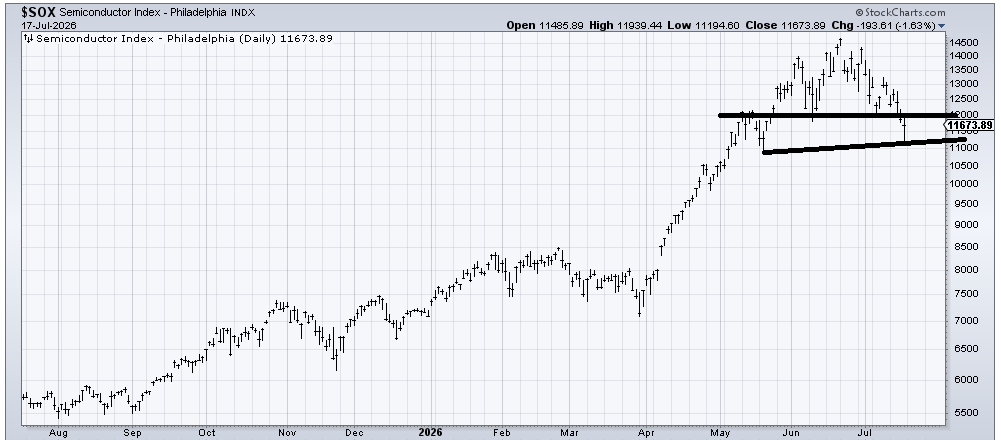
We are now officially at nine weeks of hovering in this 7,500 area on the S&P. And the ($SOX) is still trading where it was in late May. But on Friday it broke — and bounced — off the mid-May low. Was there hysteria? I’m still not sure.
Maybe there was minor hysteria, but the midday bounce would have had folks less panicked and more breathing a sigh of relief. In any event, just using the chart, we look to see if there is any followthrough. Can the SOX get back over 12,000 since that is now resistance?
Sentiment-wise I still think there is a high level of complacency. While I expect that, when we see the various surveys released this week, they will have backed off from their complacency and knocking on giddy doors, they will not show fear. At least I don’t think so.
For that, I look to the put/call ratio, which climbed to .97 on Friday. That is a step toward bearishness but consider that on July 8 this reading was 1.03 and back on June 26, when the SOX was still over 14,000 (15% higher than now), it was 1.12. Heck, the equity put/call ratio zipped right up that day to .85. On Friday it was elevated but only .73.
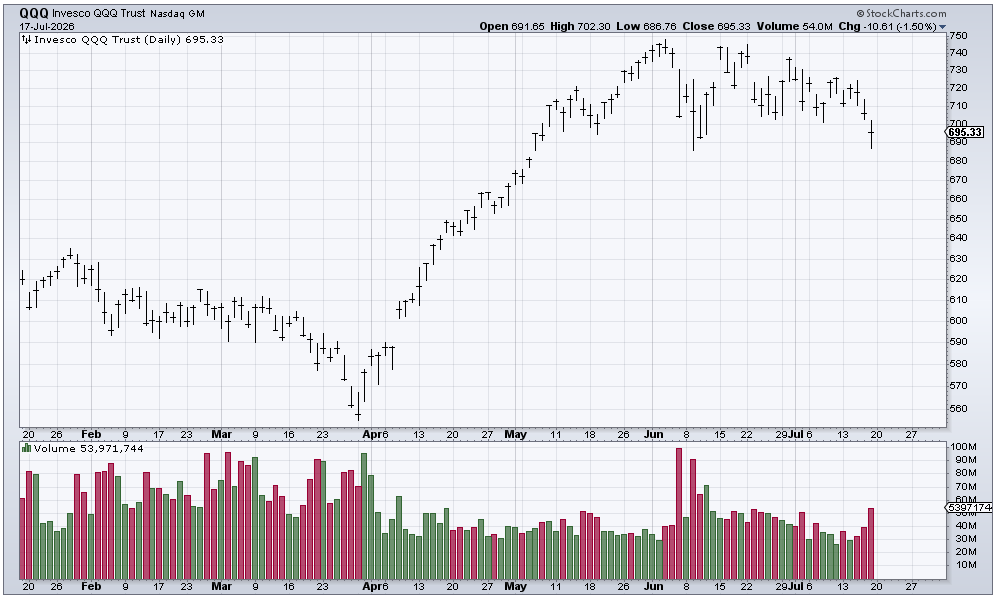
I also look toward the volume. The volume in the QQQs finally lifted on Friday to just over 50 million shares. Compare that, though, to the two days of 90 million shares traded in early June — that was panic. This is more like concern.
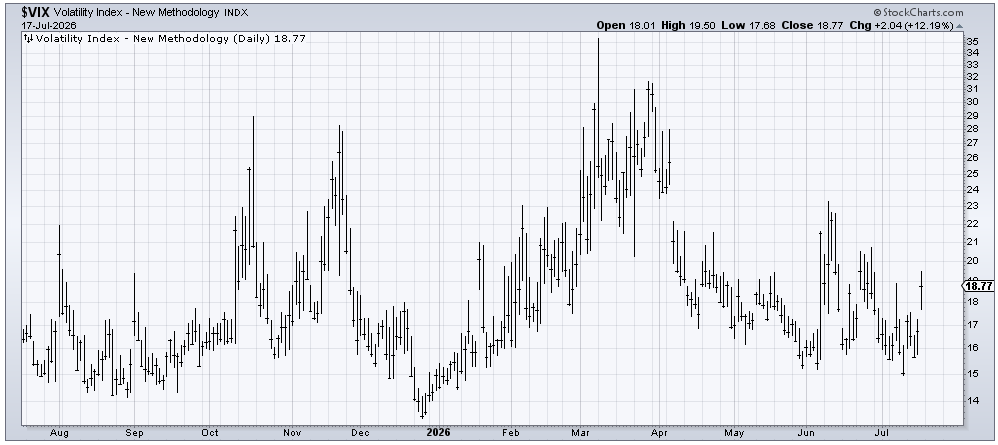
And what of the VIX? It has not gotten jumpy yet. At least it is showing some signs of heading in that direction though, having lifted from 15 to nearly 19 last week. Again, if we are comparing it to early June, the VIX got over 23 then.
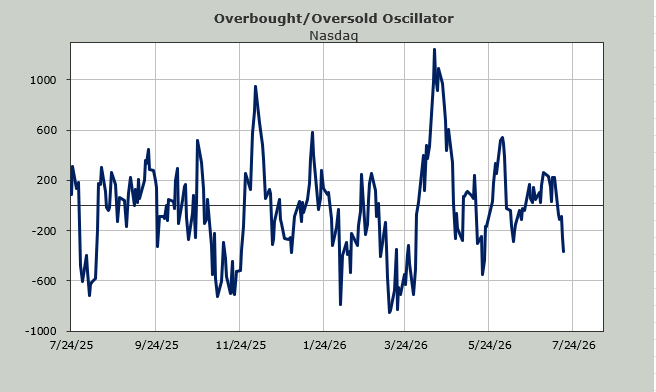
Speaking of volume, the Nasdaq McClellan Summation Index, where I use volume instead of the advance/decline line, now needs a net differential of +11 billion shares to halt its decline. Considering that Nasdaq trades approximately 8 billion to 9 billion shares a day, this tells us that net volume on Nasdaq would have to be super duper for at least two consecutive days just to get the indicator to stop declining. That’s what makes it oversold.
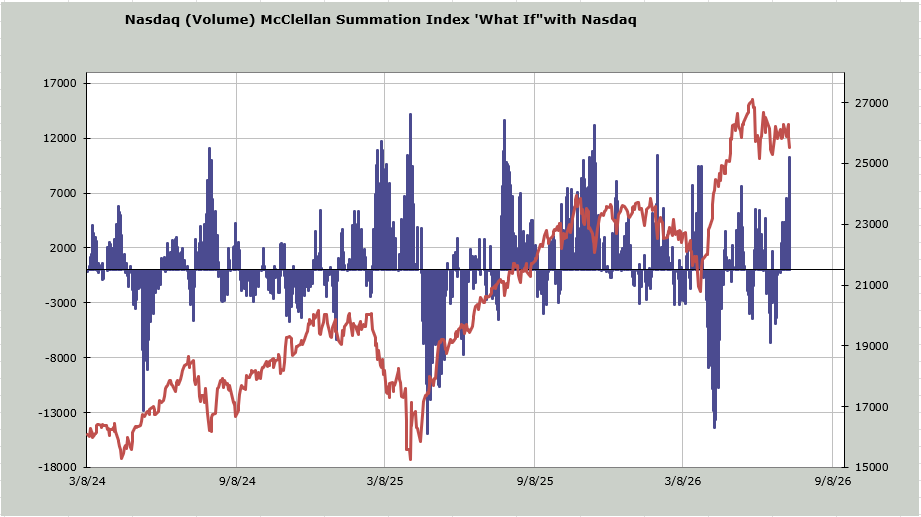
I like it when we have an oversold condition and some fear and/or panic in the market. Perhaps the market rallies early in the week and comes back down to give us some panic. Or maybe it just slides to give us some panic (and become more oversold). The sentiment needs to catch up to the oversoldness. We are probably headed there. If not, this nine weeks of 7,500 back and forth is going to stay with us.