Q3 GDP Beats on Strong Consumers and Equipment Spending

- US GDP Annualized (Q/Q) Q3 A: 3.4% (est 3.2%; prev 2.2%)
- – Personal Consumption: 3.8% (est 3.4%; prev 3.8%)
- – GDP Price Index: 2.3% (est 3.2%; prev 6.1%)
- – Core PCE Price Index (Q/Q): 2.5% (est 2.4%; prev 3.3%)
Executive Summary
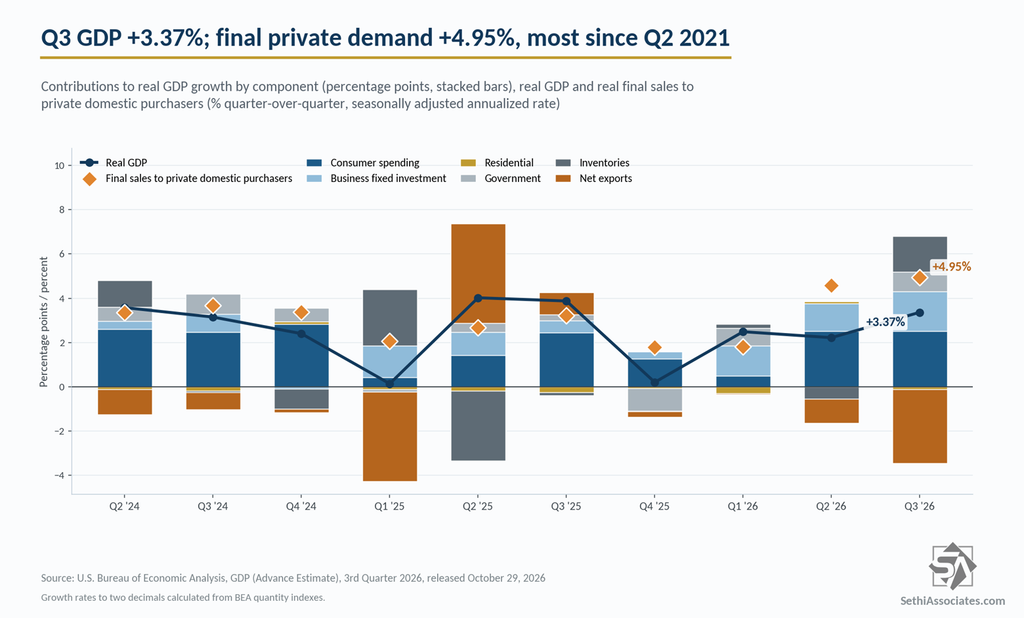
- Third-quarter real GDP grew at a 3.37% annualized rate, above the 3.2% consensus and up from an unrevised 2.22% in the second quarter. It was the fastest pace since Q3 2025. Year-over-year growth though eased to 2.07% from 2.19%.
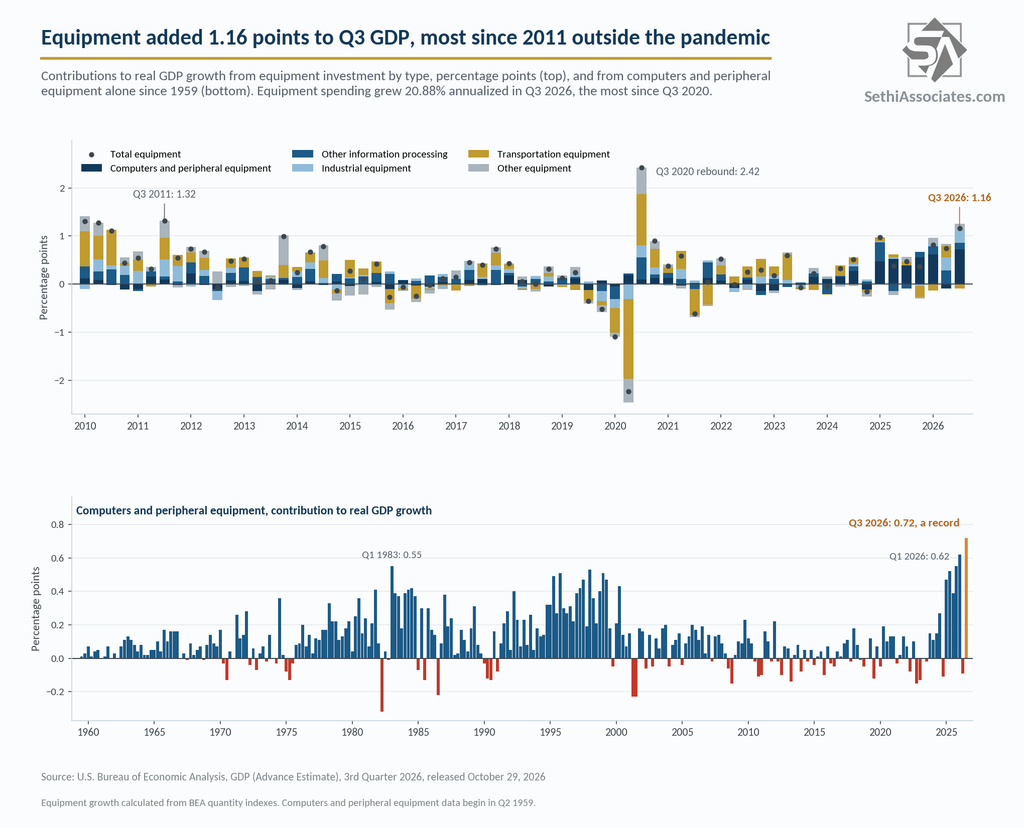
- Investment added 3.27 percentage points, led by a 1.61-point boost from inventories and equipment spending that grew 20.88%, the most since Q3 2020. Computers and peripheral equipment alone added 0.72 point, the largest contribution on record in data back to 1959.
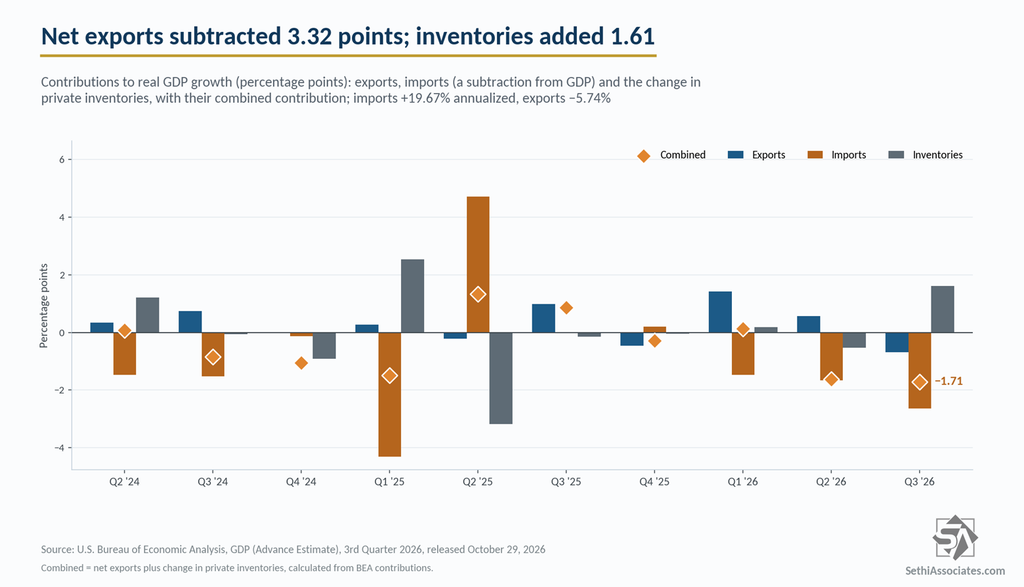
- Trade pulled the other way: imports jumped 19.67% and exports fell 5.74%, leaving net exports a 3.32-point drag, the largest since Q1 2025.
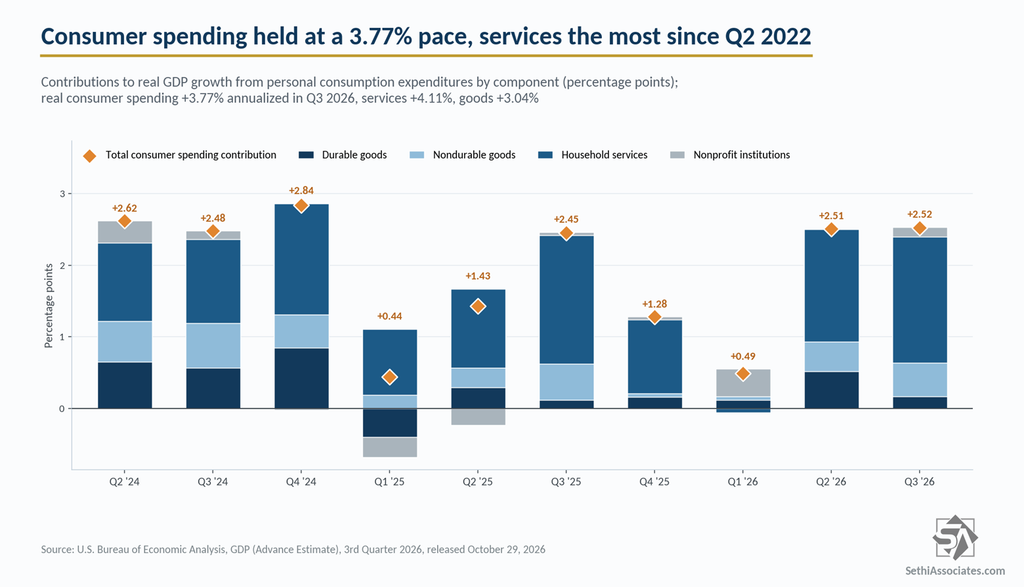
- Consumer spending grew 3.77%, matching the second quarter, with services up 4.11%, the most since Q2 2022.
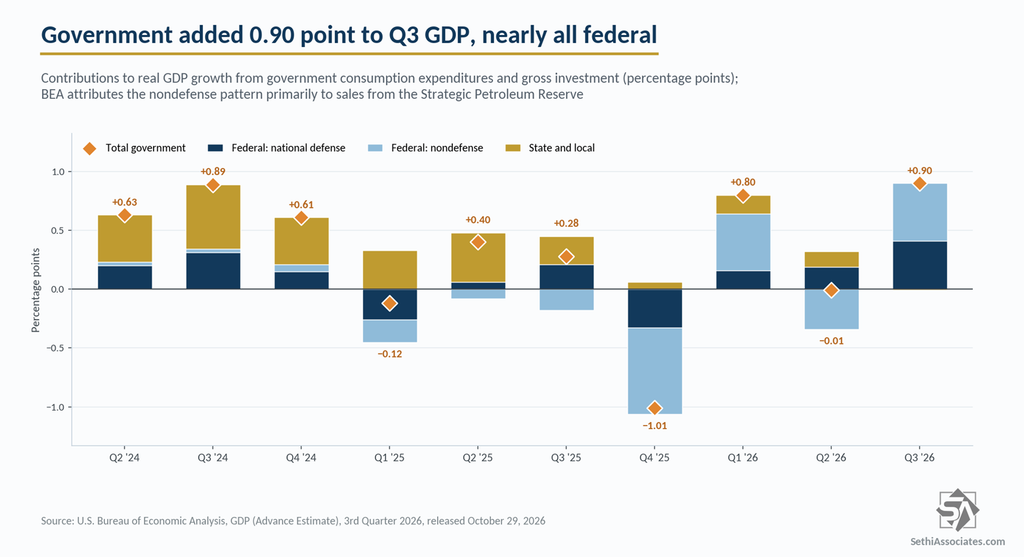
- Government added 0.90 point, nearly all federal, on defense spending and smaller sales from the Strategic Petroleum Reserve.
- Real final sales to private domestic purchasers, a metric often considered a cleaner indicator of underlying growth, rose 4.95%, the most since Q2 2021.
- Inflation cooled sharply. PCE prices rose 2.09% annualized after 5.01%, and core PCE rose 2.47% after 3.31%, both the least since Q3 2024. The GDP price index rose 2.27% against 3.2% expected.
- Real disposable personal income rebounded 2.30% after falling 0.18%, and is up 1.26% year-over-year. The personal saving rate though fell to 4.1%, the lowest since Q4 2022.
Third-Quarter GDP
Real GDP grew 3.37% annualized in the third quarter, the most since Q3 2025, beating the 3.2% consensus, according to the advance estimate from the Bureau of Economic Analysis. That’s up from 2.22% in the second quarter, which was unrevised. Compared with the third quarter of 2025, though, growth was more modest at 2.07%, down from 2.19% in the second quarter.
Notably, the print came in pretty much dead in line with the expectations I noted this morning from the GDP trackers I follow.
Consumer Spending
Consumer spending contributed 2.52 percentage points to GDP, matching the second quarter’s 2.51, as real spending grew 3.77% annualized, the same pace as in the second quarter. Year-over-year, consumer spending is up 2.53%.
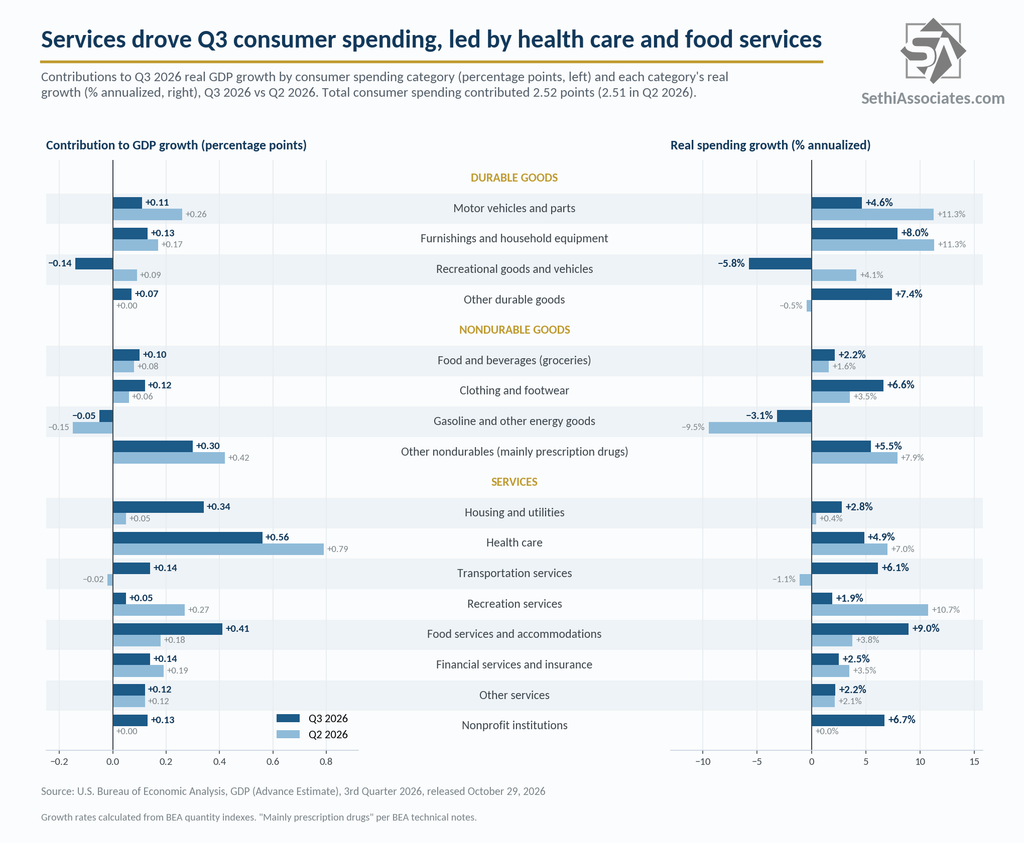
Services contributed 1.89 points, the most since Q2 2022, up from 1.57 in the second quarter, with services spending up 4.11%, also the most since Q2 2022. Household consumption expenditures for services contributed 1.76 points, up from 1.57. Per the BEA, the increase “was led by health care (mainly hospitals and outpatient services) … and food services and accommodations (mainly purchased meals and beverages).”
In that respect, health care added 0.56 point, down from 0.79. Food services and accommodations added 0.41 point, up from 0.18, on spending growth of 8.96%, the most since Q2 2022. Housing and utilities added 0.34 point (from 0.05), transportation services 0.14 point (after a 0.02-point drag), financial services and insurance 0.14 point, other services 0.12 point and recreation services 0.05 point (from 0.27). Final consumption expenditures of nonprofit institutions added 0.13 point.
Goods contributed 0.63 point, down from 0.94, with goods spending up 3.04% after 4.54%.
Durable goods added 0.17 point, down from 0.52, as durables spending slowed to 2.29% from 7.36%. Furnishings and durable household equipment added 0.13 point, motor vehicles and parts 0.11 point (from 0.26) and other durable goods 0.07 point. Recreational goods and vehicles subtracted 0.14 point, the largest drag since Q3 2021, on a 5.77% decline.
Nondurable goods added 0.47 point, up from 0.41, on growth of 3.44%. Per the BEA, the goods increase “was led by other nondurable goods (mainly prescription drugs),” which added 0.30 point. Clothing and footwear added 0.12 point and food and beverages 0.10 point, while gasoline and other energy goods subtracted 0.05 point.
Business and Residential Investment
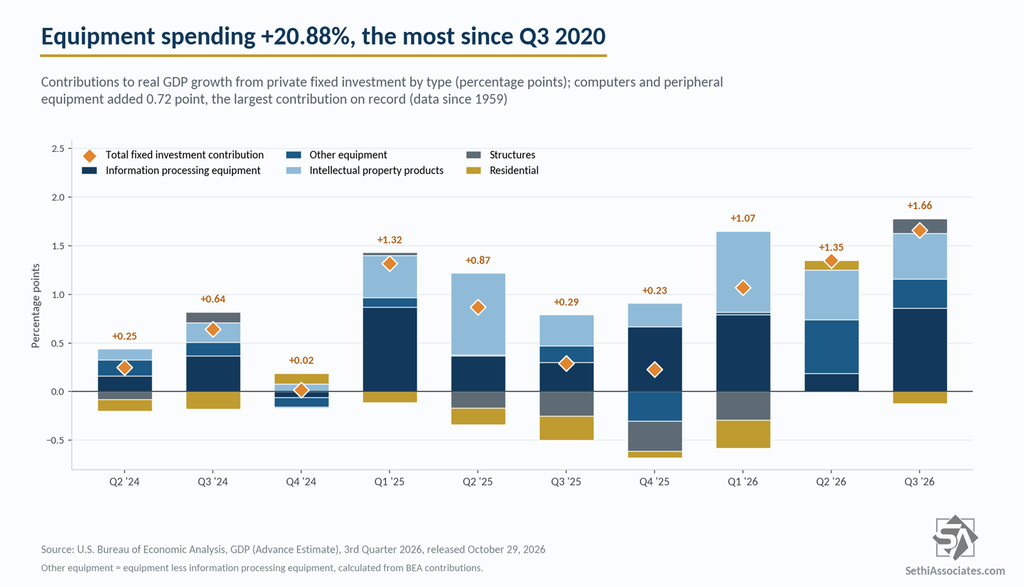
Gross private domestic investment contributed 3.27 percentage points, the most since Q1 2025, up from 0.82, with fixed investment +1.66 points and the change in private inventories +1.61 points (meaning inventories increased).
Fixed investment contributed 1.66 points, up from 1.35, on growth of 9.38%, the most since Q4 2020. It consists of nonresidential and residential investment.
Nonresidential (business) fixed investment contributed 1.78 points, up from 1.25, on growth of 12.73%, the most since Q3 2020. Year-over-year, business investment is up 8.37%, the most since Q2 2023. It is made up of three subcategories, structures, equipment and intellectual property products, whose contributions sum to the nonresidential total:
Equipment contributed 1.16 points, the largest contribution since Q3 2011 outside the pandemic rebound in Q3 2020, as Bloomberg also noted, up from 0.74. Equipment spending grew 20.88%, the most since Q3 2020, and is up 14.08% year-over-year, the most since Q2 2021. Per the BEA, the increase “was led by information processing equipment (mainly computers and peripheral equipment).” Information processing equipment added 0.86 point, up from 0.19, on growth of 37.36%. Computers and peripheral equipment added 0.72 point, the largest contribution on record in data back to 1959, after a 0.09-point drag, on growth of 66.7%. Industrial equipment added 0.27 point, other information processing equipment 0.14 point and other equipment 0.12 point, while transportation equipment subtracted 0.09 point.
Intellectual property products contributed 0.47 point, down from 0.51, on growth of 8.40%, comprising software (0.23 point), research and development (0.21 point) and entertainment, literary and artistic originals (0.03 point).
Structures contributed 0.15 point, after a flat second quarter, on growth of 5.39%, the most since Q4 2023.
Residential fixed investment though subtracted 0.12 point after adding 0.10 point in the second quarter, on a 3.34% decline.
The change in private inventories added 1.61 points after subtracting 0.53 point in the second quarter, the largest contribution since Q1 2025 (businesses added to inventories). Nonfarm inventories added 1.56 points and farm inventories 0.04 point. Per the BEA, “the largest contributors to the increase in private inventory investment were wholesale trade and manufacturing (both led by nondurable goods industries).”
Trade
Net exports subtracted 3.32 percentage points from GDP, the largest drag since Q1 2025, after 1.10 points in the second quarter, as both a decline in exports (−0.68 point) and a jump in imports (−2.64 points) weighed. Imports are a subtraction because they are production made elsewhere that needs to be netted out of the other categories.
Exports fell 5.74% annualized, the steepest decline since Q2 2020, after rising 5.04% in the second quarter. Goods exports subtracted 0.57 point on a 7.39% decline, and per the BEA interestingly the decrease was “led by petroleum and related products.” Services exports subtracted 0.10 point.
Imports rose 19.67%, the most since Q1 2025, after 12.58% in the second quarter. Goods imports subtracted 2.77 points on growth of 26.38%, and per the BEA, “the largest contributor to imports was capital goods, except automotive.” Services imports added 0.13 point as they declined 4.20%.
Combined, net exports and inventories subtracted 1.71 points from GDP.
Government
Government contributed 0.90 percentage point to GDP after a 0.01-point drag in the second quarter, with spending up 5.28% annualized, the most since Q3 2023. Per the BEA, the increase “was more than accounted for by federal government spending, led by nondefense consumption expenditures.” Federal spending added 0.91 point, while state and local subtracted 0.01 point.
Federal spending grew 15.78%, the most since Q1 2021. National defense added 0.41 point (consumption expenditures 0.24 point, gross investment 0.17 point), with defense spending up 11.69%, the most since Q4 2020. Nondefense added 0.49 point (consumption expenditures 0.46 point, gross investment 0.03 point).
Per the BEA, “the pattern of nondefense spending primarily reflected sales of crude oil from the Strategic Petroleum Reserve … Within the National Economic Accounts, sales are deducted from government consumption expenditures. In the third quarter, sales from the Strategic Petroleum Reserve were less than sales in the second quarter, resulting in an increase in consumption expenditures. Because the oil sold by the government is reflected as an increase in other components of GDP, there is no direct effect on GDP.”
State and local spending slipped 0.1%, the first decline since Q2 2022, with consumption expenditures adding 0.03 point and gross investment subtracting 0.03 point.
Prices
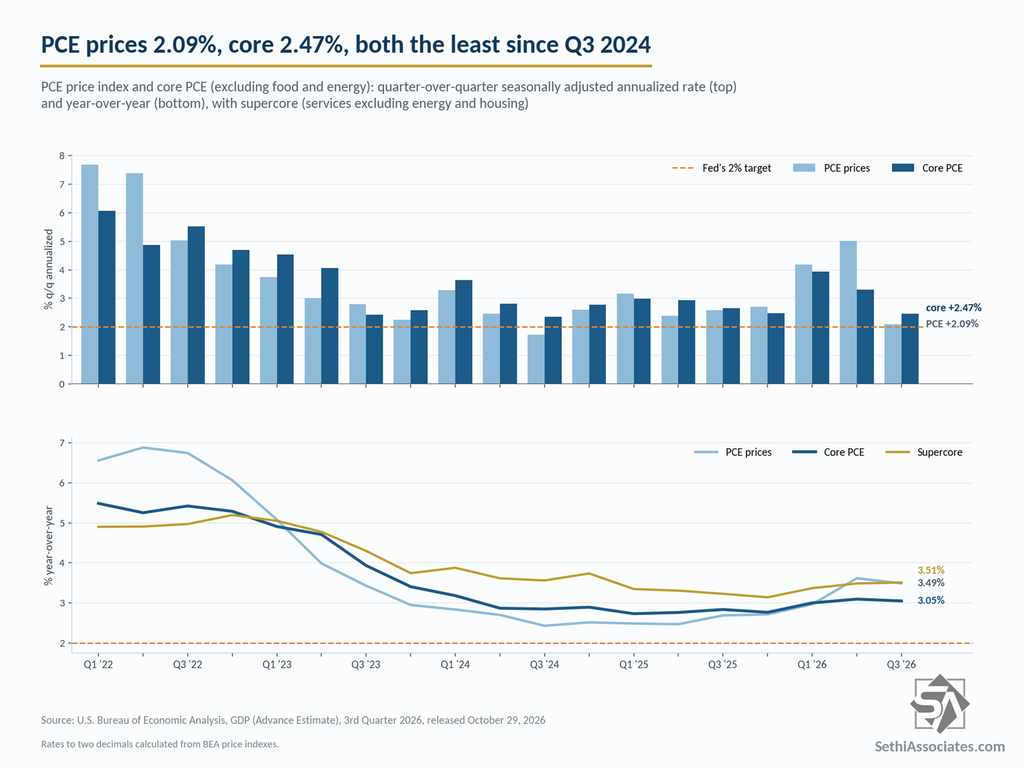
PCE prices rose 2.09% annualized, down from 5.01% in the second quarter and the least since Q3 2024, while core PCE (excluding food and energy) rose 2.47%, down from 3.31% and also the least since Q3 2024. Core came in a touch above the 2.4% consensus. The gross domestic purchases price index (inflation across the broader economy) rose 2.99% after 5.56%, and the GDP price index 2.27% after 6.10%, the least since Q2 2025 and well below the 3.2% expected.
Energy reversed. PCE energy goods and services prices fell 3.37%, the first decline since Q2 2025, after a 60.17% surge in the second quarter, with gasoline and other energy goods down 4.78% after 114.29%. Year-over-year, gasoline is still up 29.39% and energy 17.79%.
That pulled down goods prices to 0.50% after 7.60%, with durables up 2.14% and nondurables down 0.38%. Recreational goods and vehicles prices though rose 8.99% and are up 7.38% year-over-year, the most since Q2 1975. Motor vehicles and parts rose 1.82%, while furnishings fell 3.68% and clothing and footwear 0.25%. Food prices rose just 0.49%, the least since Q2 2024.
Services prices rose 2.81% after 3.86%, the least since Q4 2020. Transportation services led at 9.6% and are up 8.26% year-over-year, the most since Q1 2023. Other services rose 4.08%, financial services and insurance 3.18%, housing and utilities 2.7% and health care 2.44%. Food services and accommodations prices rose 1.76%, the least since Q2 2020, and recreation services 0.13%, the least since Q4 2014. Supercore (services excluding energy and housing) rose 2.89% after 3.59%.
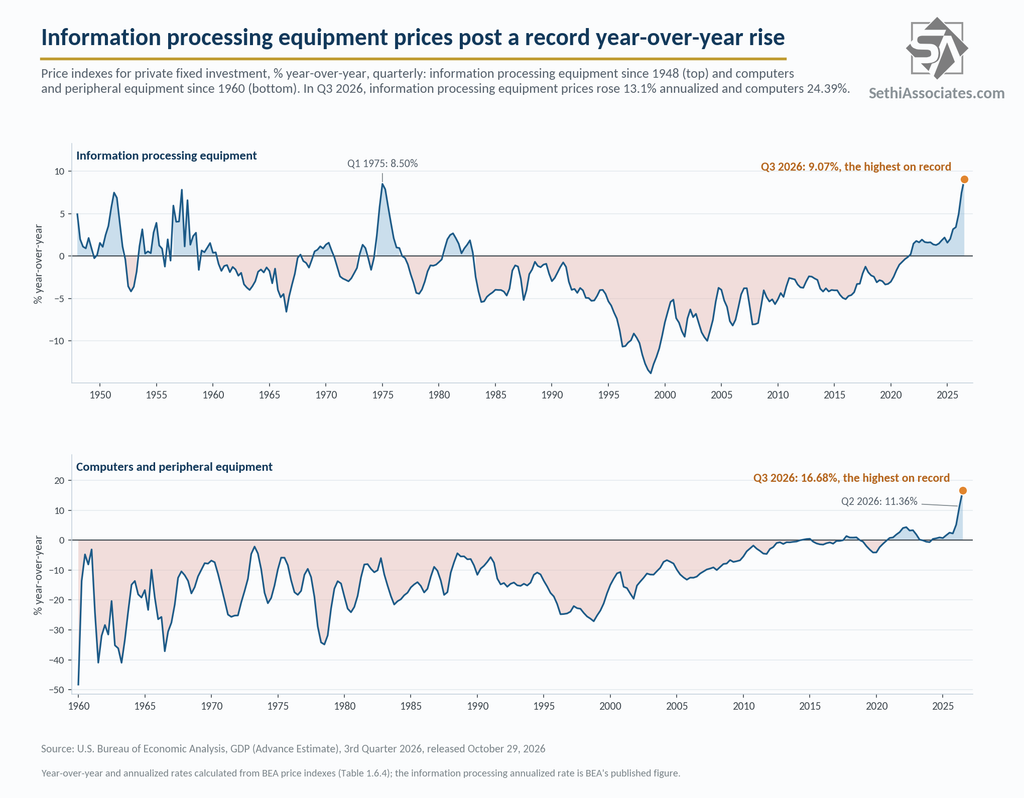
Information processing equipment prices though rose 13.1% and are up 9.07% year-over-year, the highest in data back to 1948, with computers and peripheral equipment up 16.68% year-over-year, the highest in data back to 1960.
Federal government prices rose 3.39% (national defense 3.30%, nondefense 3.53%), and state and local prices 6.3%, up 7.17% year-over-year, the most since Q3 2022.
On a year-over-year basis, prices remain well above the Fed’s 2% target. PCE prices are up 3.49% (from 3.62%), core PCE 3.05% (from 3.10%), supercore 3.51% (the most since Q4 2024) and the GDP price index 3.73% (from 4.02%). Market-based core PCE is up 3.01%. Goods prices are up 3.62% year-over-year and services 3.43%.
Real Final Sales to Private Domestic Purchasers
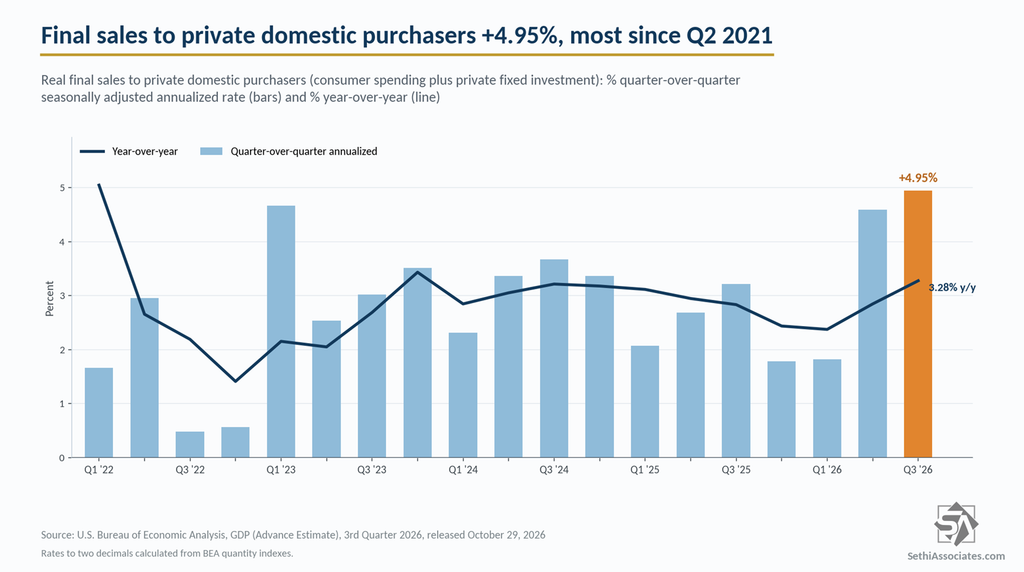
Another measure often used to gauge the strength of consumption from the GDP report is “real final sales to private domestic purchasers,” a measure of underlying growth trends favored by economists that combines consumer spending and gross private fixed investment. It accelerated to 4.95% annualized, the most since Q2 2021, from 4.59% in the second quarter. Year-over-year, it is up 3.28%, the most since Q4 2023.
Real Disposable Personal Income and Saving
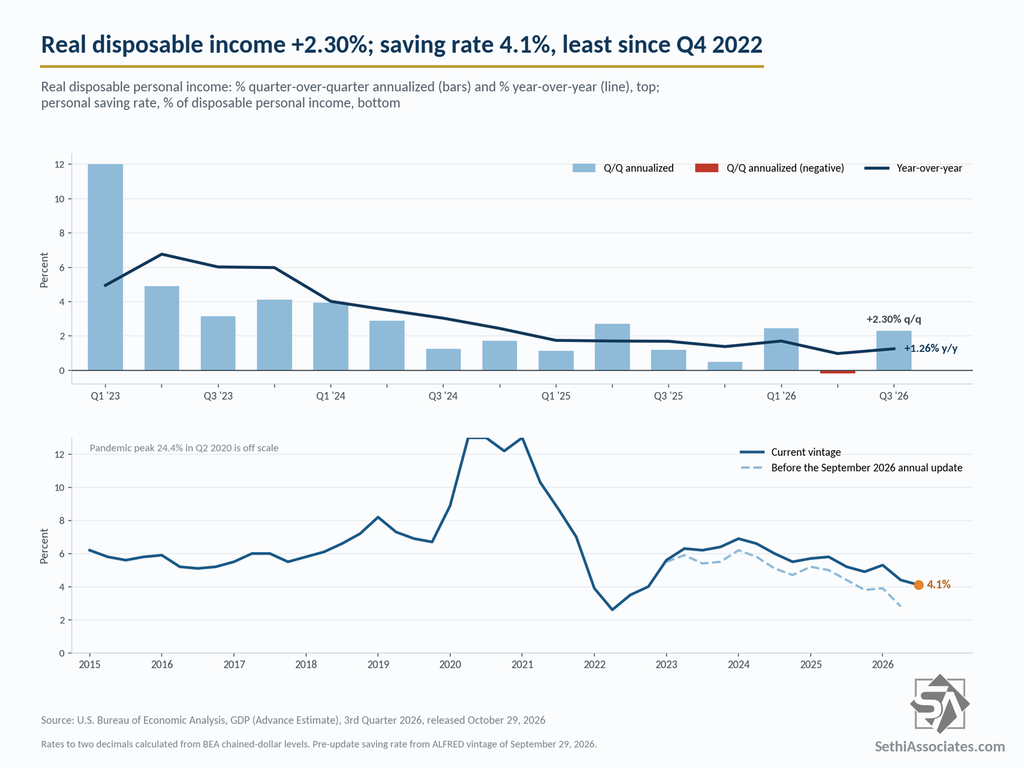
Another important metric from the GDP report is real disposable personal income, aggregate national personal (non-corporate) income adjusted for inflation and taxes. It rose 2.30% annualized after falling 0.18% in the second quarter (not adjusted for inflation, up 4.43%). Year-over-year, it is up 1.26%, from 0.98% in the second quarter, and 1.01% per capita. Real personal income excluding transfer receipts rose 1.69%, the most since Q1 2025, and is up 0.81% year-over-year.
Compensation of employees though grew 3.43% annualized, the least since Q4 2022, with wages and salaries up 3.10%, also the least since Q4 2022.
Personal saving fell to $988.8 billion from $1,056.4 billion, lowering the personal saving rate to 4.1%, the lowest since Q4 2022, from 4.4% in the second quarter. Nominal personal outlays grew 5.87% annualized against disposable personal income growth of 4.43%. The second-quarter saving rate was revised up to 4.4% from 2.8% in BEA’s September 30 annual update, which raised the rate across recent quarters.
Analyst Commentary
The 3.4% print topped the 3.2% median in Reuters’ poll, where estimates ranged from 1.0% to 4.2%, and the 3.1% The Wall Street Journal survey expected. The Journal noted it was the fastest pace in a year and the last major reading on the economy before Tuesday’s midterm elections.
Eric Winograd, senior economist for fixed income at AllianceBernstein, told the Financial Times: “It looks like a strong quarter driven by domestic demand activities and a drag from trade … We talk about the boost to growth from AI, but a lot of that stuff is imported.”
Reuters reported that “given the increasing dominance of AI-related spending, some economists said the strong GDP growth was probably not a true picture of the economy,” and that “households also have been saving less and dipping into their nest eggs to fund spending.” The Journal pointed out that with inflation up and wage growth down, average real hourly earnings have fallen for six straight months.
Jim Bianco, president of Bianco Research, told the Financial Times: “The more interesting number is the inflation number, which was hotter than expected . . . I’ll revisit my question from yesterday: why didn’t the Fed hike rates again?”
At Wednesday’s press conference, Fed Chair Kevin Warsh said “economic growth has strengthened,” adding, per Bloomberg, “While uncertainty remains, owing in part to geopolitical developments, domestic spending has been resilient. Productivity growth is strong, and capital investment robust.” On whether the economy is running too hot, he said “That isn’t the judgment of most of my colleagues,” according to the Journal.
Bloomberg also cited United Parcel Service ($UPS) Chief Executive Carol Tomé on this week’s earnings call: “As long as the employment rate stays fairly stable … consumers are going to spend because they have assets,” though she noted those without assets are stretched.
All data are from the BEA’s advance estimate of third-quarter GDP. Charts by Sethi Associates from BEA data.