AI Names Crater, Average Stocks Rise in Dramatic Rotation

The gap is closing, but the opportunity is in new leaders, not broken AI names.
The gap is closing, but the opportunity is in new leaders, not broken AI names.
Position: None
AI demand is pulling through across sectors, but supply constraints remain a headwind.
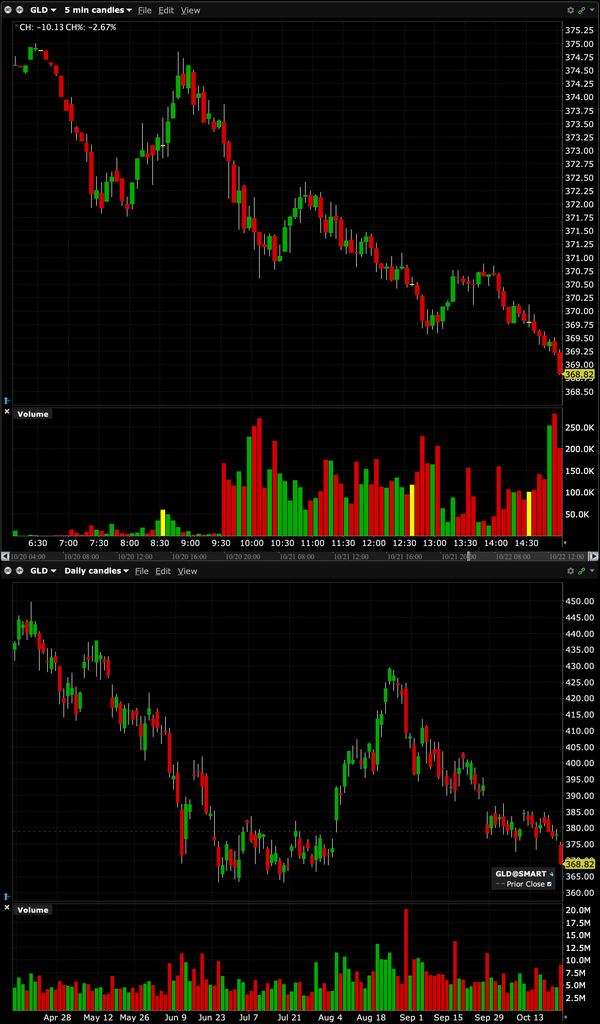
$GLD: (intraday and daily chart)
Position: None
* No more detours!
Here is the judge’s order and his decision on not reopening the rescheduling hearing:
From Marijuana Moment:
Here is The Dales Report’s summary:
In terms of timing, this likely represents a FINAL delay of the rescheduling process and will probably lead to the judge’s recommendation in November:
“The parties are not being required to file any briefs on the matter, but are invited to submit initial filings by October 29 and any replies by November 5.” (Source: TDR)
Considering the lengthy time that cannabis investors have waited for a rescheduling decision this is not too punitive and will likely put a conclusion on the process shortly.
I am adding to $MSOS on the weakness.
Position: Long MSOS common (VL) and calls (VS)
Thus far today about 25 people were asked (on Fin TV) why Meta’s ($META) shares are trading much lower in the face of better results and strong forward guidance.
No one has clearly answered the question — just a bunch of B.S. and narratives (miles long but only inches deep).
From my perch these are the principal problems facing Meta, which help to explain the market’s reaction (stated simply):
* Meta disclosed the need for continued and large capital expenditures.
* Nonetheless, the company was uncertain of the timing and whether that AI spend would be monetized and whether the ROIC would be adequate relative to the spend.
* Meta’s balance sheet is debt laden with over $100 billion of balance sheet debt and over $700 billion off balance sheet.
* As a result, to fund the big AI capex, several hundred billions of dollars in equity has to be raised by the company.
We anticipated this need for a large raise — from yesterday:
Guesswork Only
My instincts tell me META beats consensus and offers good guidance.
And then it announces a primary offering of stock…
Position: None
BY Doug Kass · Oct 21, 2026, 3:30 PM EDT
From Ed Zitron following the EPS release:
Position: None
Almost all Asian markets are in the red, with many of the year’s top performers the major laggards.
Asaxelrod
I do not have any informed opinion on IQV but Josh Brown pitches every idea with such confidence because of charts and clearly doesn’t know much fundamentally. With IQV he says “I think it’s around a $25-26B market cap” when in fact it’s ~$46B! Okay one can make mistakes but as Doug reinforces so effectively the BS on CNBC is so cheerleader-oriented everyday with such little depth. I’ve managed money for nearly three decades and humility is key in this humbling business. I don’t think anyone on the Halftime Show embraces humility but they are all exceptionally gifted at promotional hype to gather assets. When (not IF) we have another 2022 (or perhaps 2000), I will look forward to witnessing some humility from the panelists but the expectation bar is low…
Position: None
I have spoken to several institutional desks.
The buying/strength is being exacerbated by machines and algos — in a changed market structure.
And I am using them as a source of liquidity — reducing $PG, $KO and $KMB.
Position: Long PG (VS), KO (VS), KMB (VS)
Position: None