Too Busy to Short

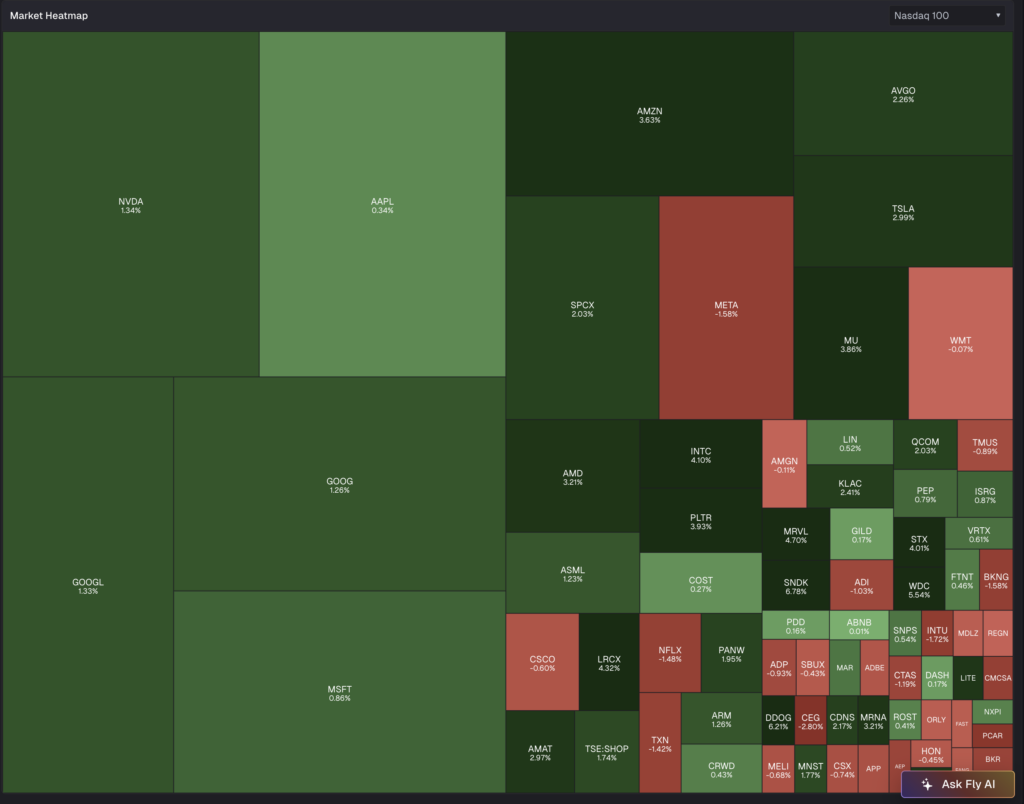
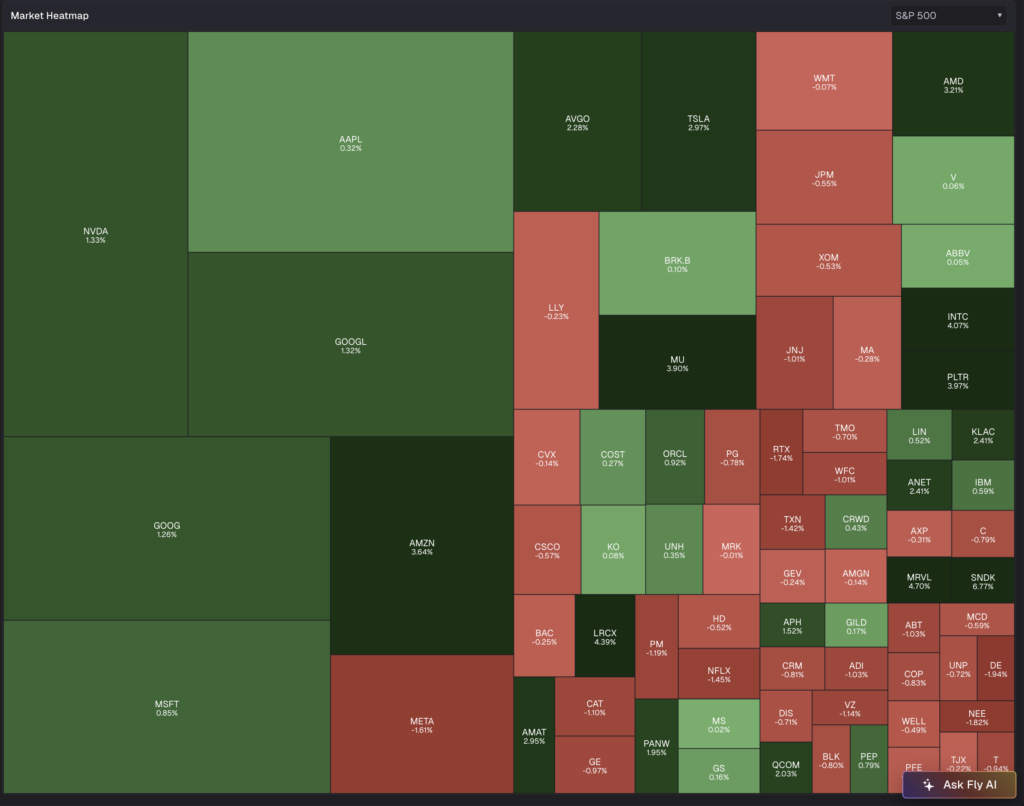
I should be shorting the indices on today’s ramp but am too involved in flushing out $GLAS and undertaking other research projects.
Position: Long GLAS (S)
I should be shorting the indices on today’s ramp but am too involved in flushing out $GLAS and undertaking other research projects.
Position: Long GLAS (S)
AI needs more than Nvidia chips. Here are the companies ‘powering’ the AI buildout.
We got a whiff of panic, now what if real fear pushes up the VIX?
From Peter Boockvar:
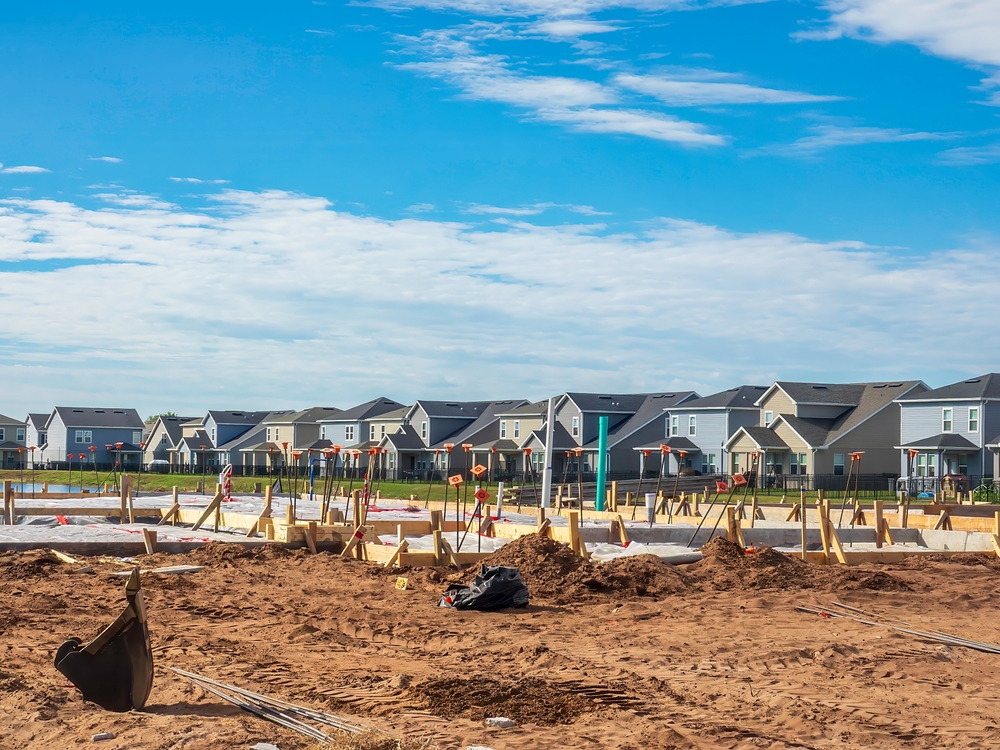
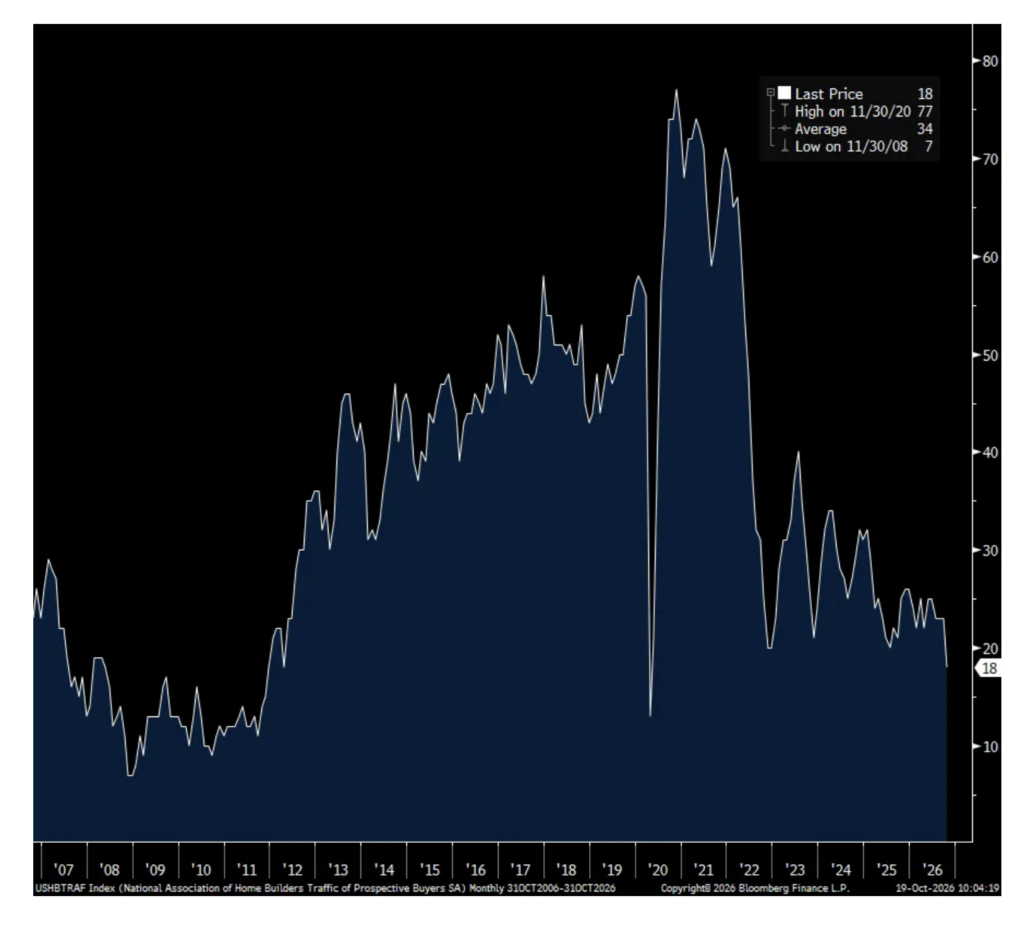
The October NAHB home builder sentiment index fell to just 29 from 32 vs the estimate of 31 and well below the breakeven of 50. Both the Present Situation and Future Outlook components slipped and Prospective Buyers Traffic declined to just 18 which is the lowest since 2012 not including Covid.
On the demand side, something we are clear on, “Mortgage rates have climbed well above 7% in recent weeks, and higher gas prices and inflation have further weakened buyer traffic across much of the country” said the NAHB.
With respect to delivering homes, builders are contending with “higher costs for construction loans, building materials and diesel.” Also, “Nationwide, more than one-third of builders reported immigration enforcement activity in their market areas during the past month, causing construction delays and discouraging legal workers from reporting to work.”
And what are builders doing to drive sales? “The latest HMI survey found that 43% of builders cut prices in October, the highest share during the 2020-2026 period. The average price cut remained at 6% for the seventh consecutive month. Meanwhile, 65% of builders reported using sales incentives in October, the 19th straight month at least 60% of builders have done so.”
Bottom line, the housing recession is getting even more difficult with the rise in mortgage rates. Unfortunately I see time as the only cure. The time needed for income growth to advance during a period of time where home prices flat line or fall to improve affordability that can allow the buyer better withstand higher rates.
NAHB
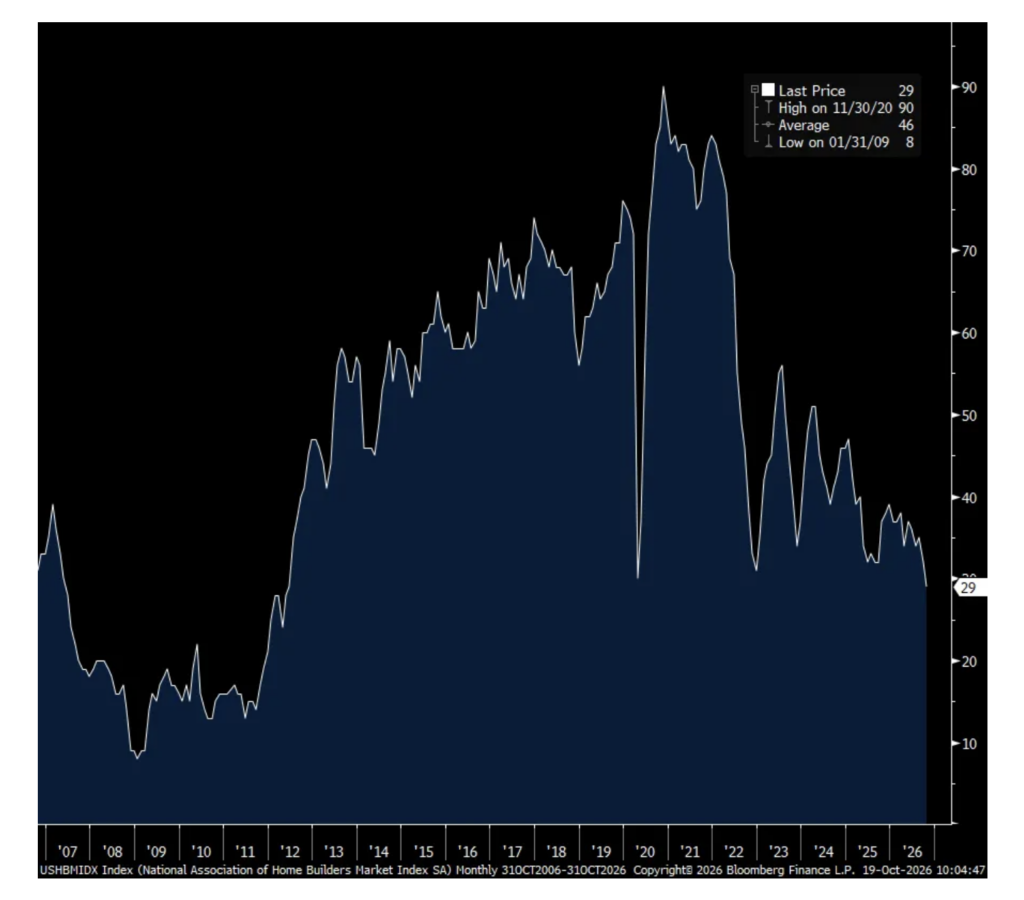
Prospective Buyers Traffic
Position: None
Position: None
A Wall Street analyst turned heads with a significant change of view on the tech firm.
NAHB’s Housing Market Index falls to 29 in October, with all three components also hitting multi-year lows even as 43% of builders cut prices.
Three things we’ll be listening for as the number of earnings season conference calls proliferate.
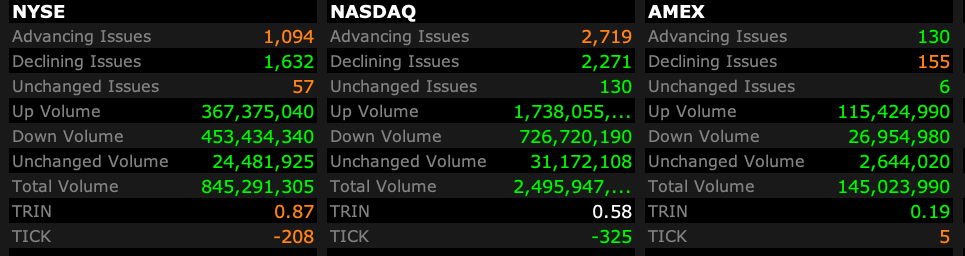
– NYSE volume 9% below its one-month average;
– Nasdaq volume 5% below its one-month average;
– VIX index: down 10.96% to 17.80
SOURCE: Interactive Brokers
SOURCE: Interactive Brokers
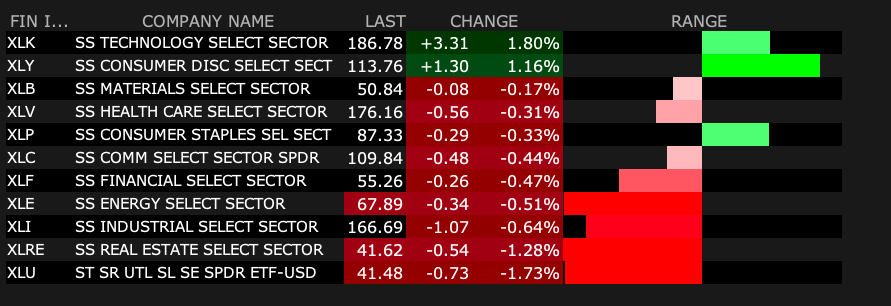
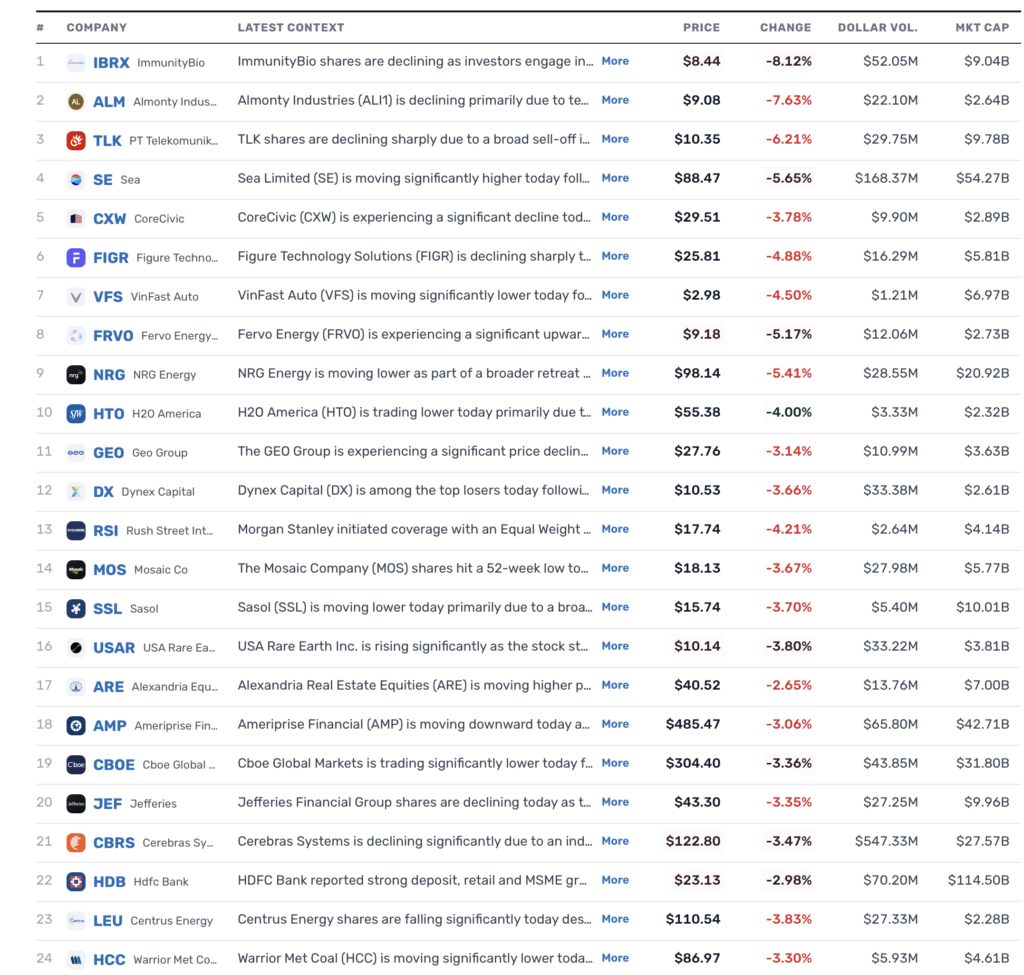
SOURCE: TheStreet Pro
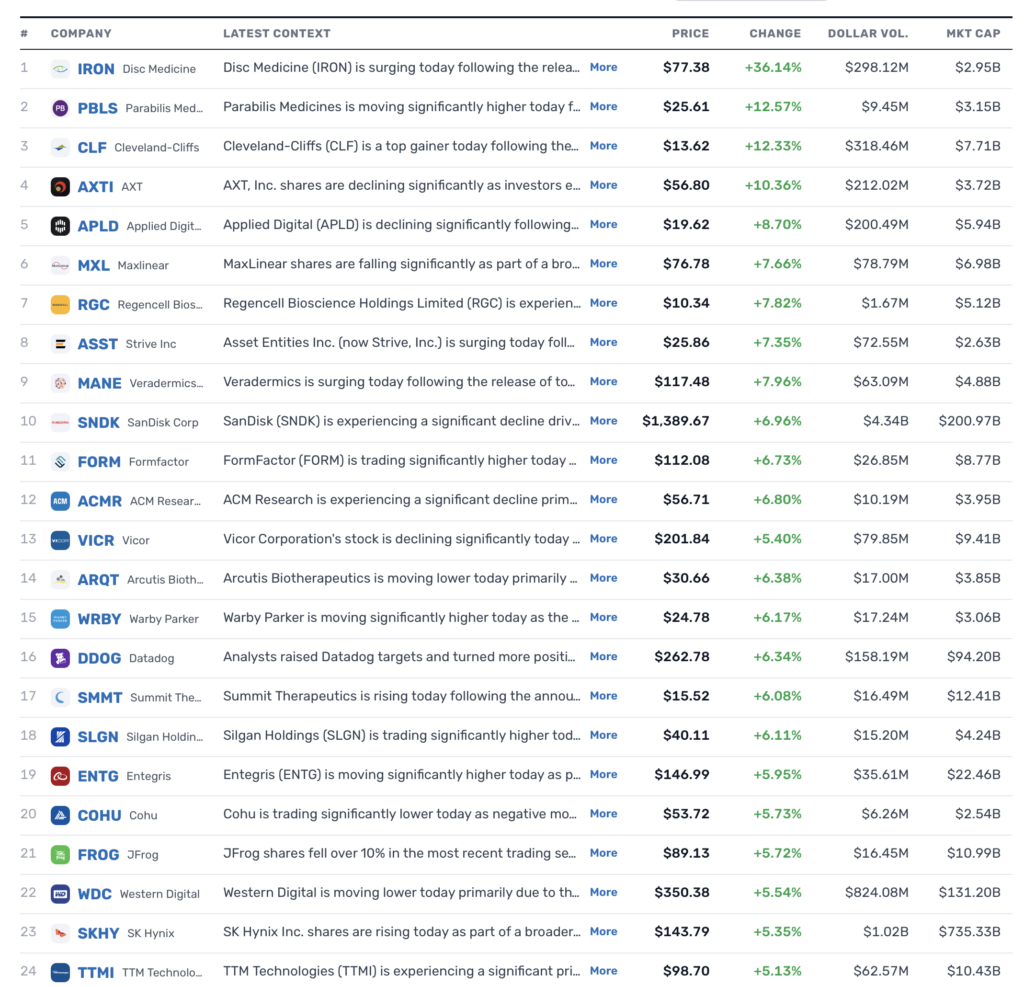
SOURCE TheFly