P&G and My Staples Plays

Procter & Gamble’s ($PG) beat will likely help collateral staples plays like PepsiCo ($PEP), Coca-Cola ($KO) and Kimberly-Clark ($KMB).
Position: Long PG (VS), KO (VS), KMB (VS)
Procter & Gamble’s ($PG) beat will likely help collateral staples plays like PepsiCo ($PEP), Coca-Cola ($KO) and Kimberly-Clark ($KMB).
Position: Long PG (VS), KO (VS), KMB (VS)
* Meta’s share price reversed hard last night and this morning…
As I forecast, Meta ($META) beat expectations and raised guidance. A share offering seems likely:
My instincts tell me META beats consensus and offers good guidance.
And then it announces a primary offering of stock…
Position: None
BY Doug Kass · Oct 21, 2026, 3:30 PM EDT
Ed Zitron responds skeptically to the release:
Position: None
* Calling an audible on Tesla short in light of the continuing decline…
Dougie Kass
I have covered most of the balance of my Tesla at $369.55 for a +$25 profit overnight.
Position: Short TSLA (VS)
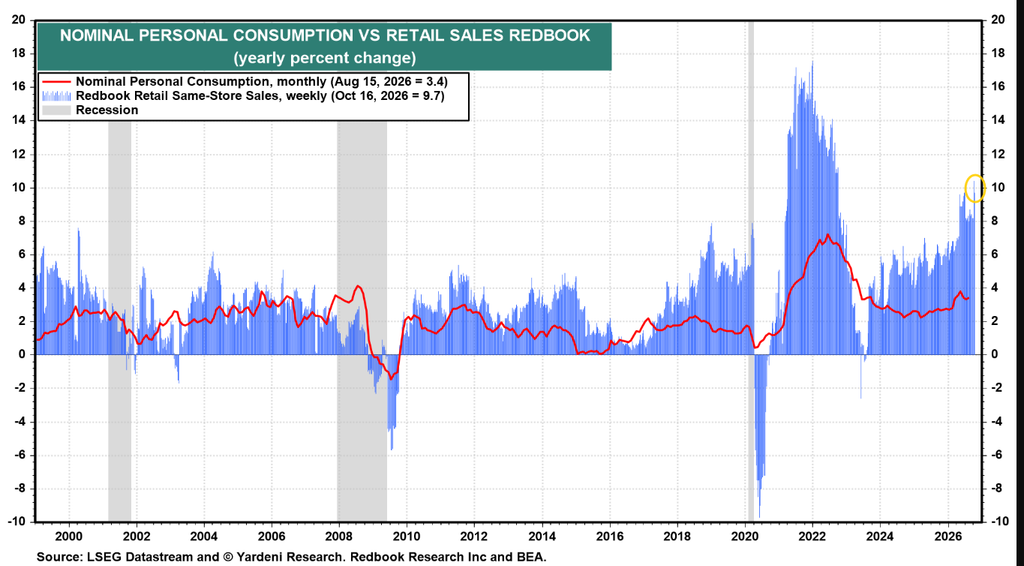
Redbook sales* in the week of October 16th decelerated but remained very healthy at +9.7% y/y growth, after hitting +10.4% the prior week, which was the best since 2022, well above the 2025 average of +5.8% y/y.
*Redbook sales are same-store sales across a panel of large general-merchandise retailers, such as department stores, discount chains, apparel retailers, drugstores, and warehouse clubs.
Chief Administrative Law Judge Derek Julius’ cannabis decision was a singular victory for the industry (and rescheduling).
Here are some examples of responses from some learned cannabis observers:
I added to $MSOS and $MSOX on the news.
I will have more later on the space…
Position: Long MSOS common (VL) and calls (VS), MSOX (S)
BofA says their clients sold US equities last week (-$9.1B), led by institutions in their 10th-biggest selling week in BofA’s data since 2008.
October is typically institutions’ heaviest selling month as mutual funds harvest tax losses ahead of their 10/31 fiscal year-ends, and BofA says institutional single-stock sales this month, relative to market cap, are already the largest of any October in its data, with two weeks still to go.
Retail sold after two weeks of buying, and hedge funds for the first time in five weeks.

* Shorting SPY and Tesla
* I covered all my $SPY short (for a more than +$6 profit) and only one third of my $TSLA short (for a +$15 profit)
After the company’s EPS release I shorted Tesla shares at $394.34:
After a quick look at the EPS release (revenues in line) I am taking a small trading short rental in Tesla (TSLA) at $394.34.
This is a low conviction trade.
Position: Short TSLA (S)
BY Doug Kass · Oct 21, 2026, 4:12 PM EDT
I covered one third of the short position for a +$15 profit:
Dougie Kass
I have a quick $15 profit in my short of Tesla and I am taking off one third of the position.
Position: Short TSLA (S)
BY Doug Kass · Oct 21, 2026, 5:58 PM EDT
The shares are trading in the premarket under $370. Though I have more than a +$24/share gain I am sticking with the balance of my short position.
More later.
Position: Short TSLA (S)
Dougie Kass
Downside reversals after hours in three key stocks: $META, $TSLA, $IBM
Position: Short TSLA (S)
The S&P Short Range Oscillator shifted back into an overbought state at 1.56% vs. -0.09%.
Note that with S&P futures -84 handles (6:01 AM) I have covered my medium-sized $SPY short at $764.96 for a quick and sizeable profit from yesterday afternoon and last night.
I plan to reshort on any rally.
From last night:
I double downed on my SPY short at $772.97 after the close and upon closer analysis of the Tesla (TSLA) and Meta (META) releases.
Position: Short TSLA (S), SPY (M)
BY Doug Kass · Oct 21, 2026, 6:25 PM EDT
Position: Short TSLA (S)
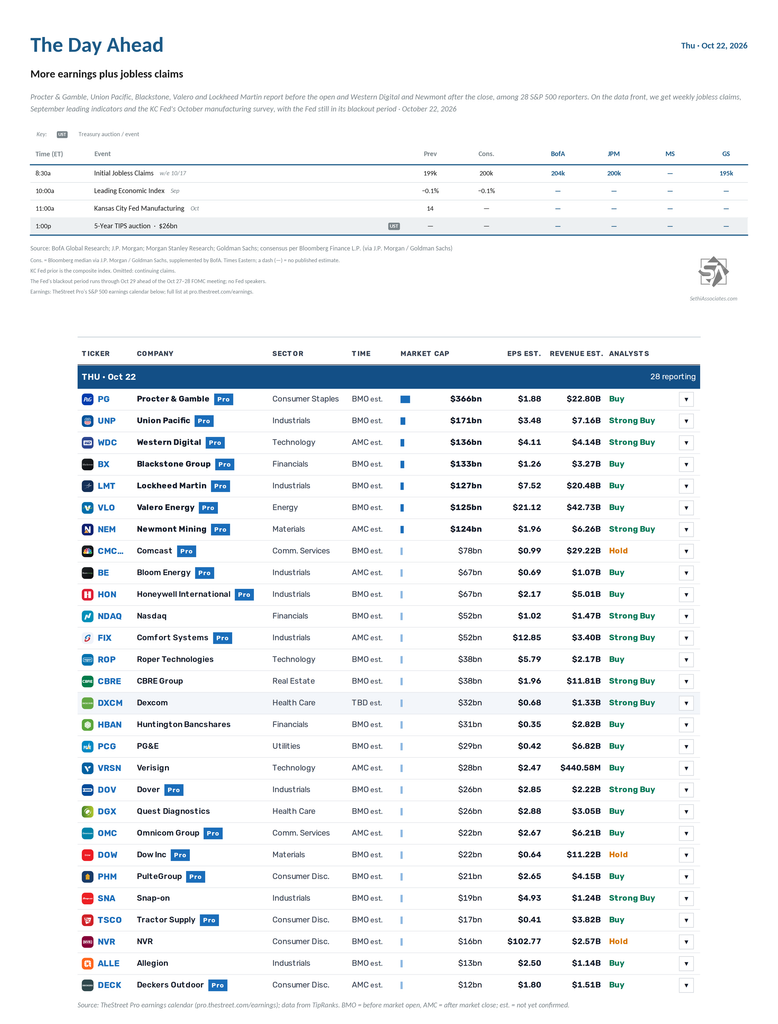
US economic data remains light with weekly jobless claims, September leading and coincident indicators and the Kansas City Fed’s October manufacturing survey.
The Fed remains in its blackout period ahead of next week’s October 27–28 FOMC meeting.
Non-Bill (>1yr in maturity) US Treasury auctions continue with a $26bn 5-year TIPS auction.
Q3 earnings season continues with 27 S&P 500 components: Procter & Gamble ($PG), Union Pacific ($UNP), Western Digital ($WDC), Blackstone ($BX), Valero Energy ($VLO), Lockheed Martin ($LMT), Newmont ($NEM), Comcast ($CMCSA), Norfolk Southern ($NSC), Bloom Energy ($BE), Honeywell ($HON), Nasdaq ($NDAQ), Comfort Systems USA ($FIX), CBRE Group ($CBRE), PG&E ($PCG), Roper Technologies ($ROP), Huntington Bancshares ($HBAN), VeriSign ($VRSN), Quest Diagnostics ($DGX), Dover ($DOV), PulteGroup ($PHM), Dow ($DOW), Snap-on ($SNA), Tractor Supply ($TSCO), NVR ($NVR), Allegion ($ALLE) and Deckers Outdoor ($DECK).
Ex-US highlights are France October business confidence, EU27 September new car registrations, Eurozone October consumer confidence, Canada September industrial product price index, and a policy decision in South Korea.