Fed’s Favorite Wage Metric Shows Slowest Annual Gain Since 2021 as Real Pay Remains Negative


U.S. Employment Cost Index Q3: 0.8% (est 0.8%; prev 0.9%)
Executive Summary
- The Q3 Employment Cost Index rose 0.8% quarter-over-quarter (0.788% to three decimals), the least since Q4 2025, in line with expectations and down from 0.9% in Q2.
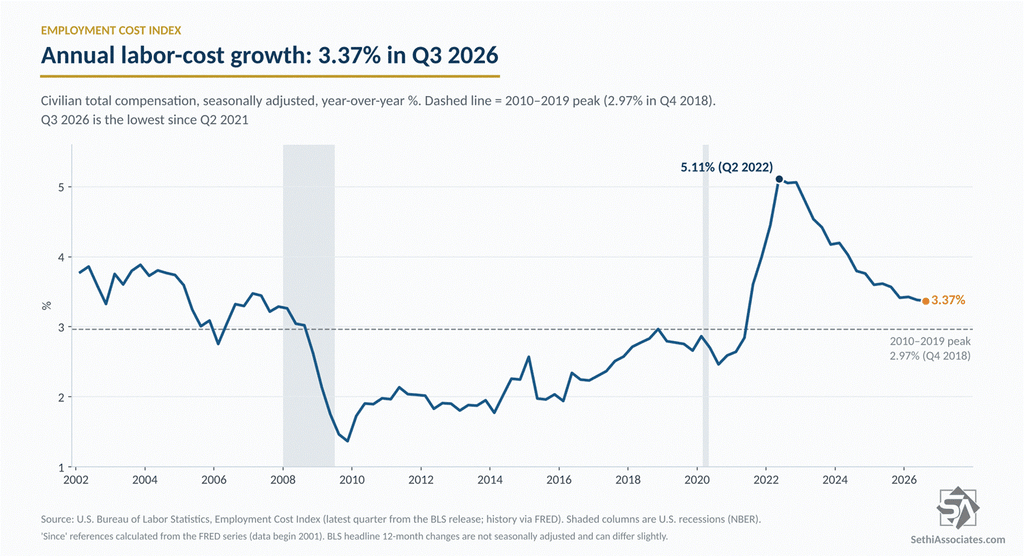
- Year-over-year compensation eased to 3.37%, the least since Q2 2021, but remains above every reading in the 10-year pre-pandemic period.
- Wages and salaries rose 3.1% year-over-year, the least since Q1 2021, while benefits rose 3.9%, the most since Q3 2023, with private industry health benefits up 6.4%.
- Private leisure and hospitality wages rose 2.2% year-over-year, the least since Q1 2016, while goods-producing and manufacturing wage growth slowed to the least since 2021.
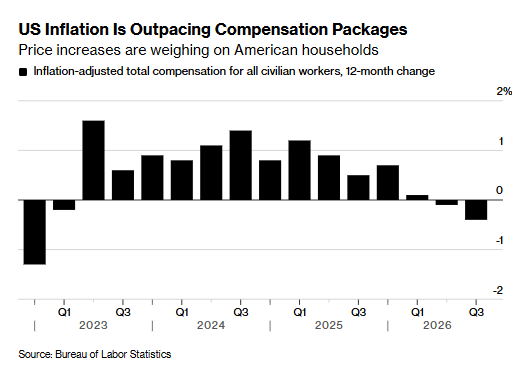
- Adjusted for inflation, compensation fell 0.4% year-over-year, the weakest since Q4 2022 and second straight quarterly decline, well below its +0.58% pre-pandemic average.
Q3 Employment Cost Index
The Q3 Employment Cost Index (ECI), the Fed’s favorite wages metric (because it’s not distorted by shifts in the composition of employment among occupations or industries), came in at +0.8% quarter-over-quarter (+0.788% to three decimals), the least since Q4 2025, in line with expectations, after +0.9% in Q2 (+0.888%). The current level remains above every reading in the 2010-2019 period (the highest was 0.76% in Q1 2018) but is down from 1.33% in Q2 2022.

Year-Over-Year Compensation
Year-over-year compensation eased to 3.37%, the least since Q2 2021, from 3.38% in Q2, and is down from 5.1% in 2022. This though is still above the entirety of the 10-year pre-pandemic period, when the highest it got was 3.0% in Q4 2018.
Wages and Salaries
Civilian wages and salaries rose 0.7% quarter-over-quarter (0.747%), the least since Q4 2025, from 0.9% (0.854%) in Q2. Year-over-year wage growth slowed to 3.1%, the least since Q1 2021, from 3.2% in Q2.
For private industry workers, wages and salaries rose 0.8% quarter-over-quarter and 3.1% year-over-year. Excluding incentive paid occupations, private wages rose 3.1% year-over-year, down from 3.2% in Q2.

Benefits
Civilian benefit costs rose 0.9% quarter-over-quarter (0.877%) after 1.0% (0.964%) in Q2. Year-over-year benefit growth rose to 3.9%, the most since Q3 2023, from 3.8%, outpacing wages and salaries for a fourth straight quarter.
Private industry health benefit costs rose 6.4% year-over-year, up from 6.0% in Q2 and 6.1% a year earlier matching the highest since 2005, per Bloomberg.

Private Industry and State and Local Government
Private industry compensation rose 0.8% quarter-over-quarter (0.825%) and 3.4% year-over-year, from 3.3% in Q2.
State and local government compensation rose 0.6% quarter-over-quarter, down from 1.0% in Q2, and 3.5% year-over-year, from 3.6%.

Occupations and Industries
Digging into occupations and industries:
Wages for service occupations overall rose 2.8%, the lowest since 2016 per Bloomberg, from 3.3% in Q2 and 3.6% a year earlier, and office and administrative support wages rose 3.1%, the least since Q1 2021. Private leisure and hospitality wages rose 2.2% year-over-year, also the least since Q1 2016, from 2.5% in Q2 and 2.8% a year earlier, with accommodation and food services at 2.1%.

Management, professional and related occupations saw total compensation rise 3.6% year-over-year, up from 3.4% a year earlier, while their wages slowed to 3.3% from 3.5%, so the acceleration came from benefits. Information industry wages rose 3.3%, up from 2.2% a year earlier. The September FOMC minutes noted that “Some participants observed that strong demand for skilled workers in sectors related to the ongoing AI buildout had been driving strong wage gains for these workers.”
Goods-producing wages rose 3.1% year-over-year, the least since Q1 2021, down from 3.9% a year earlier, and slipped just below service-providing wages unrounded (3.08% vs. 3.13%), after running ahead of services in four of the prior five quarters. Manufacturing wages rose 3.1%, the least since Q2 2021, and construction wages rose 3.0%, from 4.1% a year earlier.
Sales and related wages rose just 1.8% year-over-year, from 4.2% a year earlier; excluding incentive paid occupations, sales wages rose 2.1%.
Per the BLS, “Wages and salaries increased 4.3 percent for union workers and 3.0 percent for nonunion workers over the year.” Union benefit costs rose 1.3% in the quarter alone (not seasonally adjusted).
Among the biggest gains, aircraft manufacturing compensation rose 5.8% year-over-year (with benefits up 9.9%), utilities 5.1% (from 4.0% a year earlier) and real estate and rental and leasing 4.0% (from 2.7% in Q2).

Inflation-Adjusted Compensation
Adjusted for inflation though (constant dollar), civilian compensation fell 0.4% year-over-year, the weakest since Q4 2022, from -0.1% in Q2, and well below its +0.58% pre-pandemic average. For private industry, “Inflation-adjusted (constant dollar) wages and salaries decreased 0.6 percent over the year,” per the BLS.
That is consistent with the September FOMC minutes, in which “some participants also commented that aggregate wage growth was moderate and consistent with inflation moving toward 2 percent, or that the labor market was not currently a source of inflationary pressures.”

Charts are built from the BLS release, with history via FRED.