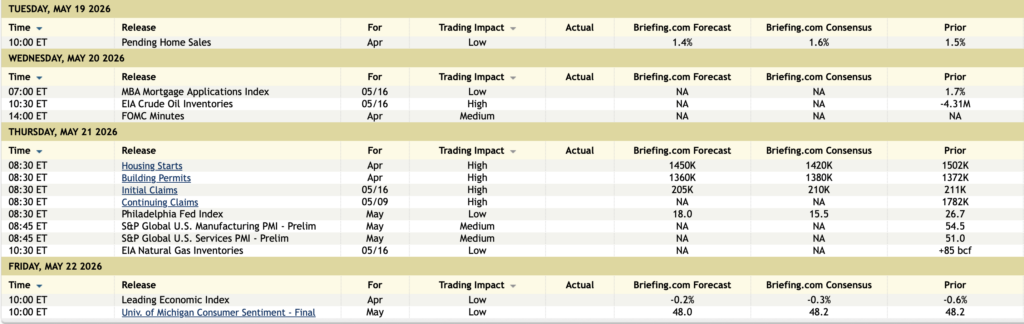
11:00 a.m.: Treasury Announces a 4, 8 and 17 Week Bill Auction;
11:30 a.m.: Treasury hosts a$85B 6-Week Bill Auction;
2:00 p.m.: Treasury buyback (liq support)
Fed Speakers:
8:00 a.m.: Fed Board Governor Waller (Voter) speaks at the ECB Research Conference, Frankfurt Germany;
7:00 p.m.: Fed Bank of Philadelphia President Paulson (Voter) speaks on the economic outlook before a dinner at the Federal Reserve Bank of Atlanta 2026 Financial MarketsConference: “Technology’s Transformative Role in Finance and Central Banking,” Amelia Island, FL (Livestream and text available. Audience Q&A expected.No media Q&A. Event information: atlantafed.org);
7:45 p.m.: FedBank of Atlanta First Vice President Venable (Voter) gives closing remarks before the Federal Reserve Bank of Atlanta 2026 Financial Markets Confer-ence: “Technology’s Transformative Role in Finance and Central Banking,” Amelia Island, FL (Livestream available. Other details TBA. Event information: atlantafed.org/news-and-events/events/2026/05/17/financial-markets-conference/agenda)
How deep is your love, how deep is your love How deep is your love? I really mean to learn ‘Cause we’re living in a world of fools Breaking us down when they all should let us be We belong to you and me
Under the influence of a prolonged conflict in Iran, the uncertainty of improvisational policy in Washington D.C., rising interest rates and an accelerating rate of inflation — equities have been heading lower since late last week.
Machines, that worship at the altar of price, have begun to mechanically sell. (A perma-bull panelist on CNBC blamed the market decline over the last several days on algo selling, but failed to highlight that algos likely contributed to the upside explosion in stocks since March 2026).
How deep is the market’s love?
We will likely find out in the next several weeks.
I remain bearish, as highlighted in my recent five-part missive.
The lack of variety in the guests and the absence of contrary thought and "first level thinking" at @cnbc speaks volumes about the programming problems the network faces. The guests are redundant in views, spew memorized sound bytes and express themselves confidentally (despite a…
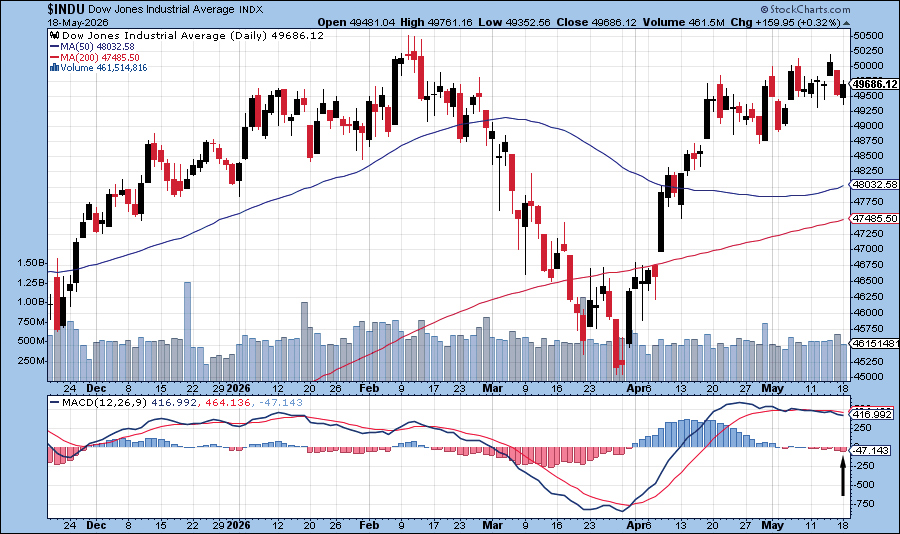
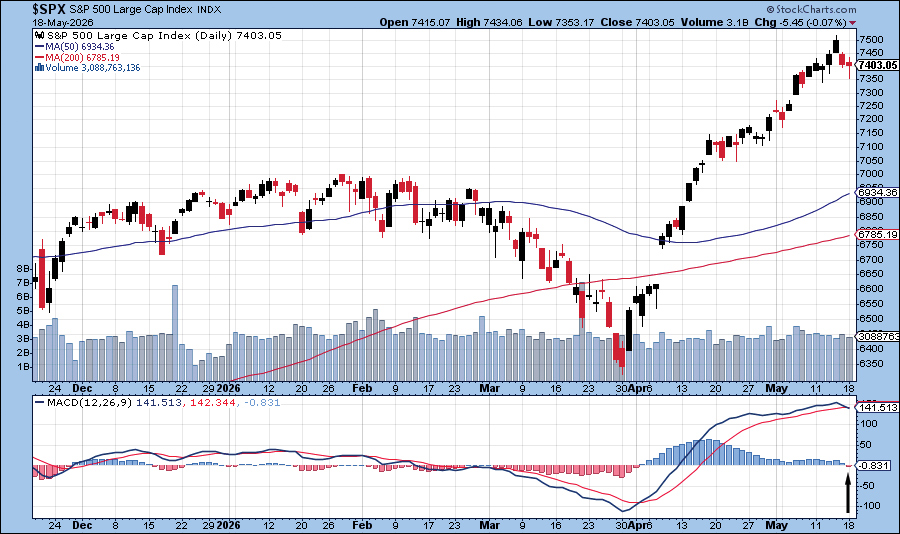
As of today’s close, slower moving MACD indicators applied to both DJIA and S&P 500 are negative (arrows in the charts below point to a crossover or negative histogram). We are issuing our Best Six Months MACD Seasonal Sell signal for DJIA and S&P 500. NASDAQ’s “Best Eight Months” lasts until June.
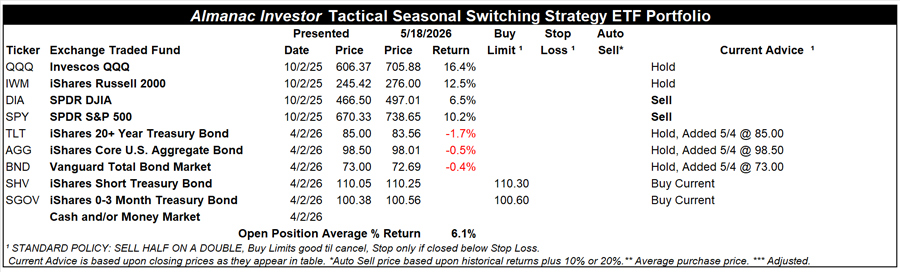
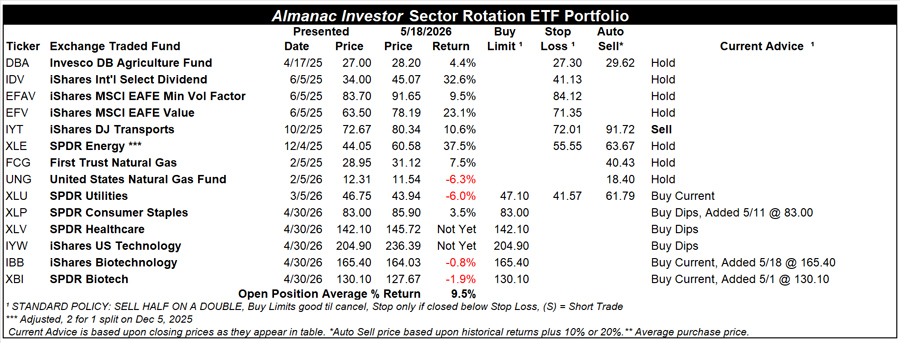
SELL SPDR DJIA (DIA) and SPDR S&P 500 (SPY) positions. For tracking purposes these positions will be closed out of the portfolio using their respective average prices on May 19.
Continue to HOLD Invesco QQQ (QQQ) and iShares Russell 2000 (IWM) as NASDAQ’s “Best Eight Months” does not end until June.
For this “Worst Months” period we have presented some low-fee ETFs where cash from the positions that are being closed out can be used ranging from relatively low-risk/low-reward to higher-risk/potentially higher reward. Please, consider your individual risk tolerance and investment objectives when choosing.
Consider establishing a position in iShares Short Treasury Bond (SHV) with a Buy Limit of $110.30.
Consider establishing a position in iShares 0-3 Month Treasury Bond (SGOV) with a Buy Limit of $100.60.
Although we would consider SHV and SGOV to be low-risk/low-reward options given their relatively stable prices, they have respectable yields. With longer-dated Treasury bond yields creeping higher (prices going down) due to rising inflation expectations brought on by higher energy costs, our preferred funds are SHV and SGOV at this time.
For tracking purposes, SHV and SGOV will be added to the portfolio on May 19, using their respective average prices.
Vanguard Total Bond Market (BND), iShares Core US Aggregate Bond (AGG), and iShares 20+ Year Treasury Bond (TLT) were all added to the portfolio on May 4, when they all dipped below their respective buy limits. BND, AGG, and TLT are on Hold.
Lastly, positions in cash and/or money market funds can also be considered. Choices yielding 3.5% are available. An allocation to cash or a money market fund will likely be the least nerve-racking position should market volatility spike during the “Worst Months.”
Traders/investors following the Best 6 + 4-Year Cycle switching strategy detailed on page 64 of the Stock Trader’s Almanac 2026 should heed this Seasonal Sell signal. Even if you are not actively trading the “Best Months” switching strategy, it is still a good reminder to review existing holdings and consider a cautious stance.
Sell iShares DJ Transports (IYT) as its correlating seasonality has historically ended in the beginning of May. For tracking purposes IYT will be closed out of the portfolio using its average price on May 19.
SPDR Healthcare (XLV) and iShares US Technology (IYW) can still be considered on dips below their respective buy limits.
SPDR Consumer Staples (XLP), iShares Biotechnology (IBB), and SPDR Biotech (XBI) have been added to the portfolio and can be considered on dips or at current prices up to their respective buy limits.
SPDR Utilities (XLU) can still be considered at current prices up to its buy limit.
All other holdings in the Sector Rotation Portfolio are on Hold.
Today’s Seasonal MACD Sell Signal for DJIA and S&P 500 marks the beginning of the “Worst Six Months” for DJIA and S&P 500. We do not simply sell and go away. Instead, today’s trades are the start of tactical adjustments that will be made in the portfolios. Between now and when NASDAQ’s Seasonal MACD Sell Signal triggers (earliest it can trigger is on June 1 this year), the portfolios will be shifted toward a neutral stance. Positions that have historically performed well during the “Worst Months” will be held along with positions that correlate to NASDAQ and Russell 2000.
All current stock and ETF holdings will be reevaluated in upcoming email Alerts. Weak or underperforming positions may be closed out, stop losses may be raised, new buying may be limited, and we will evaluate the timing of adding additional positions in sectors that perform well in the “Worst Six Months” and potentially a new basket of defensive stocks.
I wrote this late Friday afternoon and some may have not seen it. It “bears” reading:
Thoughts on My ‘Low Drama’ Shorts — And One in Particular
I spend a lot of time discussing my index trading short rentals. I do this daily and trade SPY and QQQ in size. Short-term market views (which form the basis for these shorts) are a popular and even controversial topic. Like butts, everyone has an opinion on the market — so the audience for an index “view” is sizeable.
And I often short overbought and popular market leaders (with very extended RSIs like MU and INTC) where people have strong opinions on the long and short side.
These shorts are attention catching and tend to be tough shorts — particularly in the momentum-driven market of the last decade.
But, I don’t spend enough time discussing my individual (and often “low drama”) investment shorts — companies that sell simple and understandable products (widgets) whose secular prospects and business landscape are changing for the worst. These would include multi-year investment shorts like CHGG, DNUT, FIGS, BXMT, SNBR, RICK, FXLV, etc.
Check out WGO’s stock chart and the steady drop in share price. As I wrote, it is a “low drama” and successful short based on the juxtaposition of several factors:
* Pressure on the K-shaped economy moving up vertically, towards the middle and upper-middle class that, traditionally, are among the target recreational vehicle buyers.
* The steady rise in the price of oil has pressured RV sales.
* Another headwind is the large rise in the cost of the average recreational vehicle — making purchases less attainable and reducing the total addressable market.
That said, when I was driving harness horses I owned a Minnie Winnie (Winnebago) that took me all around the country for stakes races. Back then, gas was a bit more than $1/gallon and the Winnebago cost me about $30,000. Today the price of gas can be 5 to 6x that price and a motorized RV costs between $50,000 up to over $600,000!
Position: Short SPY (VS), QQQ (VS), MU (S), INTC (S), CHGG (VS), DNUT (VS), FIGS (VS), BXMT (VS), SNBR (VS) RICK (VS), FXLV (VS), WGO (S)
In the interest of full disclosure your guest Ed Yardeni recommended the reduction in hyperscalers/MAG7 on December 25, 2025 – since they accounted for too large a portion of the S&P 500 Index. At that time he suggested their…