Boockvar on Prices, Giddy Levels, GDP

The following is from Peter Boockvar:
Go back to 2002 to see this previously/Giddy again?/GDP breakdown/Oil, gas/Earnings/PMIs
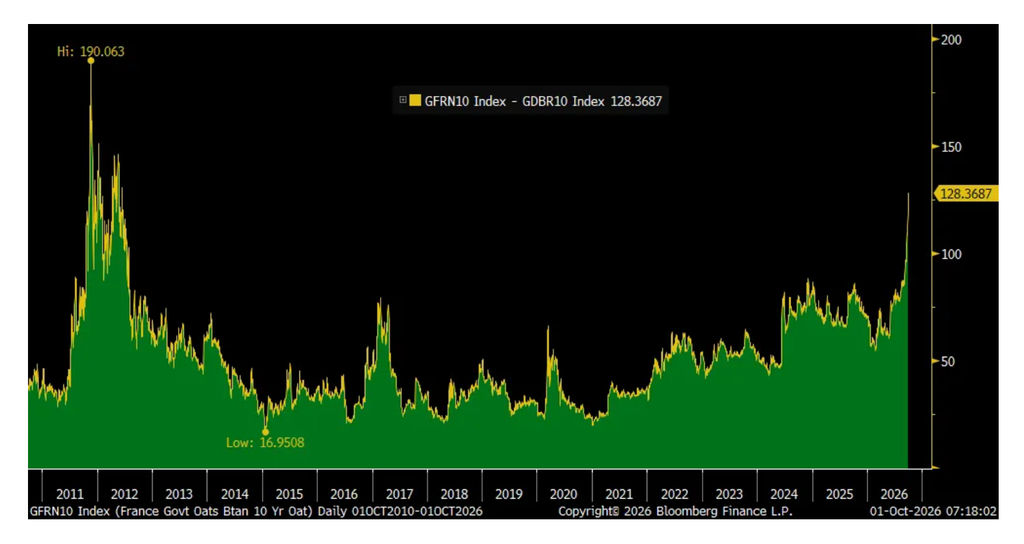
Yesterday was another example of why analyzing only US inflation and growth stats is not the only factor impacting US long term interest rates and a reminder AGAIN of how global this rate move is with a variety of influences. The French 10 yr yield yesterday closed at a 24 year high and is now nearing 5% at 4.85%. Its spread to German bund yields is at a 12 year high at 128 bps and you can be sure it is worries about French debts and deficits and not robust growth there.
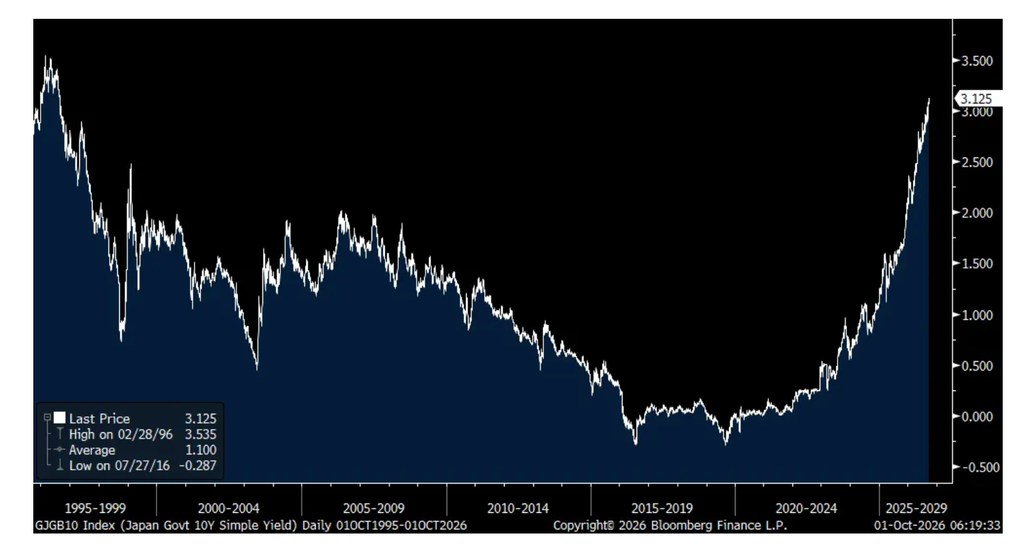
Also, the 10 yr JGB yield jumped another 6 bps to 3.13%, a fresh 30 yr high and it dragged yields across Asia higher. About ten years ago, on July 27th, 2016, that 10 yr JGB yield was -.29%, its ultimate bottom. I wonder who bought it on that day.
German Bund/French Oat 10 yr yield spread
10 yr JGB Yield
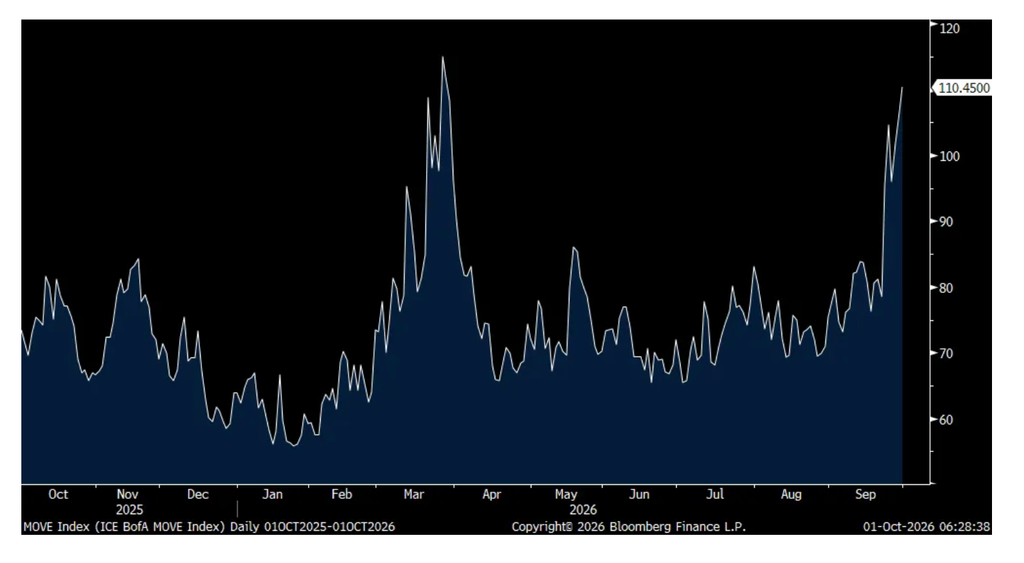
The MOVE index by the way, the VIX of Treasury bonds, closed yesterday at the highest since March.
MOVE index
At least from the perspective of ‘professional investors’, they got all giddy again over the past week on the stock market. II said Bulls jumped to 57.7 from 51.9 and that is back to being more than 40 pts above the Bears which sit at just 15.4, unchanged on the week. I’ve said many times that anything above 40 should be viewed as extreme. I do think the reason why is many of these newsletter writers are focused mostly on tech and the big indices while the individual investor is voting how they feel everyday, and for some, not that good. The AAII said bulls rose 1.9 pts w/o/w to 34.6, remaining well below Bears which stand at 46.5, down 1.6 pts w/o/w. The CNN Fear/Greed is still on the ‘fear’ side.
We know that the main drivers of US economic growth continues to be the data center buildout, upper income spend, and healthcare use. While Q2 GDP is old news with Q3 now over, I just wanted to highlight the contribution of each to that top line 2.2% growth rate. In that updated Q2 figure seen yesterday, spending on ‘software/R&D’ added 50 bps and almost a like amount from ‘info processing/industrial equipment.’ So, let’s call it about 100 bps from mostly data centers.
With the heavy influence of upper income spend (of course the GDP data doesn’t segment by income cohort), spending on vehicles, furniture and recreation (both durable goods and services) added about 95 bps of growth.
Lastly with healthcare, spending on its services contributed 79 bps to Q2 GDP growth. By the way, when Q2 data was first released on July 30th, the initial print was just 14 bps and highlighting how important healthcare spending is, with much via Medicare and Medicaid, to US GDP growth. We know too that this sector has been the leading contributor to job growth as well, again seen yesterday in the ADP data.
The Dallas Fed released its Q3 Oil and Gas survey and I just wanted to highlight a few things of note.
1)”Both oil and natural gas production rose in the third quarter, according to E&P executives. The oil production index increased from 15.0 in the second quarter to 20.7 in the third. Meanwhile, the natural gas production index climbed from 3.7 to 14.8.”
2)”Cost pressures remained elevated across the sector…All cost indexes were above their series averages, suggesting costs are growing at a faster-than-average pace.”
3)”Labor market indicators improved modestly in the third quarter. The aggregate employment index rose from 4.7 to 15.2, and the aggregate employee hours index increased from 11.8 to 20.0, both pointing to modest job growth and longer hours worked.”
4)”Supplier delivery times continued to lengthen.”
This one was interesting in response to the question, “Where do you primarily expect your firm to allocate this additional cash flow in the coming quarters?”
The answer, “Among large E&P firms, the majority of executives—50 percent—expect their firm to allocate additional cash flow (largely accumulated earlier in 2026) as capital return to shareholders and/or owners. Capital expenditures ranked second, selected by 21 percent of executives. By comparison, for small E&P firms, the top choice was capital expenditures, selected by 31 percent of executives, followed by debt reduction, cited by 23 percent of executives.”
So, at least for now, the large companies aren’t mainly interested in drilling more, reflecting continued financial discipline while the smaller ones want to take advantage of higher prices.
The main reason why it seems that the crude oil rig count overall is still well where it was a few years ago, I’ll take a quote from one of the respondents:
“Pricing volatility is near an all-time high given the backdrop of Iran. Swings of $5, $10 and $20 up or down are common. It is very challenging to select a planning price or budgeting price. Companies must look at the steep backwardation and budget off of a $65 per barrel or $70 per barrel price while operating expenses per barrel and finding and development pricing is increasing quickly.”
We remain positive and long the space.
To a few earnings calls of note.
From Conagra, a battered though very cheap stock we own:
“Consumers continue to be thoughtful about where they spend their dollars, and we’re managing through a volatile input cost environment.”
“Convenience store is an example that’s been a bit more pressured in recent months because of the gas prices. But overall, I would say the consumer has been relatively stable and resilient.”
“Price/mix contributed 130 bps to margin, with inflation-justified pricing actions more than offsetting incremental merchandising investments.”
“Inflation, inclusive of both core inflation and our tariff wrap, came in at roughly 5% in Q1. While still elevated, we saw favorability relative to our expectations primarily in proteins. However, we also saw an acceleration in fuel and logistics costs throughout the quarter, which we expect to further impact Q2 and the remainder of the year.”
Good but not good enough was the case for Jabil, the original equipment manufacturer for a variety of tech products as its stock fell 10% yesterday.
Their ‘Intelligent Infrastructure’ group saw revenue up 56% y/o/y and driven by “First, AI related demand remained very strong and continue to accelerate, exceeding the significant growth we had already incorporated in our June outlook. Second, capacity came online sooner than planned and customer ramps progressed better than anticipated, allowing us to support that higher level of demand.”
Industry wise outside of AI demand, “Automotive is benefiting from a more balanced technology mix. Defense and aerospace is gaining momentum as new programs move into production. Healthcare is expected to return to growth, while renewable and energy infrastructure is benefiting from improving market conditions and overall demand.”
With respect to memory and semi’s, “We’re seeing real constraints today. Memory in particular is being reallocated towards AI and hyperscale demand, tightening supply across many of the diversified end markets that we serve.”
Speaking of memory and earnings not good enough was Micron, up only slight pre-market on the heels of a big beat and raise.
“As strong as fiscal 2026 was, we expect fiscal 2027 to be even better. Industry demand has strengthened since our last earnings call, and we expect memory and storage supply-demand conditions to be much tighter in fiscal 2027 and 2028 than they were in 2026.”
“AI is becoming Super Intelligence, and memory enhances this intelligence and the competitiveness of our customers’ platforms. AI applications across end markets, whether using open-source or closed-source models, are run on a variety of competing customer platforms. These platforms all share one important characteristic: Their value proposition is enhanced by the performance and capacity of memory and storage. Running an AI application on a platform with greater memory capability enables more scalable growth in usage, improves the end-user experience and increases the value users get from AI applications.”
Regardless of all the great news for Micron, its stock peaked in June and I’d argue one reason is that shortly after, the Chinese competitor CXMT went public and questions arose about whether Micron can sustainably sustain its 87% gross margin.
These were the overseas manufacturing PMI’s out today ahead of the US ISM with most above 50:
Taiwan 56.7 vs 54.7
South Korea 53.9 vs 52.3
Vietnam 51.9 vs 53.3
India 55.1 vs 52.8
Japan 54.1 vs 54.9
Australia 49.6 vs 52
Thailand 54.3 vs 53.8
Malaysia 49.9 vs 50.2
Philippines 49.6 vs 54.9
Indonesia 52.4 vs 49.8
Eurozone 52.9 vs 52.7
UK 51.9 vs 51.7
