Boockvar on Jobless Claims, Housing Starts

The following is from Peter Boockvar;
Claims data/Housing/Philly mfr’g with expectations for ‘prices received’ at a 45 yr high
Initial jobless claims fell to 196k from 206k and 11k below expectations. Keep in mind that there was likely some seasonally adjustment noise around the late Labor Day weekend. The 4 week average fell to 203k from 206k. Continuing claims saw a nice dip to 1.73mm from 1.77mm and well below the estimate of little change.
The bottom line story remains the same with the state of the labor market as measured here.
Housing starts were noisy because the July figure was revised up by 70k to 1.309mm while the August figure was 45k below expectations at 1.275mm. The breakdown though is more relevant.
Single family starts recovered to 918k from 853k in July and vs 902k in June. On the other hand, multi family starts dropped sharply (very volatile figure though) to 357k from 456k in July, 537k in June and 293k in May.
Permits saw slight declines in single family and multi family m/o/m.
Bottom line, nothing new. We know single family construction is challenged both from a supply and demand side with the bigger builders doing better than the smaller ones. With multi family, starts in the Sunbelt and some Mountain states (like Colorado) are down sharply while picking up in the coastal regions.
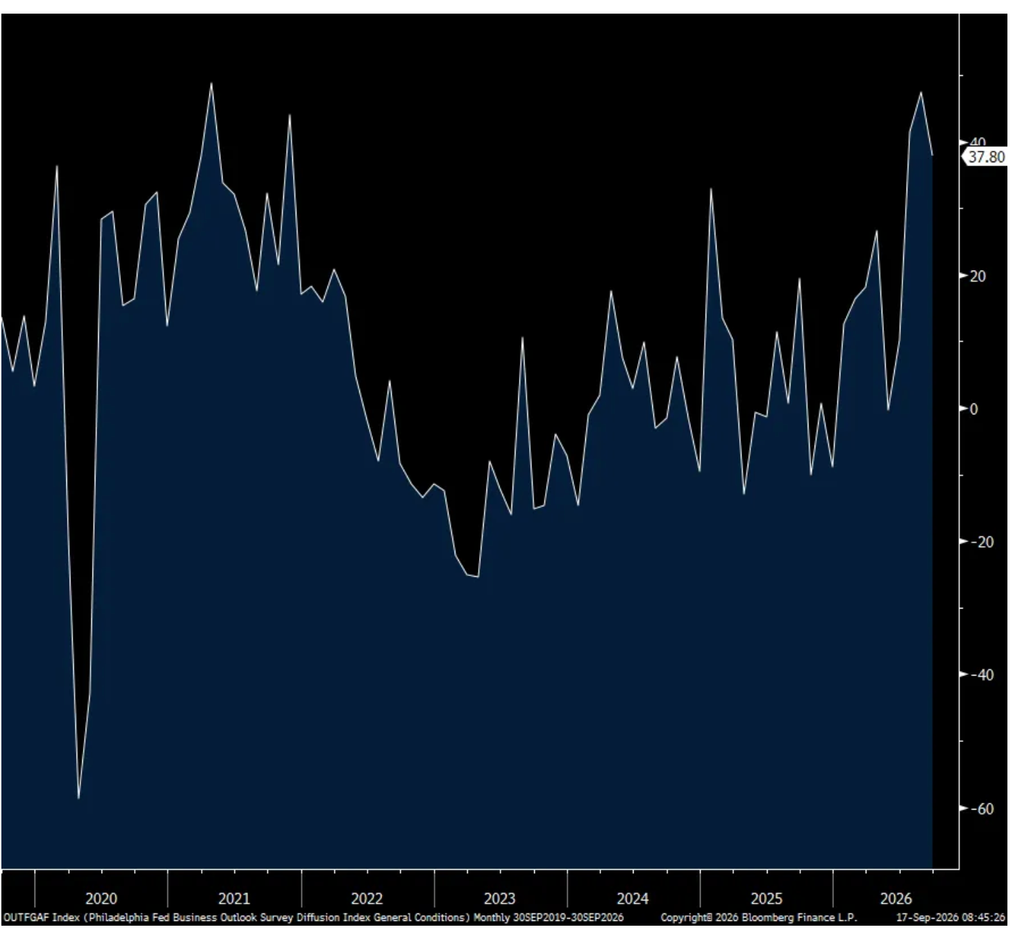
Reflecting the continued recovery in US manufacturing (globally too), helped in part due to inventory restocking, the September Philly manufacturing index was 37.8 and remaining 10 pts above the 6 month average.
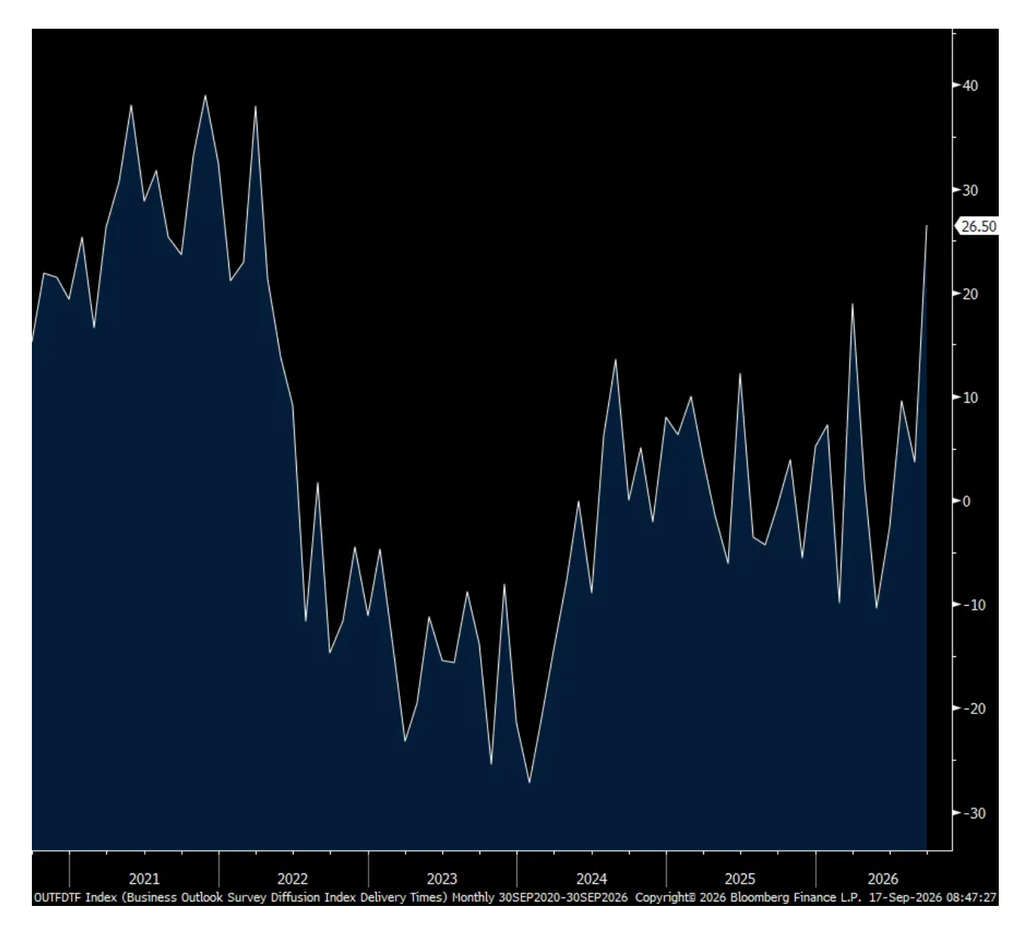
Noting the very volatile nature of the data, what stood out was the drop to -12.5 in inventories from -3.7 at the same time supply chains are getting more stressed as reflected in the ‘Delivery Time’ component which jumped to 26.5 from 3.7 (the higher the figure, the slower the lead times), the highest since March 2022.
New orders fell a touch while backlogs rose. Prices paid at 48.6, up m/o/m but 2 pts below the 6 month average. On the other hand, prices received at 31.3 rose to a 5 month high and 5 pts above its half yr average.
Employment stayed positive for a 4th month.
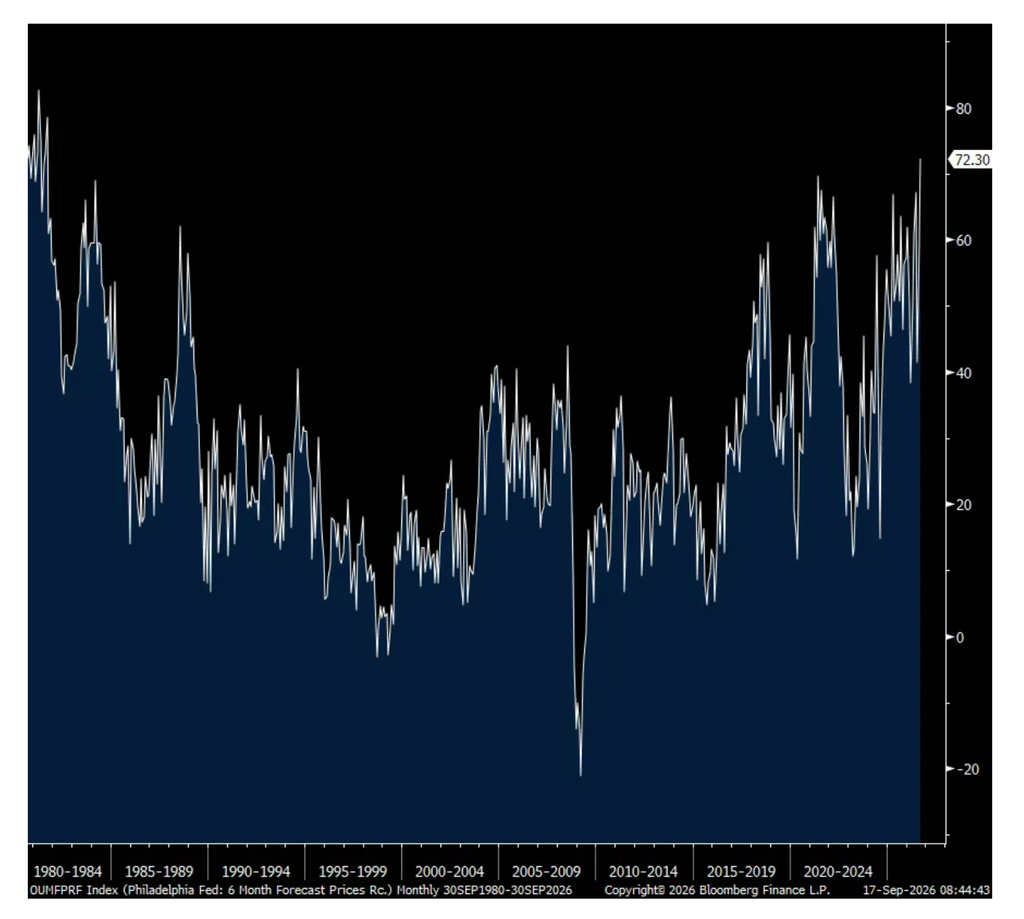
The 6 month business outlook was 52.9, 2 pts higher than the 6 month average. Capital spending plans is spot on with the half year average. Of note, expectations for prices paid rose to the most since November 2025 and for those received rose to the highest since 1981. Yes, 1981.
Expectations for Prices Received
Philly Mfr’g
Delivery Time