Doug Kass is a world-renowned hedge fund manager with decades of experience and success navigating through some of the most turbulent periods in market history. He is known for his time-tested analytical skills and ability to look past the current noise and herd mentality.
On TheStreet Pro, Kass provides frequent market commentary and investing ideas for active investors throughout each trading day in Doug’s Daily Diary. He also serves as president of Seabreeze Partners Management Inc. Previously, he served as a senior manager at Omega Advisors, a $6 billion investment partnership. He co-authored a book with Ralph Nader and the Center for the Study of Responsive Law called “Citibank: The Ralph Nader Report” and can be found as a guest host on CNBC's "Squawk Box."
A Note from Doug: Current strategies and actionable trade ideas -- all on one dynamic platform built exclusively for active trades. From sudden sell-offs to sudden spikes, TheStreet Pro arms you with crucial analysis -- at a rapid fire, professional pace -- to help you make sound trading decisions -- every day, every hour, and every minute. Join me and my team of professional traders for unique perspectives and breakthrough investment opportunities.
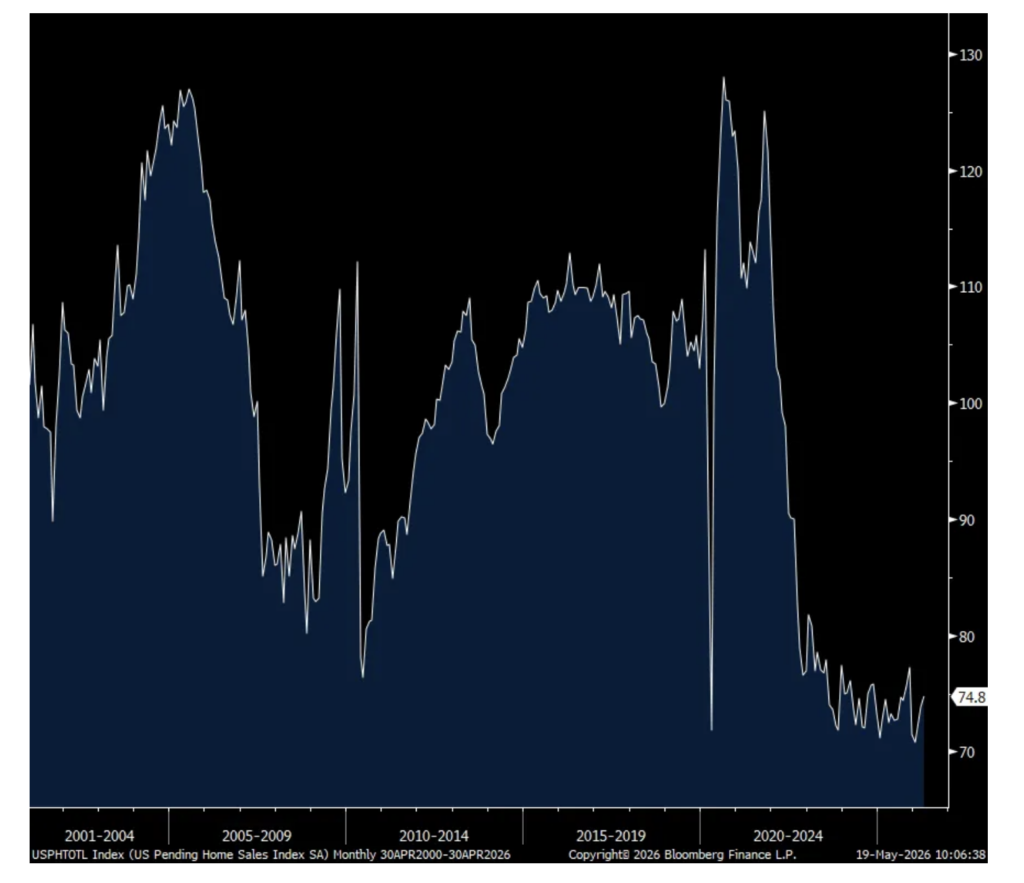
Pending home sales lift for 3rd month but what happens next?
Pending home sales in April, when mortgage rates averaged 6.44% vs 6.26% in March, rose by 1.4% m/o/m, just above the estimate of up 1% and after a 1.7% increase in March and a 2.5% rise in February after a few months of declines. About all of the gain was seen in the Northeast and Midwest while there was little change in the South and West.
The NAR said “Buyers are coming out with cautious optimism despite increasing economic uncertainty and a slight rise in mortgage rates.”
Still limited inventory in some markets remains an issue in keeping prices elevated. The NAR added, “Unless supply meaningfully increases, home price growth could outpace wage growth and further erode the homeownership rate. All efforts need to be focused on boosting housing supply.”
Bottom line, as seen in the chart below, the pace of transactions continues to bounce along the multi decade bottom for reasons we all know and now we have higher mortgage rates again coincident with the rise in the 10 yr Treasury yield.
Every AI startup loses millions or billions of dollars a year, and nobody appears to have worked out a way to stop hemorrhaging cash. Hyperscalers have invested over $800 billion in the last three years, with plans to add another $700 billion or so in 2026 and another $1 trillion in 2027, meaning that they need to make at least three trillion dollars in AI specific revenue just to break even, and $6 trillion or more for AI to be anything other than a wash. I went into detail about this (albeit at a lower, pre-2026/2027 capex number) in a premium piece last year.
Default rate update/Treasuries & other sovereigns/Home Depot
Fitch updated us with their April default figures yesterday for companies they follow in private credit. It rose to 6% which is the most since they started doing this in August 2024. That’s up from 5.7% in March. We know that there is so much focus on software but it wasn’t that at all that caused the rise. Fitch said they “recorded 10 private credit default events in April. Issuers in the industrial and manufacturing sector accounted for four events, followed by business services general with two. The consumer products, transportation and distribution, pharmaceuticals, and cable sectors each accounted for one event. Of the 10 private credit default events, six were new unique defaulters and four were serial defaulters.” Note, no mention of software.
Defining what qualified as a default, “Seven of the 10 default events involved maturity extensions under stress, while the remaining three involved the introduction of PIK interest in lieu of cash interest.”
Lastly on this, and to the point that software is not an issue here right now, “Healthcare providers remained the sector with the highest number of unique defaulters in the April TTM period. Twelve unique defaulters produced a 7% default rate, up from 6.9% in March 2026 and 5.8% in April 2025.”
Bottom line, private credit should still be a focus but as said, the software worries right now are not showing up in the data yet. Also, we have to differentiate the good underwriters from the not so good and not paint the whole sector with a broad brush. And finally, also differentiating a loan given to finance a private equity deal vs a loan lent to a borrower that wants to expand a business.
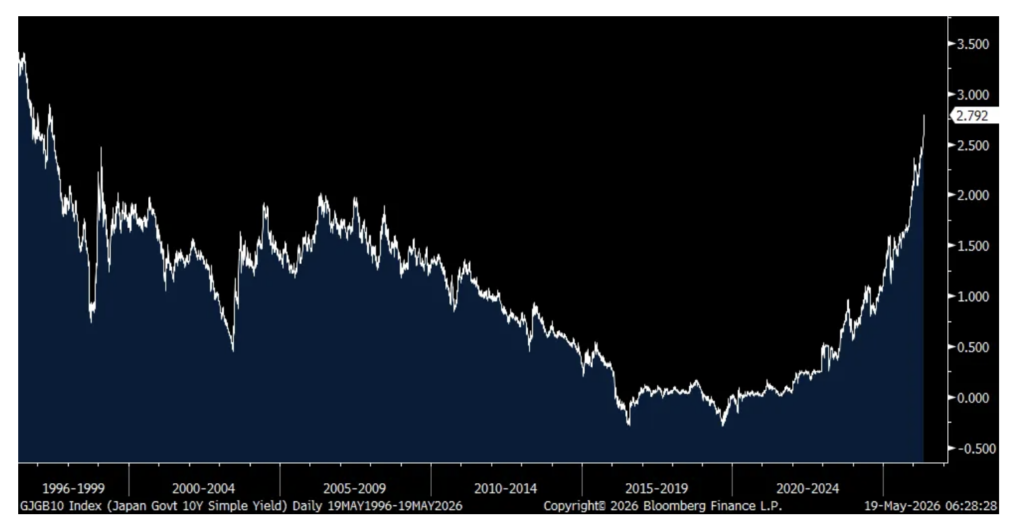
JGB yields jumped again overnight with the 10 yr yield up another 6 bps to 2.79% and we’re getting close to 30 yr highs. The chart is beginning to look vertical. I keep highlighting Japanese yields in particular because this was the original home of modern day interest rate suppression with ZIRP and QE and then they followed the Europeans into NIRP. And they remain the largest foreign holder of US Treasuries.
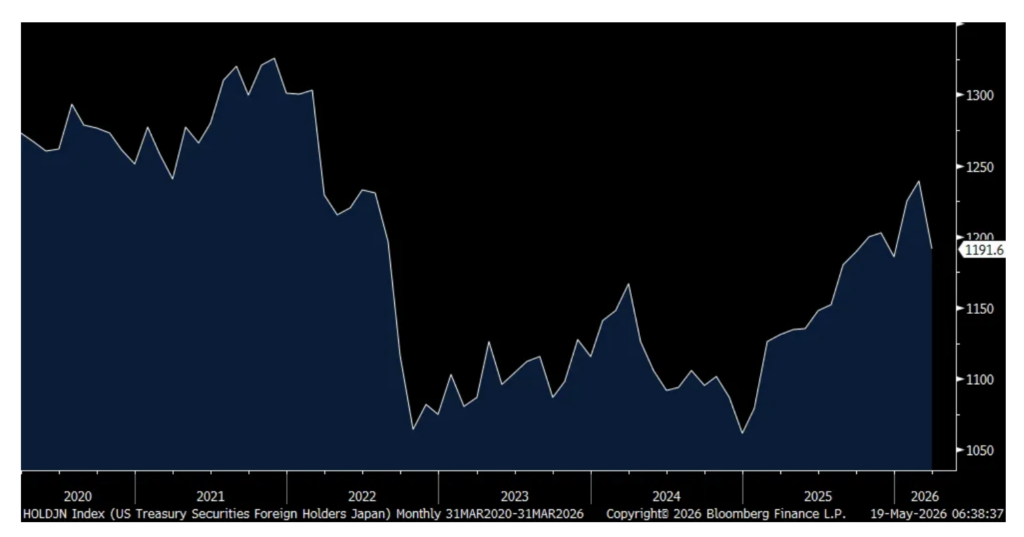
Speaking of those holdings of US Treasuries, Japan’s stock in Treasuries in March fell by $47.7b (including maturing T-bills not reinvested and changes in value). China’s holdings fell by $41b. Foreigners in the ‘foreign official’ category sold another $38b in total in notes/bonds. It was the $51.5b of ‘private’ buying that helped to offset that with ‘private’ including hedge funds in the Cayman Islands and their basis trades. UK holdings data are likely part of this too via UK banks.
If we include T-bills and those maturing and not reinvested, foreign holdings in total fell a large $138.4b worth with some of that due to falling values.
Bottom line, the US Treasury is relying more and more on US domestic savings and the basis trade to finance itself.
10 yr JGB Yield
Japanese holdings of US Treasuries, $1.192T
UK gilt yields are backing off a bit but not for good reason. In April, the ‘payrolled employee’ count fell by 100k, well worse than the estimate of down 10k. The caveat is that the ONS said there could be some beginning of the tax year distortions. Let’s hope so. The biggest job losses were seen in retail and leisure/hospitality. Also, jobless claims rose by another 26.5k. In the three months thru March, their unemployment rate rose one tenth m/o/m to 5%.
With respect to wages ex bonus, weekly earnings rose 3.4% y/o/y thru March which is not much above the rise in CPI. Tomorrow’s expected April CPI is expected to be up 3% y/o/y.
Home Depot had mixed results, beating top and line estimates but slightly missing Q1 comp forecasts. They said this in their earnings release of note ahead of their conference call:
“The underlying demand in our business was relatively similar to what we saw throughout fiscal 2025, despite greater consumer uncertainty and housing affordability pressure.”
In an interview, the CFO said that its customers “continue to defer large projects. They have told us that they have a higher degree of uncertainty.”
They reaffirmed its guidance with 2026 comps expected to be flat to up 2%.