Chart of the Day: Google’s Correction Seems Finished


The giant search and AI company had a nasty pullback but seems to have found its footing.
The giant search and AI company had a nasty pullback but seems to have found its footing.
Tech is looking stretched, housing is looking weak and SpaceX is blasting past powerhouses like Amazon as other AI companies line up to go public.
From Peter Boockvar:
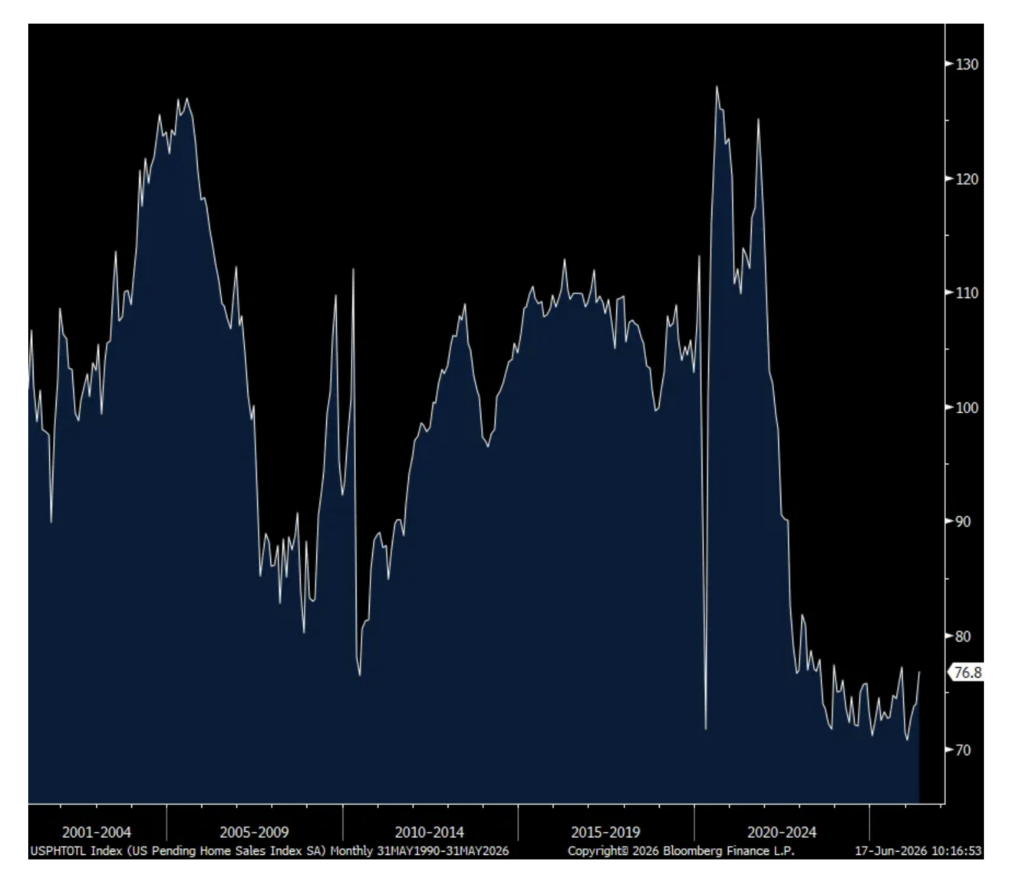
Pending home sales in May saw an encouraging 3.8% m/o/m jump in the key spring selling season, well above the estimate of up .9% and only partly offset by a downward revision of 110 bps to April which saw a .3% rise.
The NAR said, ““A late spring buyer rush—even with mortgage rates not budging—is an indication of pent-up housing demand and consumers’ acceptance of above-6% mortgage rates as the new normal. The inventory-constrained Northeast region, which has seen faster home price growth but slower home sales for several months, is now showing more buyer contract signings. More supply is needed to help moderate home price growth.”
With the perspective that the pace of existing home sales is still rather soft, see the chart below, it was nice to see a lift even without any help from mortgage rates. We of course now watch for sustainability in the months and quarters to come.
Pending Home Sales index
Positions: None.
I’m still finding things to buy. Here’s what I’ve been up to.
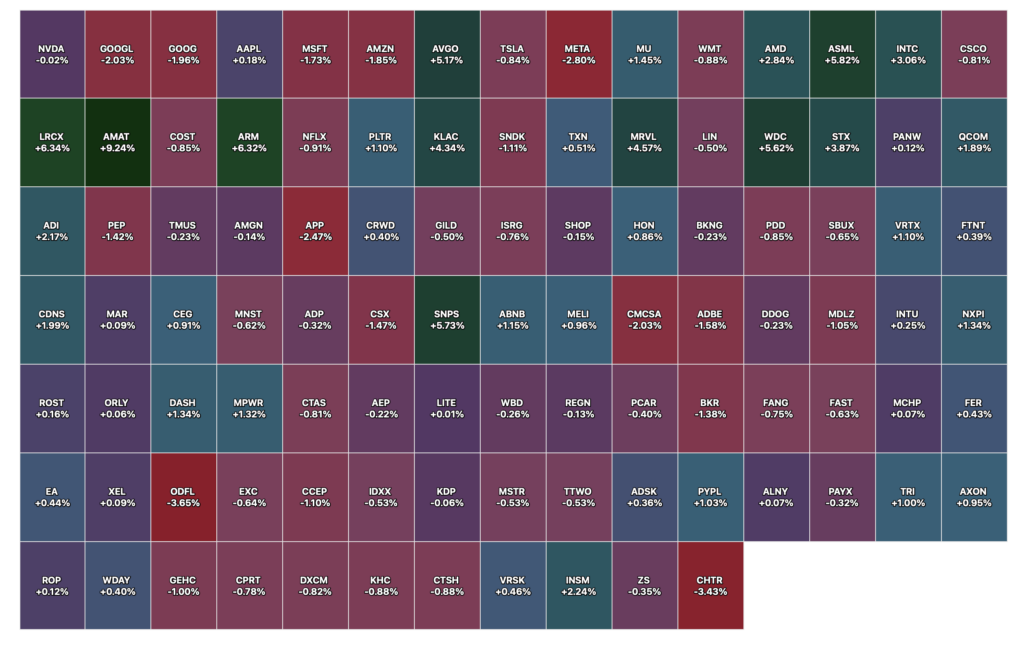
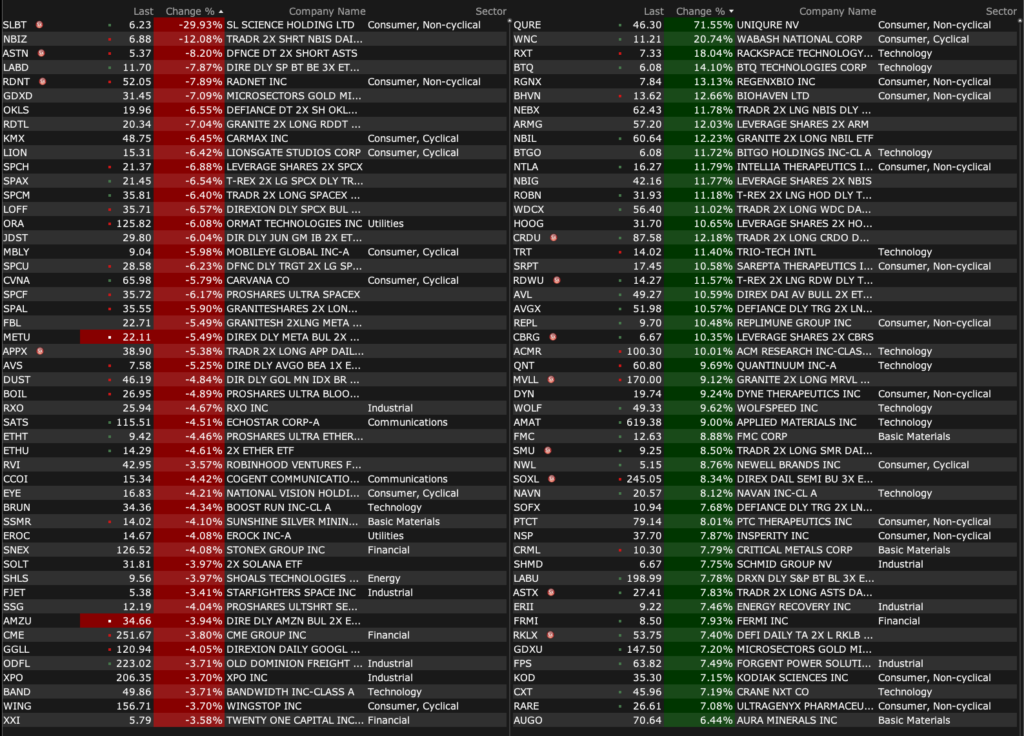
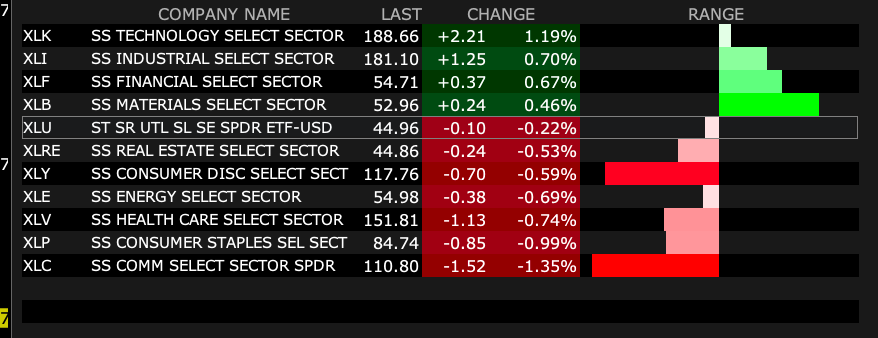
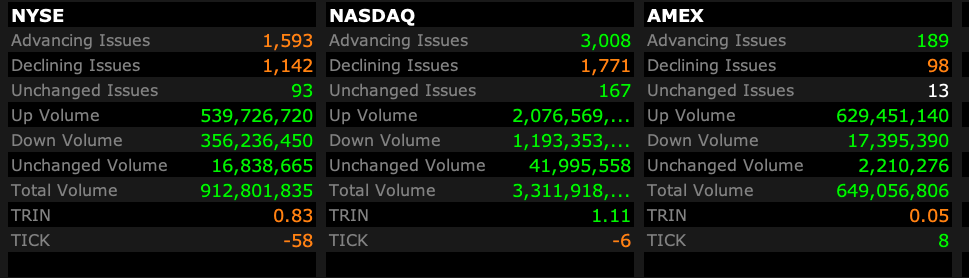
– NYSE volume 23% below its one-month average;
– Nasdaq volume 4% below its one-month average;
– VIX index: up 1.28% to 16.62
Positions: None.
The used car giant turned some heads but I see trouble ahead.
JavaJoe
7m ago
Have you basically become a day trader now? It’s an honest question.
Dougie Kass
just now
absolutely not
when i am wrong as rain on the market, i trade much more actively to hit the cash register – since i dont want to have much long exposure — i typically do this with the indices… so you see all my index trades
i always trade around longs and shorts – always
you see my day/trade/transactional stuff because, well because i am transparent – holds are holds , trades you see as it is transactional
on the short side (as i have been bearish) i have held more than 15 positions for years
i would much prefer catching a primary trend (down or up) and just hold… so much easier.
Positions: None
From Peter Boockvar:
Core retail sales in May rose .7% m/o/m after a .5% increase in April and that was 3 tenths above the estimate. Above this line, sales for autos/parts were up by 1.2% m/o/m after dropping by .9% in the month before. They are up 1.8% y/o/y. Building material sales were flat and up by 1.8% y/o/y. As to be expected, gasoline station sales increased by 3.4% m/o/m and 25% y/o/y with price being the main reason.
Sales were up in furniture, clothing, sporting goods, online retail, general merchandise (like department stores) and in the miscellaneous category which includes dollar stores, convenience stores, pet, etc…
On the downside, sales fell for electronics after strength in the prior months and still up 5.9% y/o/y. Sales dropped by one tenth at eating/drinking establishments but after a .9% rise in April and sales here were up 2.4% y/o/y.
Bottom line, a lot coursing thru this data. We have tax refunds on one hand but we also have inflation, mostly at the gas pump on the other and a reminder too that this data is in nominal terms. Wages are still growing but now less than inflation and in part why the savings rate keeps dropping. And we wonder how much of the lift in sales was a consumer response to buy things ahead of expected price increases.
While not apples to apples, headline retail sales were up 6.9% y/o/y (after a 4.8% increase in April) vs the May CPI rise of 4.2% (vs 3.8% in April).
Treasury yields didn’t move much in response with the 2 yr at 4.06%, the 10 yr at 4.43% and the 30 yr at 4.93%.
Positions: None.
Let’s break down May retail sales report and its implications for the economy and the Pro Portfolio.
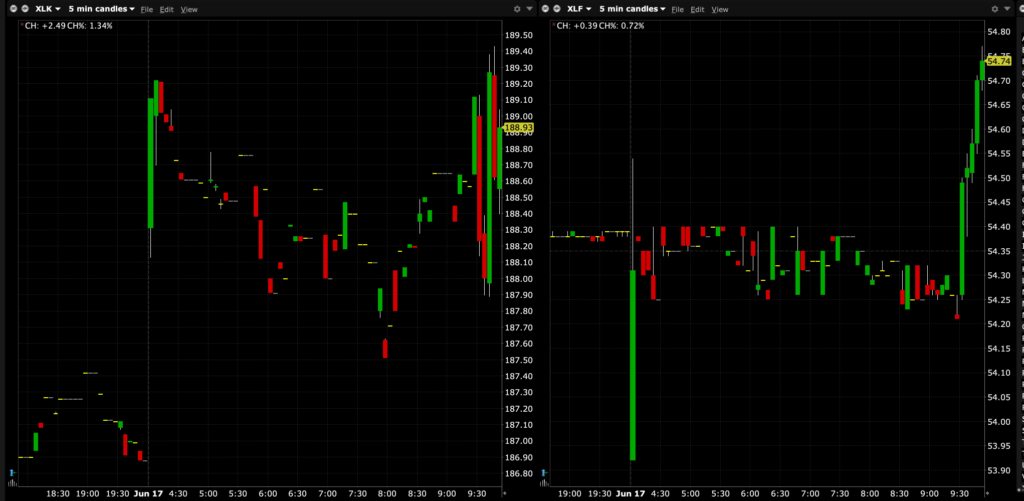
Chart from 9:52 a.m. ET.
Positions: None.