Kass: History Doesn’t Repeat, But Today’s Market Is Rhyming Loudly


The AI Boom is a potentially toxic combination of 1997 and 2007.
The AI Boom is a potentially toxic combination of 1997 and 2007.
* I believe we have seen the high in most averages for the year.
* Risks are underappreciated.
* Downside market risk currently dwarfs upside reward — perhaps materially so…
What follows is a combination of Diary posts and communications to my Limited Partners at Seabreeze:
I remain net short (about 15%) in exposure.
Given that nearly every concern we have expressed over the last 18 months is now being realized (see below), our short position should probably be higher. However, given our decades of experience, risk management/discipline and respect for market prices, price action and the changed market structure, we have not yet increased our short exposure.
That said, the market’s advance is again narrowing, interest rates are moving higher, inflation remains persistent and the probabilities of an adverse return outcome from the enormous AI capital spending spree is increasing. So, depending on price action and fundamental developments, I am more receptive to expanding our net short exposure at the current time.
In today’s commentary I will briefly explain why I feel equities are overvalued, why I am comfortable being net short and why I am considering adding to our short exposure.
Equities have been resilient reflecting the market structure dynamic, continued optimism on the part of most market participants (“the buy on the dip mentality continues uninterrupted” and speculation that is running amok) that a sharp and extended market decline is unlikely (but not improbable).
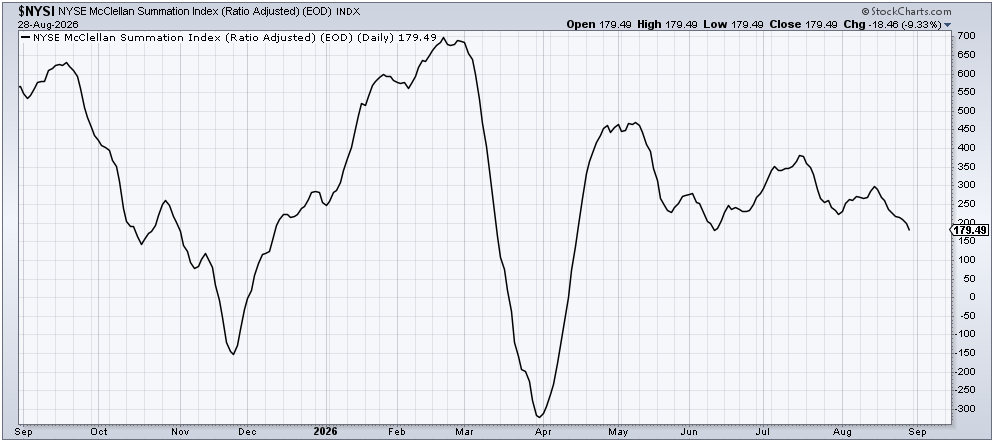
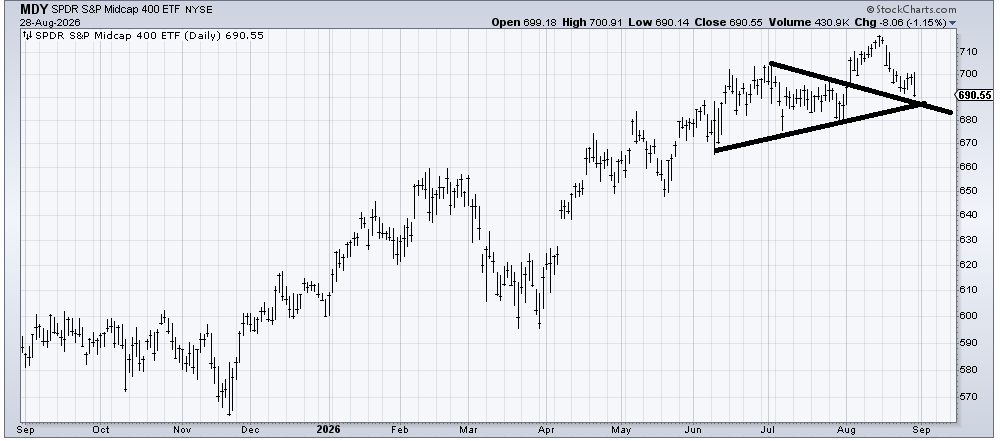
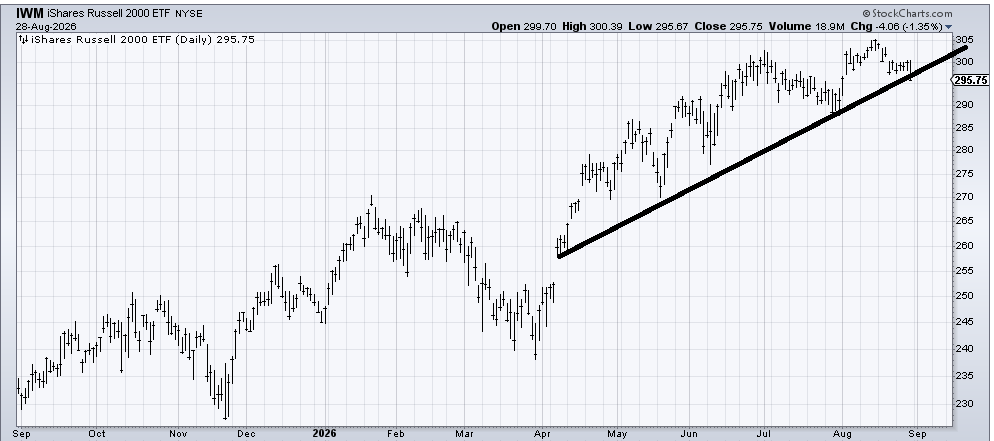
Nonetheless, recent signposts indicate that the market’s advance is narrowing — contrary to the broadly held notion that the market is broadening out. The McClellan Index (NYSI) is faltering, the Mid Cap Index ($MDY) is weakening, the Russell Index ($IWM) is not “crowing” nor is the equal-weighted S&P Index ($RSP) participating in the market’s recent advance.
While the proximate reasons for our ursine market outlook are sticky inflation and higher interest rates, I continue to see other substantial headwinds that argue against a continuation of the bull market and, suggest to us, that downside risk dwarfs upside reward.
Away from sticky inflation and higher interest rates, AI uncertainties lead my lengthening list of (multiple) concerns.
The AI boom is potentially a toxic combination of the dot-com era’s over-investment in the internet infrastructure buildout (1997-2000) and the overextension of housing credit that presaged The Great Financial Crisis of 2007-09.
Like in 1999 and in 2007, there was the promise of transformational change and the abundance and exportation of leverage.
The AI capital spending spree (of data centers) has transformed the Mag 7 from being capital light to be capital intensive — with all the attendant adverse impact on a growing negative free cash flow status.
Nonetheless, as I have documented in past correspondence, numerous and growing factors do not ensure positive AI investment outcomes. We are worried that despite near-universal acceptance that AI will yield an attractive ROIC, that optimism is unwarranted.
Moreover, as in 1999 and 2007, AI has exported possible financial and economic problems if the promise disappoints. (So, whatever happens in AI land will not stay in AI land!)
Anthropic’s CEO Dario Amodei said the following several months ago regarding the risks of committing trillions of dollars without knowing what demand will be:
“If my revenue is not 1 trillion dollars, if it’s even $800 billion, there’s no force on earth, there’s no hedge on earth that could stop me from going bankrupt if I buy that much compute… If I’m just off by a year in that rate of growth, or if the growth rate is 5x a year instead of 10x a year, then you go bankrupt.”
Yesterday Amodei tweeted another warning:
* AI has been the straw that has stirred the market’s and our economy’s drink — as such, it may represent the biggest risk to equities:
1. The likelihood that the unprecedented AI capital spending spree fails to return the cost of capital.
2. The questionable AI spending boom (characterized by double and triple ordering) means to us that companies are overearning and that the current nominal strength in corporate profits (which forms the foundation of the bull market argument) may be short lived).
3. AI’s digital doomsday? Brace For Impact, The AI Trade Just Hit A Wall At Full Speed
4. Take out the AI spending boom and the U.S. economy is foundering with the American consumer succumbing to weak real disposable income and a measurable drop in the savings rate.
* Undisciplined fiscal policy from both political parties means, among other things (and as mentioned previously), interest rates will be higher for longer.
* Improvisational geopolitical policy that may have adverse economic, trade and corporate profit repercussions.
* An equity risk discount (the ERP measures the relationship of earnings to the risk-free rate of return) and other historically high valuations against almost every traditional metric (Cape Shiller, the Buffett Ratio and the Gordon Model, etc.).
* Today’s “passive” market structure and hidden and unhidden leverage risks have not been seen in prior market cycles (see below).
The natural question investors should ask is that with so many potential market and economic headwinds that could product adverse outcomes, why have equities continued their climb in 2026?
This is an essay question, but we will briefly try to explain the reason why we believe stocks have advanced.
* Fool me once shame on you, fool me twice shame on me…
Unfortunately, there is an abundance of growing leverage in all the wrong places that exists in our capital markets and in market participants’ “portfolios” of leveraged products (e.g. 0DTE options, triple/quadruple/quintuple levered ETFs etc).
Years ago, before passive products and strategies (that know everything about price but nothing about value) dominated the investing landscape — reward vs. risk and “margin of safety” were the foundations of active investment management.
No more.
The growing dominance of passive products and strategies that worship at the altar of price momentum is undeniable. Algos and machines don’t read balance sheets, they read headlines. Fundamentals don’t form their investing criteria — price and momentum are the watchwords of their investing faith.
On the retail side, YOLO (“You Only Live Once“) and FOMO (“Fear of Missing Out“) represent an increasing pervasive and ongoing sentiment — arguably contributing to today’s market excesses.
Which brings us to the revelation that, after losing $35 billion of Limited Partners’ capital, the hedge fund Situational Awareness (run by Leopold Aschenbrenner) is back in operation — this time purchasing hundreds of millions of call options on the same names he owned in his hedge fund portfolio that blew up.
Aschenbrenner is somehow back and doing the same thing:
Leopold Is Back: Situational Awareness Rerunning Exact Same Trades Which Blew It Up A Month Ago
Leo Is Back! Now Pardon Me While I Vomit
The only people more stupid than hedge fund’s Situational Awareness’ Leopold Aschenbrenner are his continuing investors…
That said, the “rebirth” of the Situational Awareness hedge fund is yet another example of the amount of speculation that still exists today.
“Those who cannot remember the past are condemned to repeat it.”
– George Santayana
History rhymes.
It is my view that an investor without a memory is a madman.
The many signposts I see today remind us of some elements of 1999 and 2007. I feared those developments back then and profited from their occurrence.
I plan to profit from them in the future.
Position: None
* Equities are not broadening out
* Several time-tested valuation models point to downside risk dwarfing upside reward…
Yesterday I quoted from portions of The Divine Ms M’s column in which she delivered an important message that the market WAS NOT BROADENING OUT (contrary to those in the business media who have said the opposite).
Today I will touch on several valuation models (the Gordon, Greenspan and the Equity Risk Premium models) that are being ignored and that highlight the markets’ possible overvaluation.
Divine’s pearls of wisdom (and charts) were important enough to repeat in its entirety:
*The McClellan Index (NYSI) is faltering, the Mid Cap Index ($MDY) is weakening, the Russell Index ($IWM) is not “crowing” nor is the equal weighted S and P Index ($RSP) participating in the markets’ recent advance…
Contrary to the near universally bullish narrative of most of the “talking heads” in the business media, the market is not broadening out — at least not as measured by the McClellan Summation Index, the Mid Cap Index, Russell and Equal Weighted S&P Indices.
Let’s look at the facts and charts, delivered by The Divine Ms M (Helene Meisler) on TheStreetPro this morning:
When we look back at the month of August, you might recall I had been of the mind that the ‘others’ would have a difficult month. It did not pan out as I envisioned. However, indicator-wise, you can see perhaps it has. Look at the McClellan Summation Index, which I think shows us what the majority of stocks are doing. It has been trending down for more than two weeks already, and if you squint hard enough, you can see it has made a lower low than late July and is closing in on the early June low.
If we look at the chart of the Mid Caps, we can see they are pretty much down on the month. The chart shows that rise early in the month that has been leaking without much fanfare for the last two weeks. It is coming into some decent support in the 685 area.
The IWM hasn’t escaped the same type of leakage. It too is back where it was in early August, having given up the gains that got folks so excited early in the month. It is also back where it was in June.
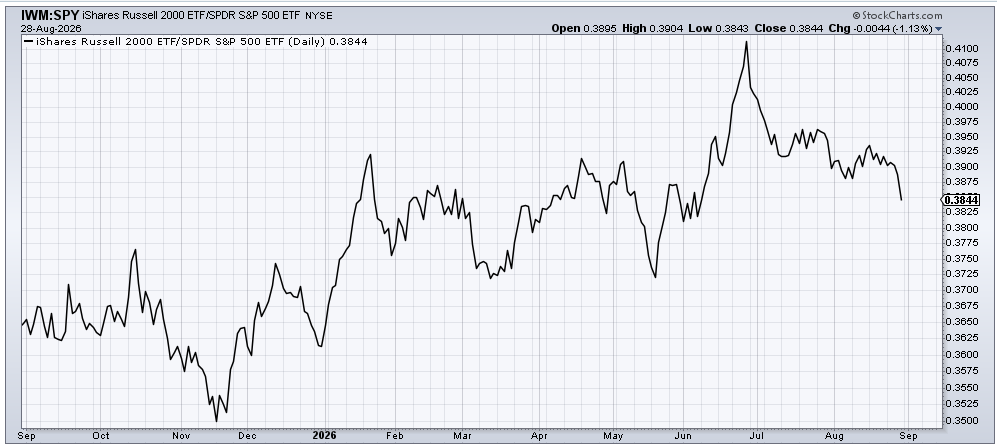
For all the hootin and hollerin about how great small caps were (are?) relative to large caps, the ratio of IWM to SPY says that narrative is wrong. That ratio peaked two months ago and just made a minor lower low. You can see it accelerated in the last week.
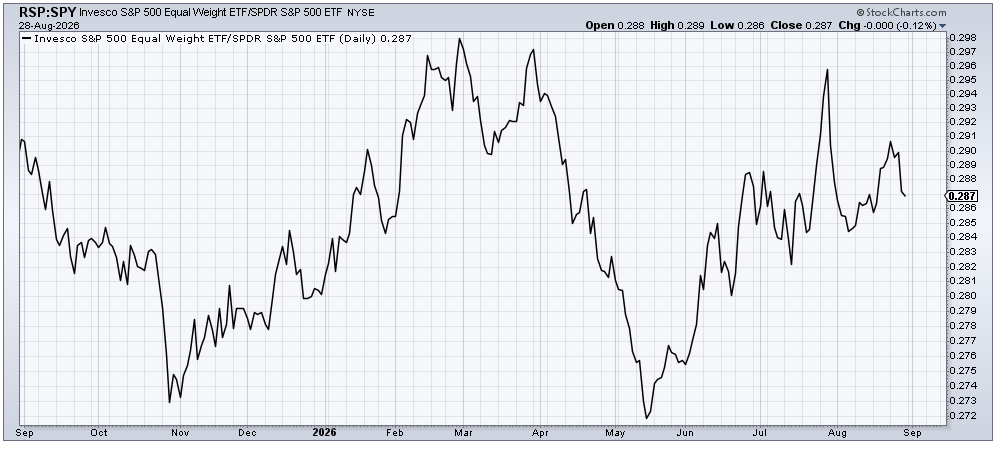
And what of everyone’s new favorite ETF, the RSP (equal-weight S&P)? Aside from the fact that the ratio peaked back in late February, notice all that supposed broadening out peaked in late July—exactly when the SOX/tech stocks made their lows. This ratio turned south last week as well.
When you see these charts, you can understand why in the very short term, the market seems oversold. But you can also see that the Either/Or Market remains intact.
BY Doug Kass · Aug 31, 2026, 7:30 AM EDT
Position: None
* The McClellan Index (NYSI) is faltering, the Mid Cap Index ($MDY) is weakening, the Russell Index ($IWM) is not “crowing” nor is the equal weighted S and P Index ($RSP) participating in the markets’ recent advance…
Contrary to the near universally bullish narrative of most of the “talking heads” in the business media, the market is not broadening out — at least not as measured by the McClellan Summation Index, the Mid Cap Index, Russell and Equal Weighted S&P Indices.
Let’s look at the facts and charts, delivered by The Divine Ms M (Helene Meisler) on TheStreetPro this morning:
When we look back at the month of August, you might recall I had been of the mind that the ‘others’ would have a difficult month. It did not pan out as I envisioned. However, indicator-wise, you can see perhaps it has. Look at the McClellan Summation Index, which I think shows us what the majority of stocks are doing. It has been trending down for more than two weeks already, and if you squint hard enough, you can see it has made a lower low than late July and is closing in on the early June low.
If we look at the chart of the Mid Caps, we can see they are pretty much down on the month. The chart shows that rise early in the month that has been leaking without much fanfare for the last two weeks. It is coming into some decent support in the 685 area.
The IWM hasn’t escaped the same type of leakage. It too is back where it was in early August, having given up the gains that got folks so excited early in the month. It is also back where it was in June.
For all the hootin and hollerin about how great small caps were (are?) relative to large caps, the ratio of IWM to SPY says that narrative is wrong. That ratio peaked two months ago and just made a minor lower low. You can see it accelerated in the last week.
And what of everyone’s new favorite ETF, the RSP (equal-weight S&P)? Aside from the fact that the ratio peaked back in late February, notice all that supposed broadening out peaked in late July—exactly when the SOX/tech stocks made their lows. This ratio turned south last week as well.
When you see these charts, you can understand why in the very short term, the market seems oversold. But you can also see that the Either/Or Market remains intact.
Position: None