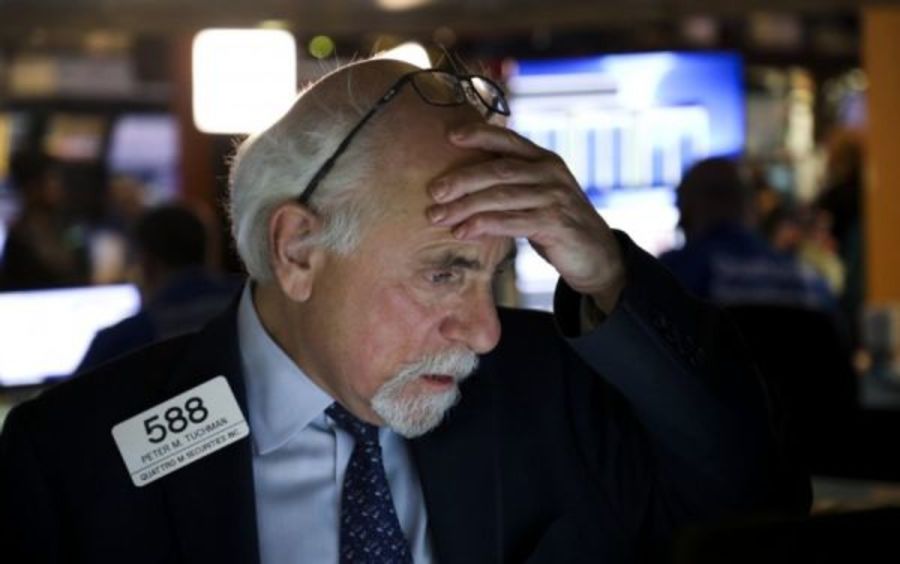
This 186-Day Stretch is the Longest in 30 Years

It’s never different. The market always rhymes. That’s why this indicator suggests volatility on the horizon.
It’s never different. The market always rhymes. That’s why this indicator suggests volatility on the horizon.
I expect the market to get overbought this week, but it won’t happen with days like these.
This week’s sentiment survey will tell us where our team stands on the stock market before digging in on Tesla, SpaceX, and Palantir. Plus, why your 401(k) may be invested in the wrong things.
It’s vacation time for many, but the markets don’t rest. Let’s look back at several historic Augusts that began quietly and ended with volatility.
Despite the dullness, there were some interesting things to notice. Let’s dig into the NYSE New Lows indicator and more.
Plus, where on the sentiment cycle is the software sector?
Let’s dig in to the sentiment, options, and momentum indicators.
Let’s dive in and look at the equal-weight S&P and try to understand why breadth isn’t stronger.
Ten straight red days for the utilities. Could a bottom near support be what they need to move higher?
With the S&P 500 setting new highs, the bears have left the building. Here’s what I’m paying attention to.