SpaceX About to Tumble?

I am not sure what I see just yet with SpaceX ($SPCX). I do think that I see two developing technical patterns and both of those patterns tend to produce bearish reversals.
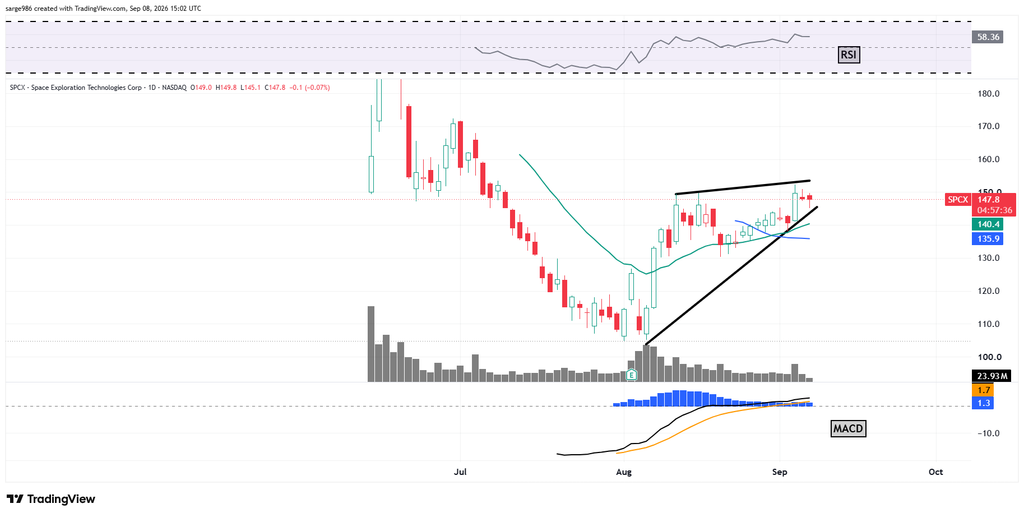
Here is what looks like a developing Rising Wedge. It does seem to be closing rather quickly. I see the crossover of the 50-day SMA (blue line) by the 21-day EMA (green line). We call that a swing trader’s golden cross. That is often considered to be a bullish signal. That said, the signal is far less reliable when the blue line is falling as it is here. The lower trendline of the wedge would be the downside pivot in this case.
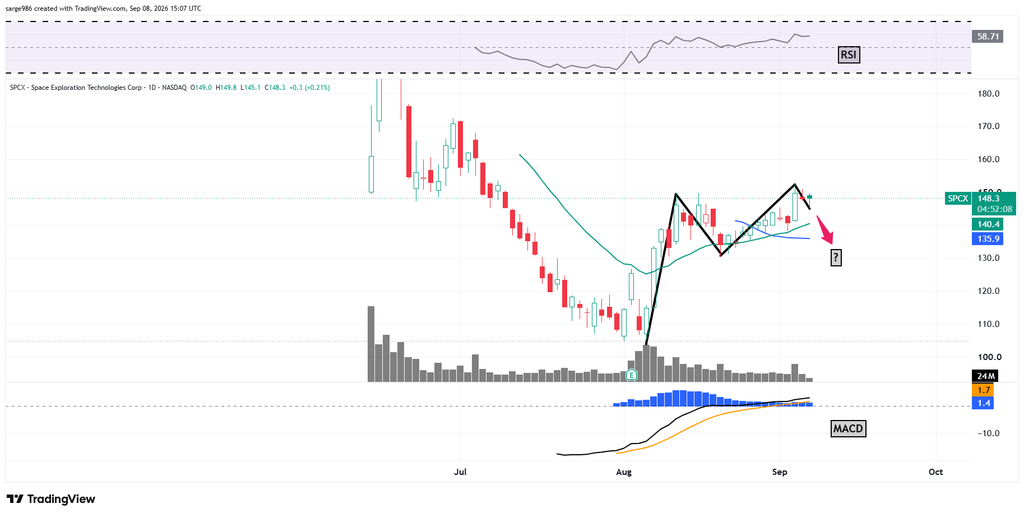
Now, I see a potential Double Top pattern developing with a downside pivot of $130. That’s the central low-point of the pattern. Can we trust it? I am not sure that I trust anything anymore. Both Relative Strength and the daily MACD are set up rather bullishly. That said, two potential patterns of bearish reversal, even if they are still incomplete, probably should not be ignored.
Position: None
