Why a Little-Known Korean Company Is Sending Markets South


Elice differs from the likes of CoreWeave even as its shares descend 32.0% on IPO day.
Elice differs from the likes of CoreWeave even as its shares descend 32.0% on IPO day.
Position: None
My index trades are not A Random Walk Down Wall Street — though, to some, they may seem to be based on “gut.”
To understand my moves I turn back to my mentor The Chief — who was arguably the best tape trader I have ever met.
Let’s begin with Jerry’s SS or slow stochastic. This has a longer timeframe, which takes time to develop. But, when the SS got to the bottom of the page, it is an excellent buy signal.
Jerry also invented and I use his SS RJ (and the CSJ which is a 15-minute version of it). The SS has a weekly timeline. It utilizes daily data but the highs and lows play out over a longer-term timeframe.
So, when the SS is at the bottom of the page it is as strong a signal to buy as when it is a signal to short at the top of the page. (The Chief would say that that his indicator is far better at the bottom of the page than at the top!)
That’s all I am going to give you or The Chief would sent out a hit on me.
Position: None
Here are today’s things:
* I shorted $SPY at $770.96 and covered the short at $768.98.
* I added to $MSOS at $3.85.
Position: Long MSOS common (VL) and calls (VS)
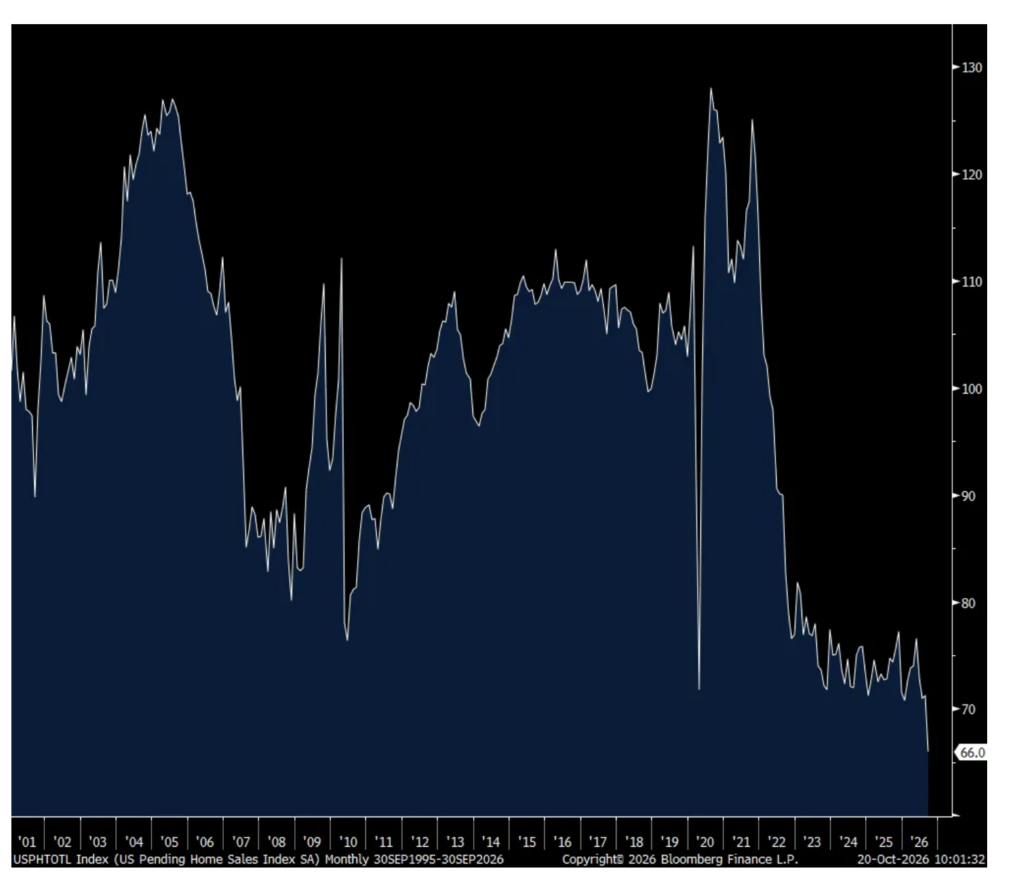
Contract signings for existing homes see the biggest drop since December, sending the index to its lowest level in data back to 2001.
Wolf Street howls about the record low in pending home sales.
Position: None
The following is from Peter Boockvar:
Home construction and sales in September
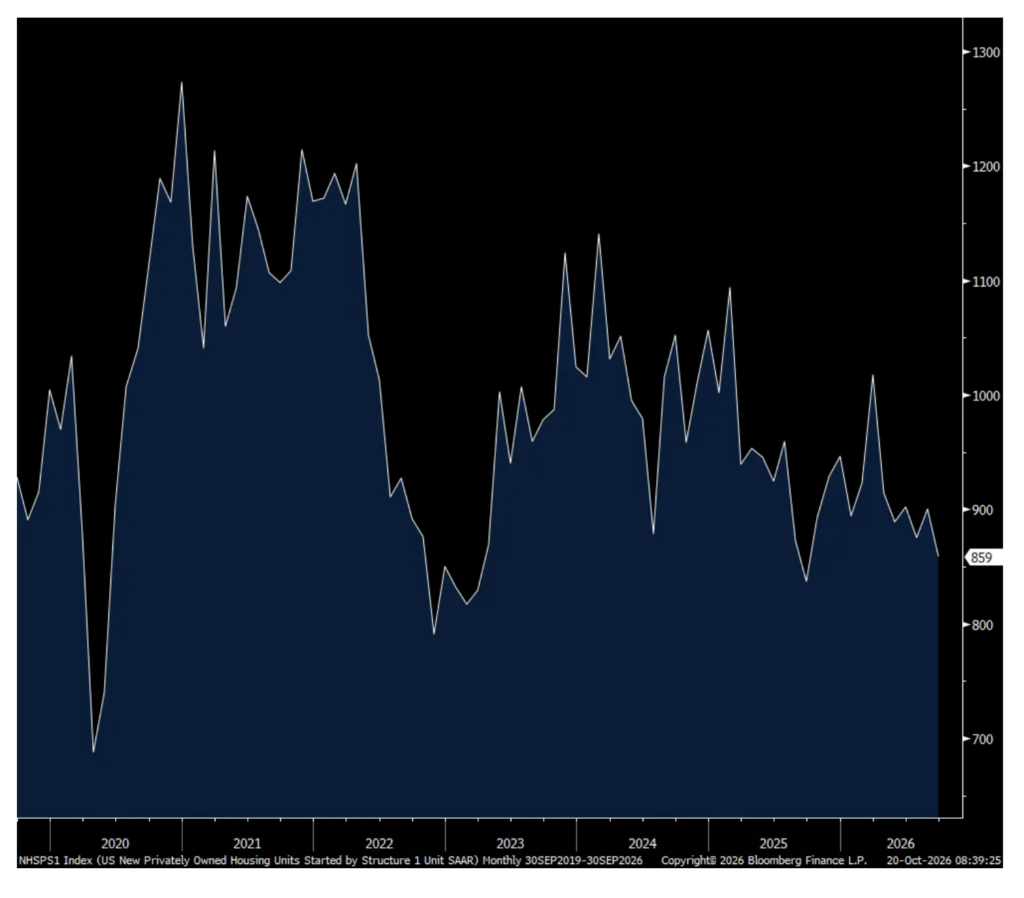
September single family housing starts fell to 859k from 900k and vs 875k in the month before. That’s the least in a year but not surprising considering what we’ve heard from the homebuilders, the affordability challenges the buyer faces and the supply issued builders face.
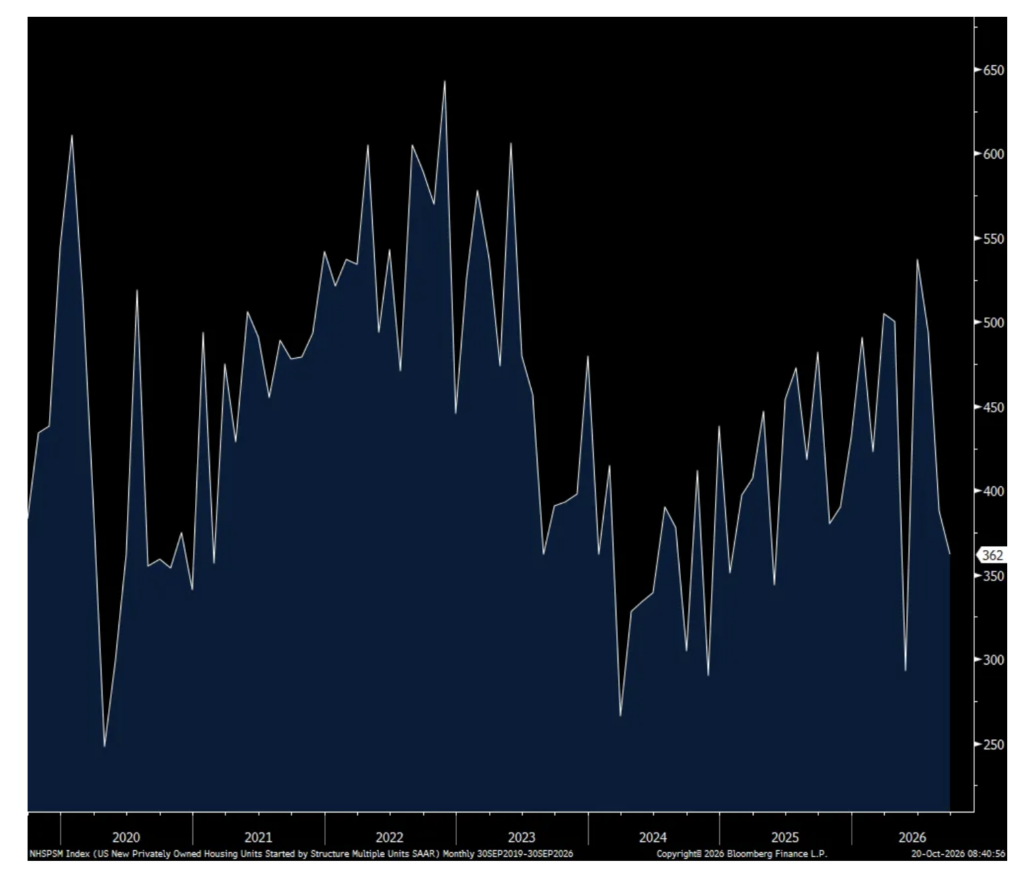
Multi family starts slowed to 362k from 388k in August and vs 494k in July. This is a very volatile monthly figure but most relevant hearing from the publicly traded multi family REITS, sunbelt construction has slowed dramatically. I do believe though new starts have picked up in the coastal states and apparent in the Tri-State area burbs that I see.
Permits for single family homes fell to 845k and that is the lowest since March 2023. They rose to 555k from 523k for multi family.
With buying a home for a first time interested buyer ever more difficult, I think the excess apartment supply in parts of the country will get further absorbed and in 2027 we’re going to see an inflection up in rents again. Single family starts will remain challenged until income gains catch up to the price increases and/or mortgage rates fall.
And on the supply side, I’ll mention here again what was said in yesterday’s NAHB report: “tight lending conditions and elevated land, labor and construction costs persist” and “Builders also continue to face higher material costs, rising gas and diesel prices and persistent labor shortages. In some markets, builders report that increased immigration enforcement is discouraging legal workers from reporting to job sites.”
Single Family Housing Starts
Multi Family Starts
With regards to pending home sales in September, they plunged by 7.3% m/o/m, well worse than the estimate of down just .5%. It now sits at a fresh low for this data point back about 25 years. The weakness was across all four main regions.
The reason is obvious, “Market conditions weakened in September due to fast-rising mortgage rates” said the NAR. Nothing more to add as we know exactly the challenges being faced in this key part of the US economy.
Pending Home Sales
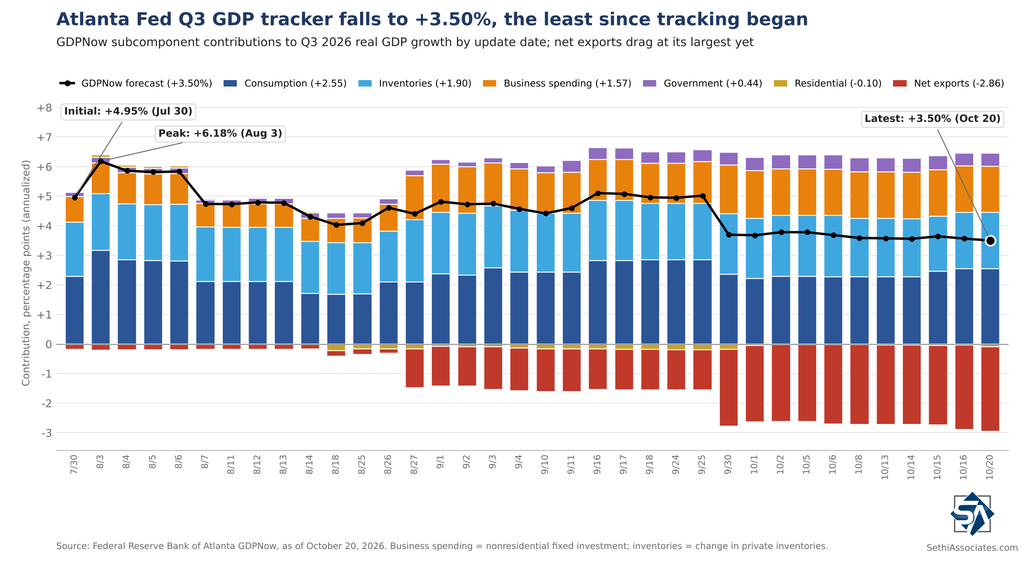
The Atlanta Fed’s Q3 real GDP tracker slipped to +3.50% as of October 20, the least since it initiated tracking and down from +3.59% on October 8th.
A +0.28% rise in the contribution from consumption (to +2.55% from +2.27%) after the retail sales report was more than offset by three declines: a -0.17% drop in net exports (to -2.86% from -2.69%) after the import and export prices data, and smaller declines in inventories (-0.08%) and residential investment (-0.07%, after this morning’s housing starts).
This continues to be consistent with my ongoing caveat that in both Q1 and Q2 we saw this indicator fall sharply the month before the actual GDP reads (which for Q3 will be next week).
The reading for now remains above the blue chip consensus* of ~+2.5%.
Here’s the breakdown of the components as of October 20 and changes from my last update October 8:
Consumption = +2.55% (+0.28%)
Inventories = +1.90% (-0.08%)
Nonresidential fixed investment (biz spending) = +1.57% (+0.01%)
Gov’t = +0.44% (-0.04%)
Residential investment = -0.10% (-0.07%)
Net exports = -2.86% (-0.17%)
GDPNow Forecast: +3.50% (-0.09%)
Positions: None.