New Market Catch-22: Meta Spends Too Much, Tesla Too Little


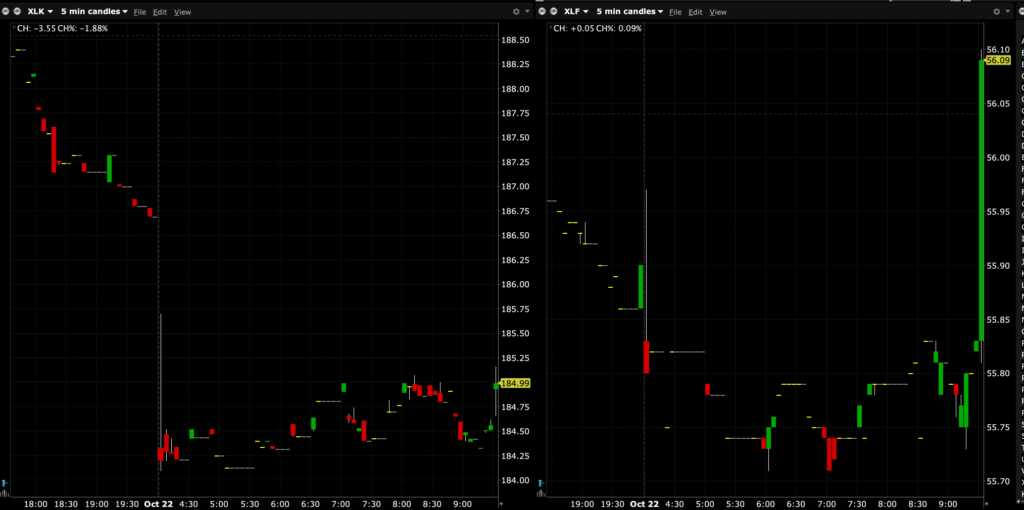
Meta’s spending warnings and share-class fine print, Tesla’s capex cut, and a ‘not good enough’ beat from Lam Research are dragging Tech lower adding to a broader risk-off tape.
Meta’s spending warnings and share-class fine print, Tesla’s capex cut, and a ‘not good enough’ beat from Lam Research are dragging Tech lower adding to a broader risk-off tape.
Dougie Kass
39m ago
I am no longer dwelling on the BS from panelists on the shows.
But as I have warned when the tide goes out you will realize the absence of analytical rigor and process.
The panelists, you will also realize, will not revisit their losers.
They will never timestamp because viewers would realize the “jig is up.”
Panelists want to seem/look smart – they want to polish their images as they are asset gatherers or are selling a service.
But look at the shares of homebuilders, $RDDT, $SHAK, $BABA, $TTAN, $GEV, $UBER, $NFLX and the many others that were confidently recommended by the panelists of floor traders, veterans of Long Island Boiler Room brokerages, phony technical analysts (who don’t even know what a fractal is or who Mandlebrot was!).
I have highlighted their BS as an advocate of the retail viewer who all generally think being a regular panelist on CNBC means alot.
It means virtually nothing.
Positions: None.
We’ll continue to track the data and signals, biding our time for better technicals and compelling opportunities.
Despite protestations from Slink and others who had contained credit spreads as a foundational part of the bullish market view:
Positions: None.
Positions: None
As Rocket Labs teases, I’m buying more, but lowering my expectations.
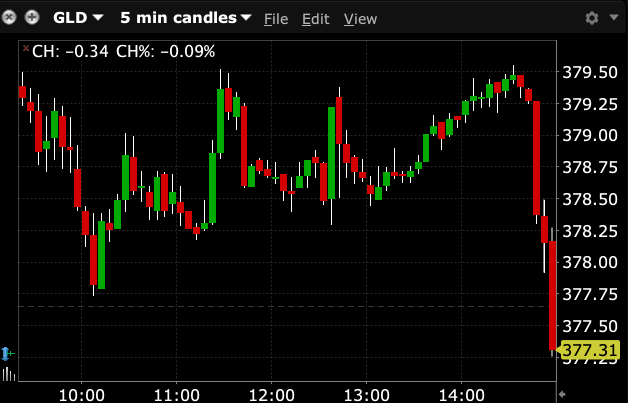
$GLD is -$7 today.
I would continue to avoid bottom fishing.
Repeating for emphasis:
There’s No Gold in Them Thar Hills Today
Position: None
BY Doug Kass · Oct 21, 2026, 3:48 PM EDT
Positions: None
Positions: None.
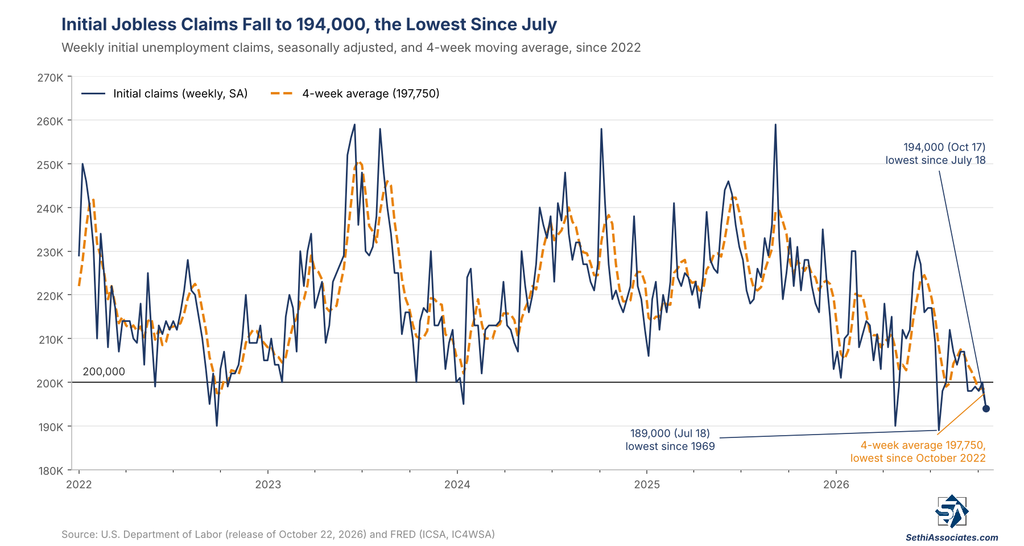
Initial jobless claims for the week ending October 17: 194,000 (estimate 200,000; previous 199,000; revised previous 200,000)
Continuing claims for the week ending October 10: 1,728,000 (previous 1,710,000; revised previous 1,703,000).
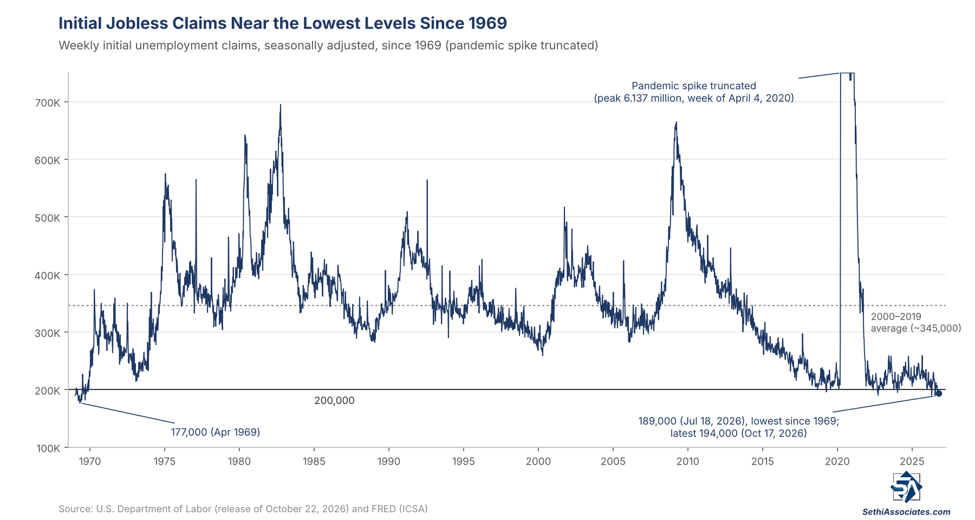
After bottoming at 189,000 in mid-July — the lowest reading since 1969 — initial jobless claims have barely budged, this week falling 6,000 in the week through October 17 to 194,000, the lowest since July 18 (from a revised 200,000 the prior week). That makes it only the 16th week below 200,000 since 1969, leaving claims near cycle lows at the bottom of the relatively narrow range that has held since November 2021. The upward revision to the prior week, to 200,000, ended the run below that mark at four straight weeks (September 12 through October 3), still the longest since 1969.
The four-week average fell 1,000 to 197,750, the lowest since October 2022 (roughly 30,000 lower year-over-year).
Continuing claims (seasonally adjusted) in the week through October 10th (one week lagged) though rose 25,000, the largest weekly increase since February, to 1,728,000 (after a 7,000 downward revision to the prior week), but remain near the least since April 2023 hit three weeks earlier and towards the bottom of the roughly 1.70 million to 2.0 million range that has held since mid-2023 — historically low, though not quite as low as initial claims.
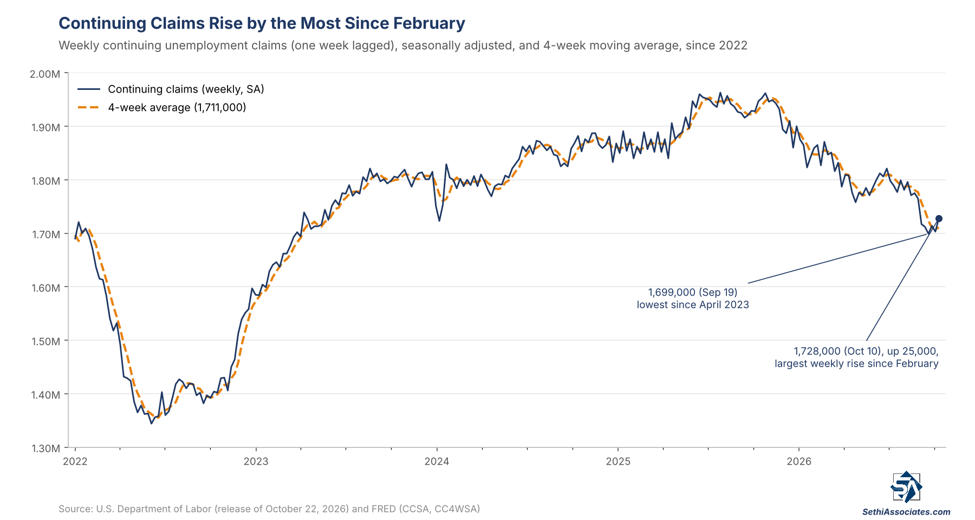
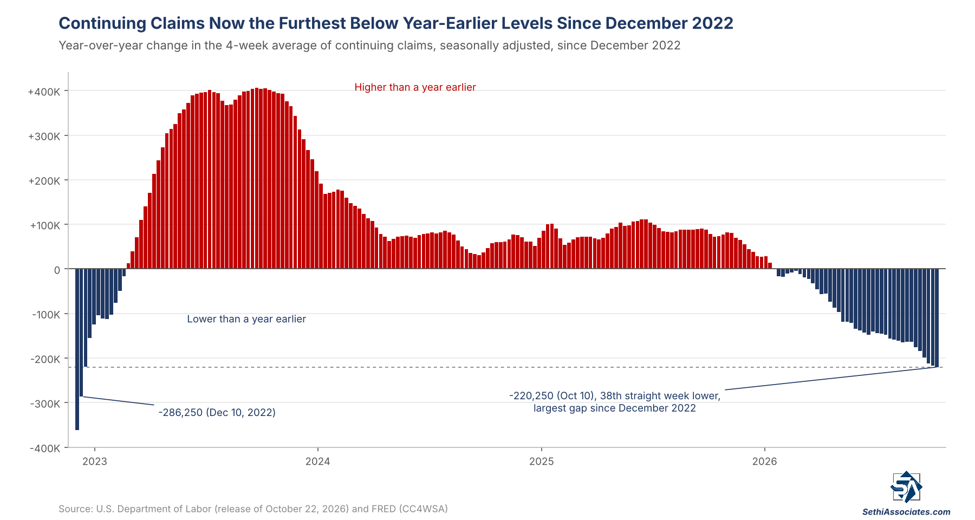
The four-week average of continuing claims rose 4,000 to 1,711,000 (after the prior week was revised down to 1,707,000, matching the lowest since April 2023), but remains lower year-over-year for a 38th straight week (down 220,250) — the largest such gap since December 2022.
The 20-year pre-pandemic average for initial claims is 345,000 and continuing claims roughly 2.9 million.