Looking into ASTS

Earlier this week, AST SpaceMobile ($ASTS) released the firm’s second quarter financial results. For the period ended June 30, AST SpaceMobile posted a GAAP EPS of -$0.77 on revenue of $31.52 million. These top- and bottom-line results both fell well short of Wall Street’s expectations. Despite the fact that the sales print reflected annual growth of 2,617%. Hmm…
So, why am I in the stock? Three reasons:
1) The firm signed partnerships with over 60 MNO partners globally who collectively cover over 3 billion subscribers.
2) The firm’s order backlog increased to approximately $1.3 billion in aggregate contracted revenue including both commercial partners and contracts awarded by the U.S. government.
3) During the call, CFO Andrew Johnson said, “We remain on track to meet our full year 2026 revenue guidance of $150 million to $200 million.” That keeps the midpoint of the range above the $169 million that Wall Street had in mind.
The Chart
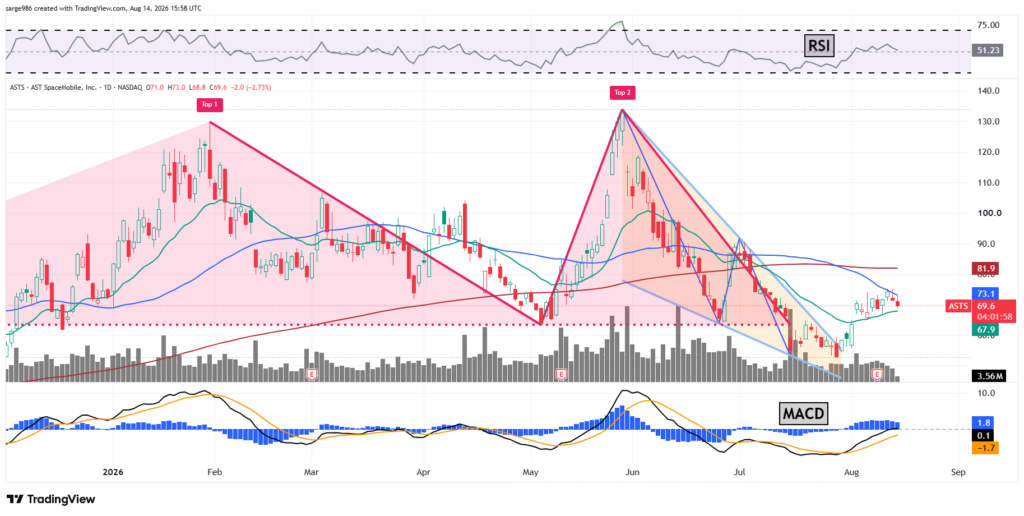
Readers will see that ASTS came into this year riding the first peak of what became a double-top pattern of bearish reversal. That setup worked well. Readers will then note that coming out of that setup, as the stock sold off through June and July, the shares developed a falling wedge of bullish reversal. This appears to be working as well. The stock broke out from that closing wedge in late July, ahead of the numbers.
The stock has since retaken its 21-day EMA (green line), engaging the swing crowd. The last sale now stands in between that line and its 50-day SMA which has acted as resistance. Investors need to see the stock make a run at both that blue line and the 200-day SMA as they are not that far apart and that would all but ensure increased participation by professional managers.
Moving on to the indicators, relative strength is looking rather non-committal. However, the daily MACD is looking much better than it has. The histogram of the nine-day EMA is now in positive territory which is a bullish signal. In addition, the 12-day EMA has overtaken the 26-day EMA, which is also bullish. Both of those lines appear to be moving toward the zero-bound. Should these two lines move into positive territory together, the bullish signaling would then be amplified. I think $101 is realistic.
Positions: Long ASTS equity.
