Heads Up on AMD?
I wrote a piece on one of my favorite holdings, Advanced Micro Devices ($AMD) here at TheStreet Pro earlier this week. I still believe what I wrote. My target price is still $588. I have been looking at the chart, though and think perhaps a bit of warning (not a call to panic) may be in order. This is the chart that I gave you…
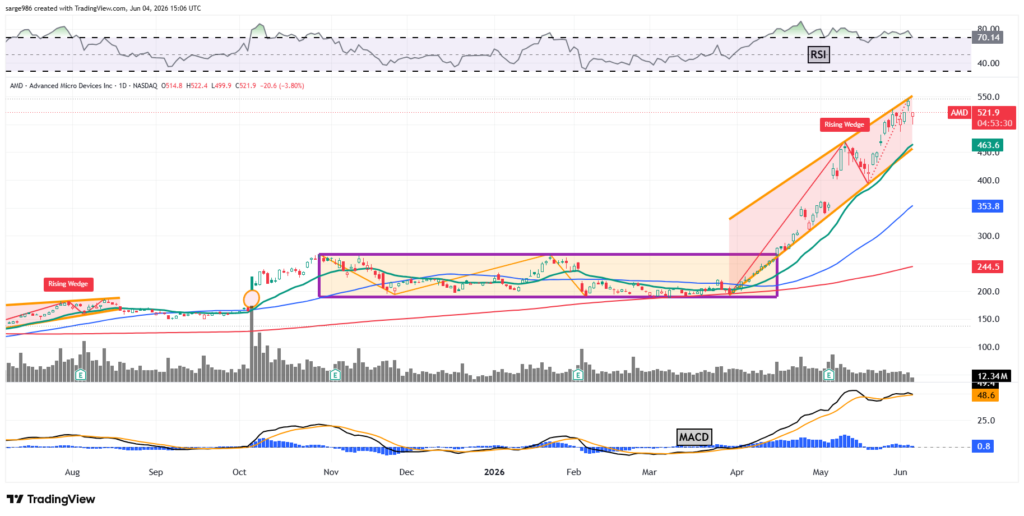
I wrote the following: “Readers will see that AMD broke out sharply in April from the basing pattern (rectangle) of consolidation that ran from late October into late April. The shares obliterated my temporary target price of $456 as May wore on. We sold a small amount. What now? The shares look to have created a Rising Wedge pattern of bearish reversal as Relative Strength had reached technically overbought levels. The daily MACD is also ripe for some bloodletting.”
I then added, “How severe will it be? I’ll tell you what I’m doing. I am likely to add should the stock approach the mid-May high of $470, but not before.” So, I’ve had a clue that a sell-off could be coming. Now, we’ll erase the Rising Wedge pattern, which can be bearish to begin with, and see what we can see…
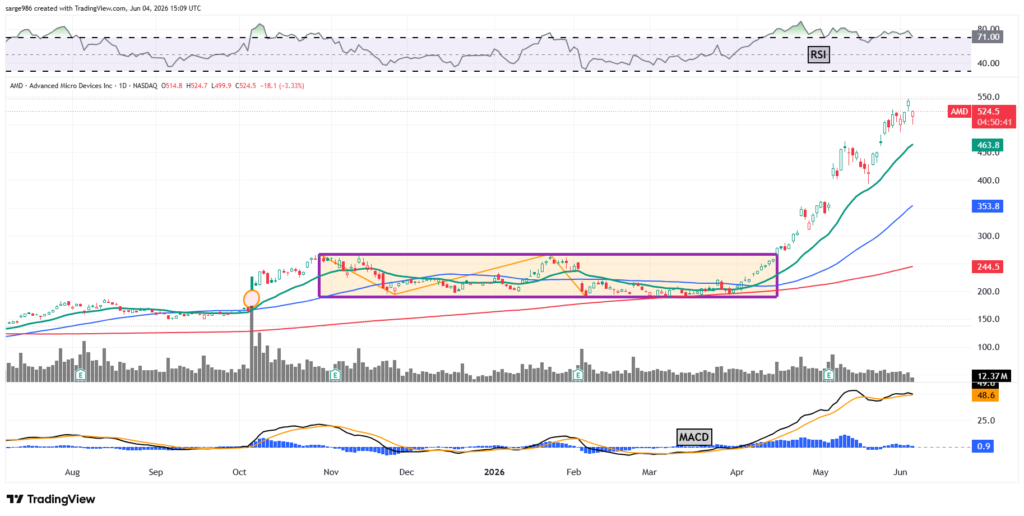
Looks a lot like a head & shoulders pattern of bearish reversal, doesn’t it. Should that pattern come to fruition, it should be noted that H&S patterns, in my non-scientific opinion, are more reliable than Rising Wedges that in theory can go on almost forever. Just some brain food for the crew here at the Diary.
Positions: Long AMD equity.