Dude, Get a Dell?

See that run from January into late spring? Dell ($DELL), a firm that has been a real beneficiary of the AI trade, is currently up 307% year to date. Readers will see the gap higher this past May in response to first-quarter earnings. This makes up a significant portion of that parabolic spike that ended up looking like a flagpole. DELL stock, for the most part, has held and consolidated those gains, developing, as it traded sideways, a Bull Flag pattern of trend continuance.
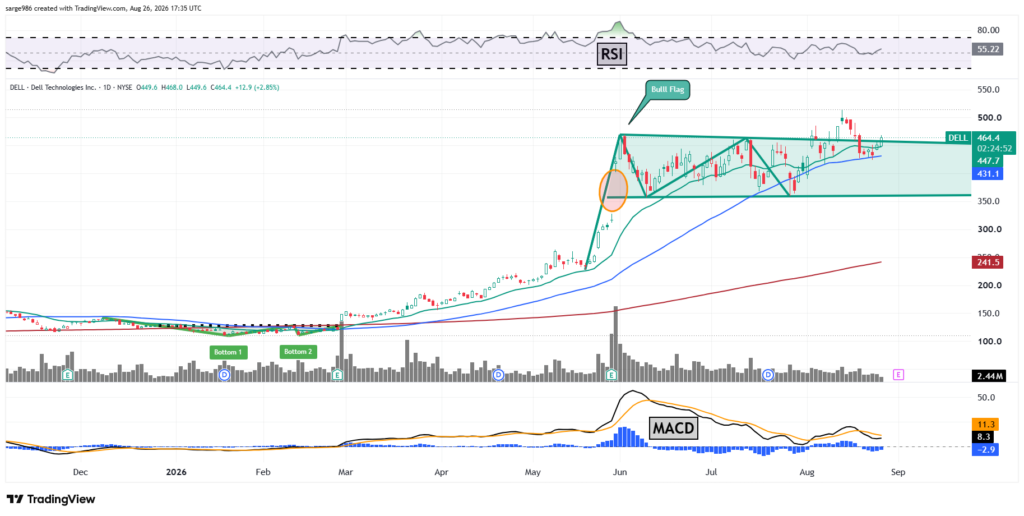
The upside pivot had been the top of the flagpole at $469. This does not change because there has been one failed attempt at breaking out from that pattern. The important thing for the bulls, in my opinion, is that the 50-day SMA has held as support. This implies that professional managers are buying stock at that level.
Moving on to my favored indicators, Relative Strength is barely better than neutral. It’s not really not telling us anything directional. However, below the chart, the daily MACD is sort of sending us a bit of a warning. The histogram of the 9-day EMA has been in negative territory since mid-August, which is a short-term bearish signal. On top of that, the 12-day EMA is running below the 26-day EMA. That is also bearish looking. With both of those lines still standing above the zero-bound, the signal is less profound, but I would proceed with a bit of caution.
Position: None
