Closing Out Our Snap Options Position After Strong Gains
Two of our “$10K Portfolio” companies reported their quarterly numbers on Thursday after I took off for a long weekend. Let’s get into it.
Ondas Inc (ONDS)
For the three-month period ended March 31, Ondas Inc ($ONDS) posted an adjusted EPS of -$0.07 (GAAP EPS: $0.56) on revenue of $50.122 million. These top- and bottom-line results both absolutely smashed expectations. The top-line print was good enough for year-over-year growth of an astounding 1,079%. The adjusted bottom-line number compares well to the year ago GAAP print of -$0.15. The GAAP EPS print is not comparable due to a non-cash gain of $389.5 million in a fair value re-measurement in the value of warrants held by the firm. Operating loss came to $42.7 million.
The balance sheet is very, very strong. Current assets add up to $1.629 billion, including a cash position of $1.485 billion and inventories of $34.386 million. Current liabilities printed at $149.317 million, including short-term debt of just $771,000 but deferred revenue of $19.627 million. The firm’s current ratio stands at 10.93. This rises to 12.63 when adjusted for deferred revenues. Total assets amount to $2.447 billion, of which about 28% is labeled as either goodwill or other intangibles. Total liabilities less equity comes to $1.367 billion. This does include warrant liability of $1.059 billion. This will at some point lead to some dilution of equity but does not impact operations.
Ondas has increased full-year revenue guidance to $390 million-plus from the prior outlook for $375 million-plus. This takes the firm’s view above the $379 million that Wall Street had in mind. That is largely due to a pro-forma order backlog that has reached $457 million, up from just $68.3 million at the start of 2026. I call that impressive.
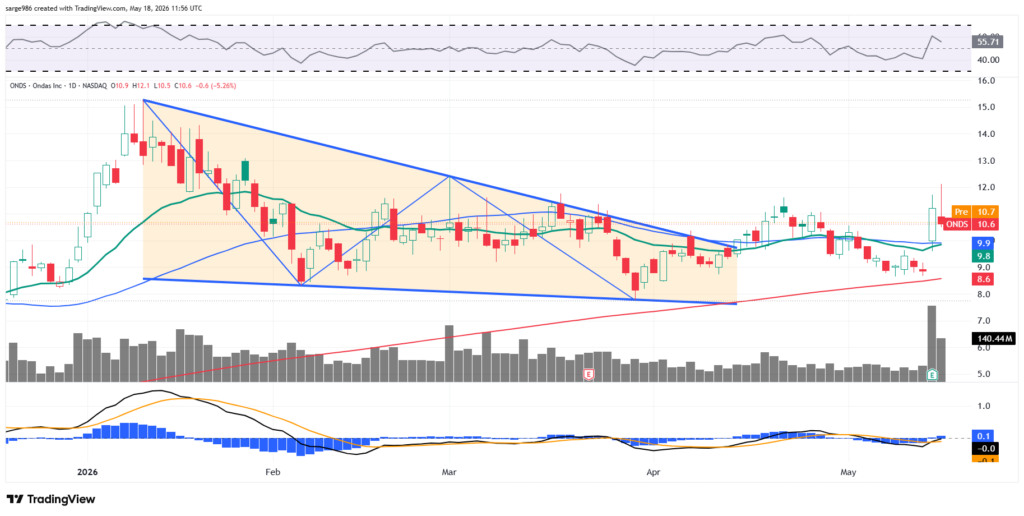
Readers will see the falling-wedge pattern on the daily chart of ONDS that produced this slow-motion breakout. The pivot is now the 50-day SMA, currently at $9.90. Relative strength is better than neutral, while the daily MACD just turned more bullish with a cross over of its 26-day EMA by its 12-day EMA in response to these earnings. The portfolio’s target price is now reiterated at $14.
Sidus Space (SIDU)
For the three-month period ended March 31, Sidus Space ($SIDU) posted a GAAP EPS of -$0.08 on revenue of just $359,000. As small as the top-line number is, that print was good enough for year-over-year growth of 51%. The firm generated a net income/loss of -$5.212 million, up 19% from the Q1 2025 comp of -$6.415 million. The firm’s adjusted EBITDA for the period improved slightly to -$4.627 million.
The balance sheet is in better shape than readers probably expect. Current assets add up to $33.158 million, of which $27.35 million is held in cash. Current liabilities add up to $3.873 million. That puts the firm’s current ratio at a beefy 8.56. Total assets amount to $51.593 million, of which only a very small amount is labeled as intangible. Total liabilities less equity comes to $4.236 million. The firm has no debt of any type on its books.
Founder and CEO Carol Craig commented:
“During the first quarter, we continued to execute our technical roadmap while maintaining disciplined cost control. We delivered high-resolution imagery from LizzieSat-3, advanced customer payload commissioning, and finalized flight ready configurations for next generation systems planned for LizzieSat-4 and LizzieSat-5. These milestones strengthen our on-orbit heritage and position Sidus to support future missions while remaining focused on responsible capital allocation and operational execution.”
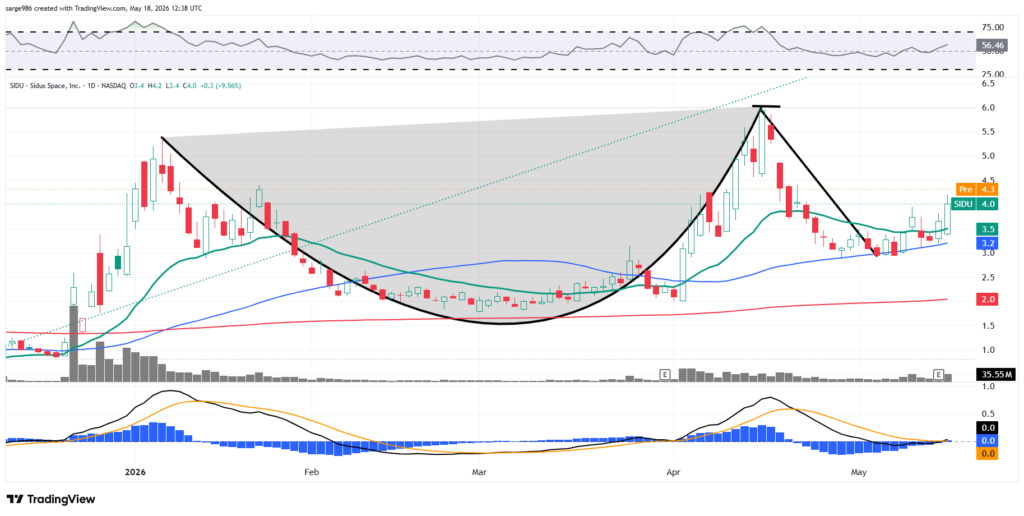
Readers will see that SIDU completed a cup pattern in early April and then added a handle into early March. This is clearly, in my opinion, a bullish setup. The stock found support during the run into earnings at its 50-day SMA. Relative strength is better than neutral. The stock’s daily MACD has returned to a more bullish setup. We’re going to reiterate our $6 target price but understand this can easily be interpreted as a pivot. Taking that pivot would take the target up into the $7.50 to $8 range.
Upcoming Portfolio Earnings
Planet Labs ($PL): After the closing bell on Thursday, June 4
Wednesday’s Intentions vs Wednesday’s Actual Trades
Intention: Sell 15 shares of ($VELO) at or close to the last sale of $16.84, leaving a long position of 45 shares.
Actual trade: Sold 15 shares of VELO at $21.16
Intention: Buy 10 shares of ($EVLV) at or close to the last sale of $6.86, increasing that long position to 60 shares.
Actual trade: Bought 10 shares of EVLV at $5.49
Monday’s Intentions
Given that the ($SNAP) June call that the portfolio sold has already achieved almost 100% of its potential profit, we’ll close out that position to remove the risk of possibly losing that gain.
Intention: Buy one SNAP June 26 $7 call for $.10 or less to close out that position.
Current Positions
-Long 60 shares of EVLV at $5.9895. Target Price: $8.50. Last sale: $5.70.
-Long 25 shares of ($MBLY) at $8.92. Last sale: $9.67.
-Long 150 shares of ($OCUL) at $8.305. Last sale: $9.28.
-Short one OCUL $11 September 18 call at $1.65, Last sale: $1.50.
-Long 125 shares of ONDS at $9.4749. Target Price: $14. Last sale: $10.87.
-Long 10 shares of PL at $37.18. Target Price $47. Last sale: $43.45.
-Long 12 shares of ($PLTR) at $140.30. Target Price: $194. Last sale: $133.47.
-Long 7 shares of ($RKLB) at $62.6157. Target Price: $132. Last sale: $131.43.
-Long 125 shares of SIDU at $2.725. Target Price: $6. Last sale: $4.40.
-Long 100 shares of SNAP at $5.9034. Target Price: $7.50. Last sale: $5.52.
-Short one SNAP $7 June 19th call at $0.45, Last sale: $0.07.
-Long 175 shares of ($SOFI) at $15.9573. Target Price: $24. Last sale: $15.68.
-Short one SOFI August 21 $20 call at $1.02. Last sale: $0.76.
-Long 45 shares of VELO at $12.0136. Target Price: $20. Last sale: $19.90.
Cash: $1,096.41
Portfolio value: $11,884,46, +18.8% from inception on March 24.
At the time of publication, Guilfoyle was long EVLV, MBLY, OCUL, ONDS, PL, PLTR, RKLB, SIDU, SNAP, SOFI and VELO.