Charting the S&P 500: Time for a Consolidation Period
While investors and traders would like to see the markets make gallant moves all at once, the fact is stocks do not go up in a straight line. Of course, if you look at long-term trends and charts it may seem that way, but there are always pauses and hiccups along the way to higher prices and new plateaus.
Recent volatility in markets tell us investors are getting anxious at high levels, and even with a potential end to the Iran War there is quite a bit of tepidness. Investors/traders are not piling in here, knowing a “sell-the-news” effect could just be around the corner.
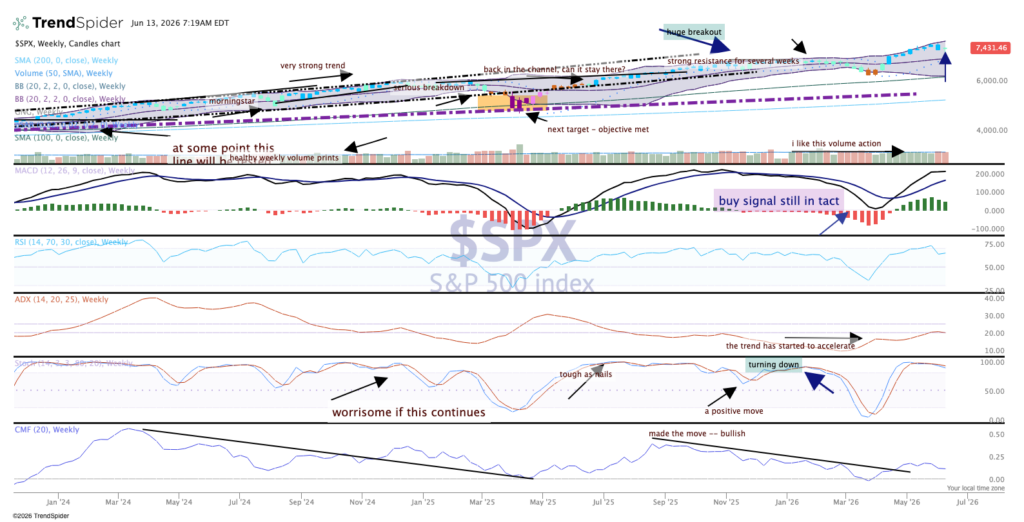
The chart remains constructive for the long-term uptrend, but clearly the indicators have stalled out. Money flow is flattish to down while stochastics (momentum) is just hanging at the top. This is the best indicator to tell us the markets are likely moving sideways to down.
MACD is still on a buy signal but extended, volume this past week was on the bearish side ever so slightly, and given the big IPO of SpaceX ($SPCX) this past week there was still plenty of buying.
More Pro Portfolio:
- We’re Initiating a New Position in a Trucking Play
- Tracking 26 Signals Across 11 of Our Portfolio Investment Themes
- Weekly Roundup: Portfolio Maintains Lead as Select Holdings Do the Heavy Lifting
At the time of publication, TheStreet Pro Portfolio had no positions in any securities mentioned.