Charting the Markets: The S&P 500 Is Following a Script


It wasn’t enough that October 29 was the 97th anniversary of the Crash of ’29. It has been so long since then it was probably the furthest thing from investors’ minds, but with markets failing to rise up this past week and finishing down 1,000 points on the Nasdaq 100 on October 30, any day like this feels like a market crash is happening.
With interest, the S&P 500 had the exact trading week as the prior one, up Monday-Wednesday and down hard the last two sessions of the week to put the markets in the hole. That is not a pattern the bulls want to repeat for a third week, especially if there is a lower low associated with it.
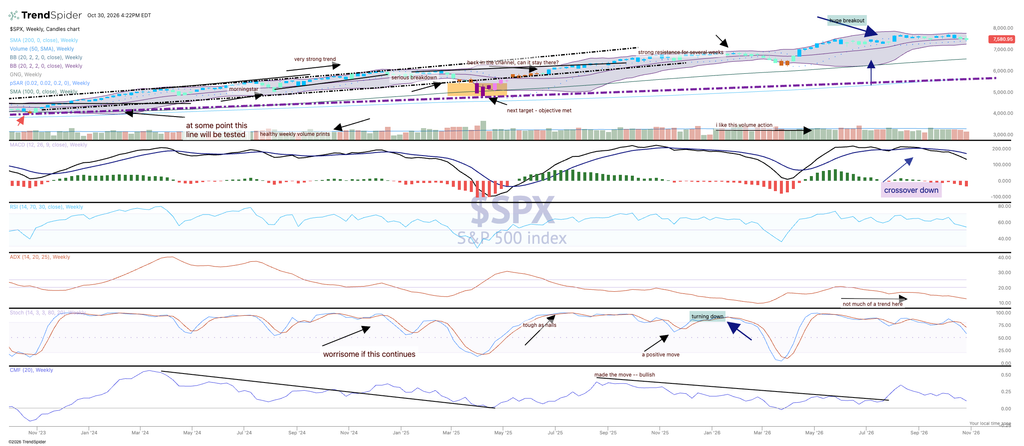
We have been talking about the chart and how bearish it had become over the last six weeks. MACD remains on a sell signal and money flow is about to go negative for the first time since March. Momentum has already rolled over. The only thing slightly positive would be the price chart, which on the weekly is teal.
This was a poor monthly close, the onus is now on the bulls to turn things around the last two months of the year.
More Pro Portfolio:
- Adding to 2 Holdings After Earnings, PMI Updates
- Tracking 49 Signals Across 11 Portfolio Investment Themes
- Weekly Roundup: Renewed AI Concerns Weigh on the Market and Portfolio
