Quoth the Raven: ‘When Wall Street Says Sell, Check Who’s Waiting To Buy’
Position: None
Position: None
The S&P Short Range Oscillator is at 0.05% vs. 0.50% — that’s in neutral territory.
Position: None
Here are yesterday’s things:
* I covered $NVDA at $206.60 and re-shorted at $218.50.
* I added to my $CRVW short at $90.79.
* I added to two ETF shorts — $GRNY at $27.88 and $JOET at $46.19.
* I added to my $JPM short at $356.80.
* I shorted $SPY at $769.29 and covered at $768.53.
* I shorted $QQQ at $716.73 and covered at $715.02.
Position: Short NVDA (VS), CRVW (VS), GRNY (M), JOET (S)
That was a long, tough day. All of that macroeconomic data did nothing to spark the marketplace. We had to wait until the closing bell to see some of the type of action we, as traders, crave.
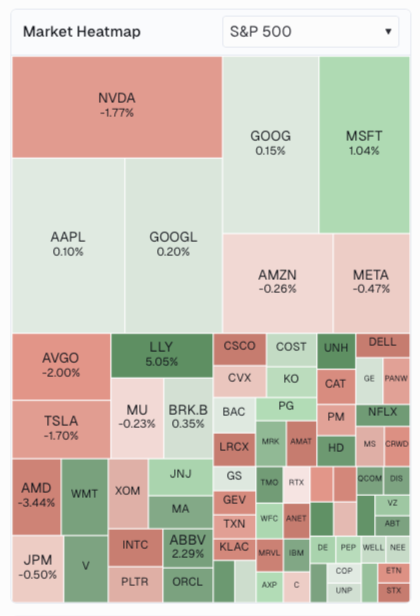
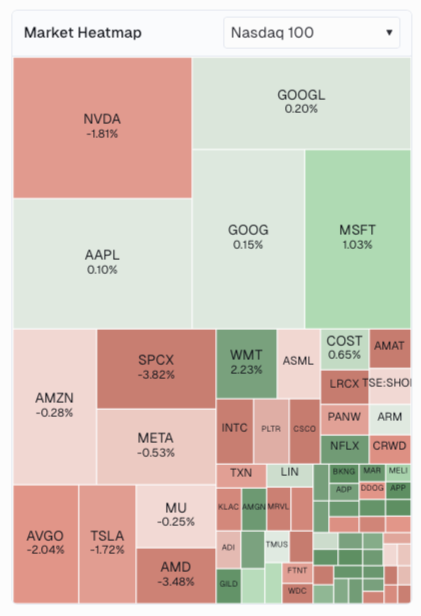
Equities closed slightly lower on Wednesday as traders awaited Nvidia’s ($NVDA) results, among others. The S&P 500 ended almost flat at -0.02%, while the Nasdaq Composite gave back -0.08%. Can’t make that stuff up.
Five of the 11 S&P sector SPDR ETFs wound up in the green, led by industrials ($XLI). Health Care ($XLV) was the weakest performer among these funds.
Treasury yields climbed. The U.S. 2-Year Treasury yield moved up 3 basis points to 4.21%, while the U.S. 10-Year Note paid 4.65% (+3 bps) by day’s end. The yield on the U.S. 30-Year Treasury yield ticked up 1 basis point to 5.17%.
As I send this note, we are still waiting on Nvidia. CrowdStrike ($CRWD), Okta ($OKTA) and Salesforce ($CRM) have all already reported. The market has react favorably to all three.
Position: Long NVDA, CRWD equity


Position: Long NVDA, CRWD equity.
Question: Since integration (1947), excluding the 2020 and 1981 seasons as there were not enough games played, only two MLB franchises completed an entire full-length season with a team batting average of .220 or less and less than 65 home runs hit in aggregate.
Name them.
Answers:
The 1963 Houston Colt .45s hit .220 with 62 HR while going 66-96 (9th in the NL).
The 1972 Texas Rangers hit .217 with 56 HR while going 54-100 (6th in the AL West).
Position: None
Since integration (1947), excluding the 2020 and 1981 seasons as there were not enough games played, only two MLB franchises completed an entire full-length season with a team batting average of .220 or less and less than 65 home runs hit in aggregate.
Name them.
Position: None
See that run from January into late spring? Dell ($DELL), a firm that has been a real beneficiary of the AI trade, is currently up 307% year to date. Readers will see the gap higher this past May in response to first-quarter earnings. This makes up a significant portion of that parabolic spike that ended up looking like a flagpole. DELL stock, for the most part, has held and consolidated those gains, developing, as it traded sideways, a Bull Flag pattern of trend continuance.

The upside pivot had been the top of the flagpole at $469. This does not change because there has been one failed attempt at breaking out from that pattern. The important thing for the bulls, in my opinion, is that the 50-day SMA has held as support. This implies that professional managers are buying stock at that level.
Moving on to my favored indicators, Relative Strength is barely better than neutral. It’s not really not telling us anything directional. However, below the chart, the daily MACD is sort of sending us a bit of a warning. The histogram of the 9-day EMA has been in negative territory since mid-August, which is a short-term bearish signal. On top of that, the 12-day EMA is running below the 26-day EMA. That is also bearish looking. With both of those lines still standing above the zero-bound, the signal is less profound, but I would proceed with a bit of caution.
Position: None
In the Microsoft ($MSFT) chart below readers will see a huge Double Bottom pattern of bullish reversal with a $466 pivot. The shares broke out of that pattern, then faltered. It is at that point that these shares found support just above my pivot. I find that encouraging.

The MACD could be in better shape, but Relative Strength is fine. In addition, the stock looks likely to experience a “golden cross” at some time in the next week to week and a half. That could provide some bullish algorithmic activity when that does occur.
I have no problem reiterating my $582 price target for this name.
Position: Long MSFT equity