11 a.m. with Market Call (with Carter, Liz, Guy and Dan) – where transparency and honesty are the foundation of the podcast and the watchwords of their investing/trading faith.
For nearly three years the markets and its participants have ignored elevated valuations.
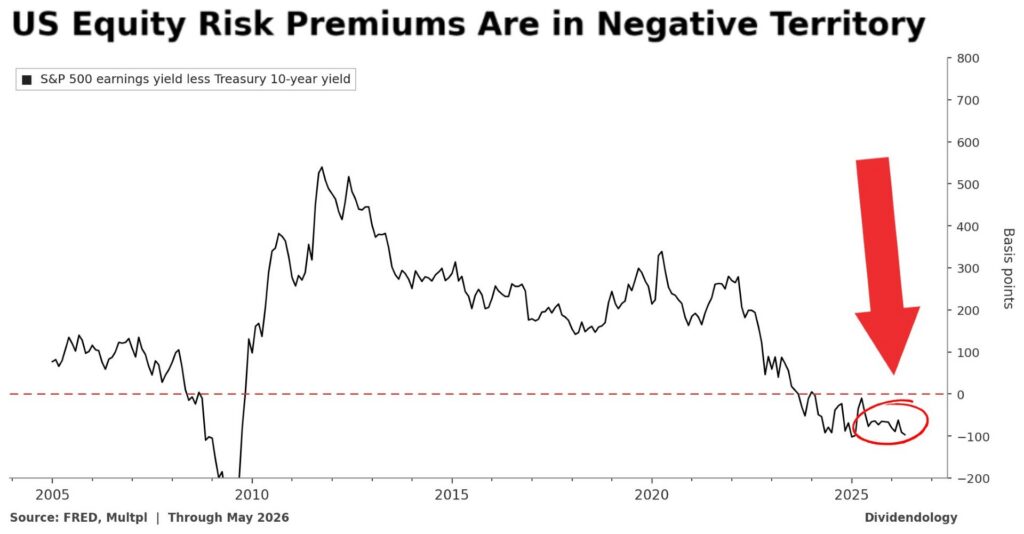
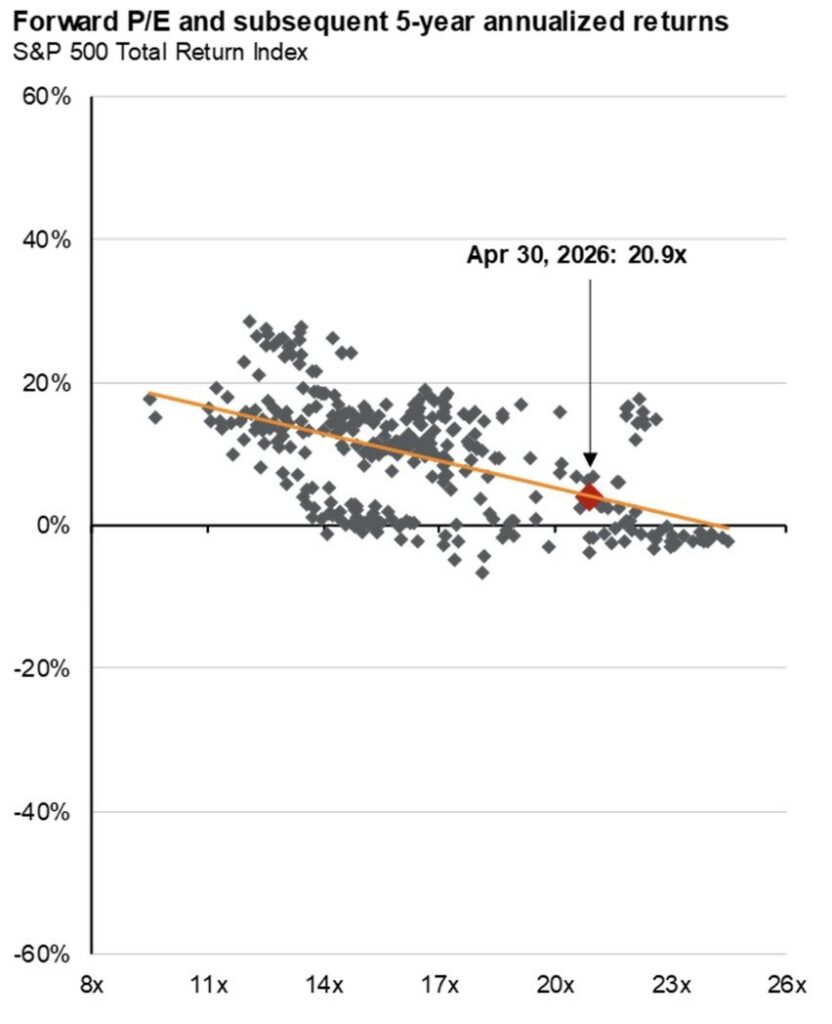
How much longer can the S&P 500 and the other major indices deliver upside when price-earnings multiples and equity risk premiums are in the 95th percentile or higher?
With consensus (I think overly optimistic!) 2026 S&P EPS at $330/share, the senior average trades at 23x and the equity risk premium is negative.
On projected 2027 S&P EPS consensus of $375/share (I think overly optimistic as well) the S&P trades at 20.5x and the equity risk premium is only at 50 basis points, both in the 93rd percentile.
The steady decline in the equity risk premium is a metric I pay very close because. Historically, it has been an excellent indicator future investment returns…
My focus on the ERP has contributed importantly to my wrong-footed market view and a missed opportunity set on the long side.
The Equity Risk Premium
Let’s examine the equity risk premium, which is the difference between the S&P earnings yield (the inverse of the P/E ratio) and the risk free rate (the 10-year Treasury note yield is typically used):
The equity risk premium tells us how much excess return investors are being paid to own stocks over a risk free Treasury bond.
Historically, equities typically offer a three-to-four percent premium over Treasuries. Such a premium makes sense because it compensates investors for volatility, drawdowns and uncertainty.
Right now, according to the chart above, the investor is being paid negative in equities vis a vis bonds. The ratio is saying that holding bonds is more risky than owning stocks — this is a radical notion, at an extreme! Again, this means:
1. Investors are not being paid extra to take on risk in stocks.
2. Stocks are offering similar or worse “yield” than bonds.
3. Valuations are materially stretched relative to interest rates.
Stated simply, this means that holders of equities are taking more risk for less reward (than bonds). When this has happened in the past (most notably during the dot-com bubble and leading up to The Great Recession in 2007-09), forward returns have been somewhere between non-existent and negative:
Bottom Line
It is hard to understand why stocks have been impervious to elevated valuations (a record high in overvaluation in both the Buffett Indicator and a near record in Shiller’s CAPE ratio), as well as an equity risk discount.
One answer is the dominance of passive products and strategies that worship at the altar of price. They know everything about price and nothing about value.
Other explanations are the euphoria in AI and the fear of missing out (FOMO).
Nonetheless, excessive valuations, excesses and the idea of a “new era” are nothing new — we have seen these at the top of other cycles (for reasons of overenthusiasm/heated speculation).
Finally, it is our strong view that the components of the equity risk premium suggest even more of a discount as 2027 EPS estimates come down and interest rates likely rise.
Let’s not forget when Berkshire Hathaway’s ($BRK.A) ($BRK.B) shares were suffering in late 1999 and many were questioning Warren Buffett’s investing philosophy (as they are currently with his near $400 billion cash hoard) — right before a more than -80% drawdown in the Nasdaq.
To me, it’s not different this time.
I continue to choose the weighing machine over the voting machine.
BREAKING: A federal judge has dismissed a lawsuit from anti-marijuana groups and a cannabis-focused biopharmaceutical corporation that sought to block a Centers for Medicare & Medicaid Services plan to cover hemp products for eligible patients.https://t.co/FdGUCMcPBH
Are we there yet?/Commodity bull market/Rising renminbi use/Who is your customer?
While markets have been rallying since early April in anticipation of a deal to end the conflict and fully reopen the Strait, this time feels much closer to it actually happening but the fate of the Iranian uranium stockpile still seems to be the major sticking point.
On the assumption that this time is for real, a deal is had and ships are allowed again to traverse the Strait without threat and hopefully without payment, commodity prices will have their pullback, as they did yesterday and today, particularly with crude oil. But, I reiterate my belief that we’re in a full fledged commodity bull market that will be marked in the next few years by global stock piling and hoarding of all key materials at the same time supply just won’t be able to keep up with. We remain long physical precious metals and mining stocks, oil and gas stocks and picks and shovels within the industry, along with fertilizer and uranium stocks.
As just one example of the strategic reserves that are going to be created/added to in the years to come, I read this article in the FT last week, “EU explores fertilizer stockpiling as food crisis looms.” Source: https://www.ft.com
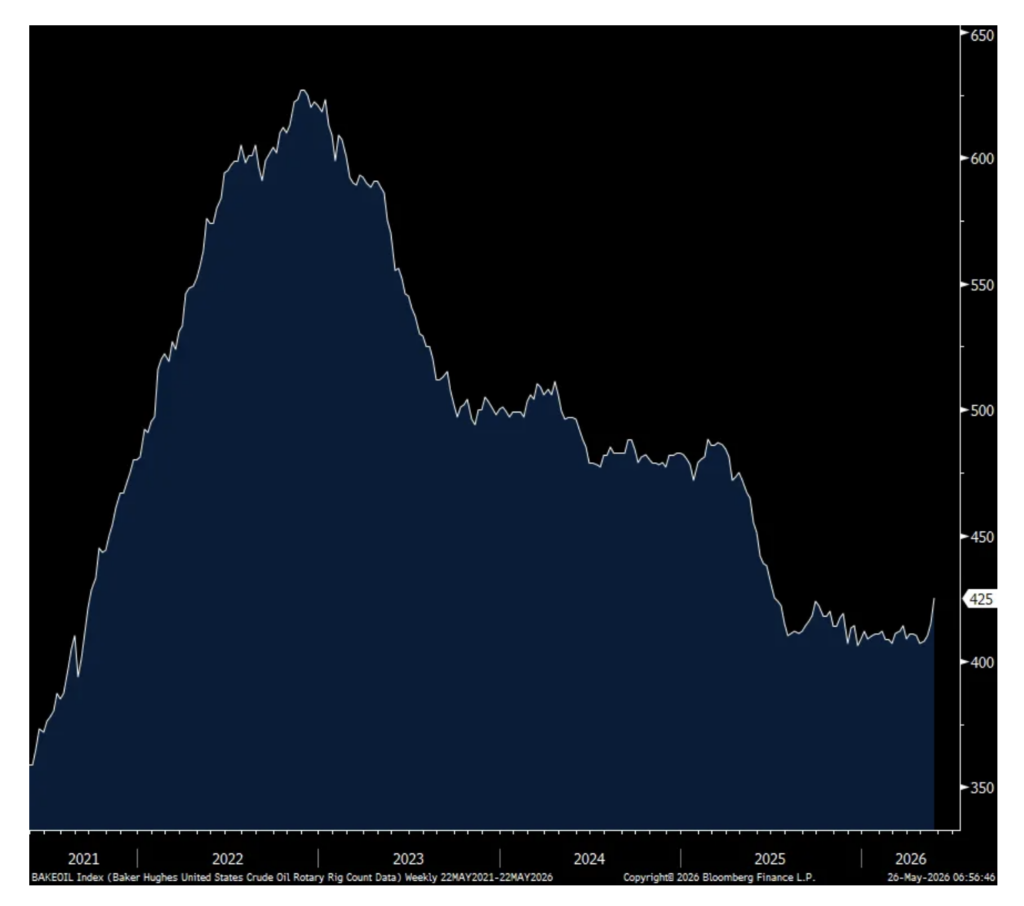
We’ll see if this continues if oil prices fall further but the US crude oil rig count is finally moving up. After rising by 5 rigs in the week ended 5/15, they increased by another 10 as of Friday to 425. It was at 407 on the last Friday of February. This is now the most since last July but as seen in the chart, its still 200 rigs below the late November 2022 count.
Crude Oil US Rig Count
This was a very interesting piece when looking at the US dollar and the efforts of the Chinese, among others, to further diversify its use of it for transactions, particularly for oil and other commodities. In an article titled “Iran war opens ‘golden window’ for China’s renminbi,” it said “China’s drive to widen global use of the renminbi has been boosted by the Iran war, with adoption of Beijing’s cross border payment system surging since the conflict erupted. The average daily value of transactions settled through China’s cross-border interbank payment system (CIPS) hit a record of Rmb920.5bn ($137.5bn) in March, according to state media. It briefly rose even higher at the start of April to as much as Rmb1.22tn with almost 42,000 transactions in a single day before transaction volumes fell back.”
Some details, “After the US lifted some sanctions on Russian and Iranian oil to ease the global energy crunch, buyers such as India were left with few options but to use renminbi to pay for deliveries given the inability of Russia and Iran to receive dollar payments.” Saudi Arabia too is increasingly receiving renminbi for its oil too.
This all said, we are not yet in a ‘petroyuan’ situation as we are still talking about a single digit market share for the renminbi when pricing oil with the US dollar at about 80% but there is definitely a shift going on which also has ramifications for gold which is becoming an increasingly used settlement currency with these transactions as any extra currency is used to purchase it on the Shanghai Gold Exchange to transform renminbi into a neutral asset.
On to some retail calls and talk about bifurcation in these comments amongst the varying consumer base.
From Ross Stores, the value retailer, and whose stock ripped higher by 8% Friday on a big comp gain:
Comps jumped by 17% and “While we attribute a portion of this growth to the increase in tax refunds versus last year, we are quite pleased that the underlying fundamentals of our growth were extremely healthy.”
“The comp increase was primarily driven by a growth in transactions, and we saw healthy increases in customer count on a comp store basis across income levels, ethnicities, and all age groups, including the young customer.”
“While ladies and cosmetics were our strongest businesses, every major merchandise category posted comp growth in the teens or higher.”
From BJ Wholesale and whose stock in contrast fell by 8% Friday as they said some things similar to Walmart, particularly with fuel:
“General merchandise and services delivered mid single digit comparable growth, led by strength in consumer electronics.” They referred to the ‘discretionary’ category though as “uneven.”
“Gas prices increased dramatically during the quarter, putting additional pressure on member wallets…To put this in further context, in April alone, our members spent $143 million more at our pumps than they did a year ago. That’s equivalent to approximately 3.5% in merchandise comp dollars. As consumers adjusted to the higher prices, we did see some modest shifts in behavior with average gallons per fill up slightly lower, reflecting the pressure higher prices put on household budgets as well as more members topping off their tanks more frequently.” I bolded to highlight the similar wording Walmart gave last week.
“While the consumer in the broadest sense has been resilient in the face of continuing challenges, we continue to see a more pressured environment for the lower income households. Elevated costs are weighing more heavily on that segment and we’re seeing more value seeking behavior as a result.”
“This quarter, the vast majority of our comparable sales growth was driven by our higher income members, who remained engaged and continue to shop with us consistently.”
Speaking of that upper income consumer, Richemont had a good quarter, with brands like Cartier, Buccellati, Van Cleef & Arpels in their Jewelry Maisons business and Piaget, IWC and Vacheron Constantin, among others in their watch business. They also have a whole separate fashion business.
“Jewelry Maisons posted a remarkable performance, illustrating the strength of their brand equity and overall value proposition. Sales rose by 14%, with double digit growth throughout the year, led by higher demand across all regions.”
“During the year, the Jewelry Maisons implemented measured price increases while continuing to preserve value for clients.”
“In addition, the Specialist Watchmakers and Fashion & Accessories Maisons posted modest growth, both improving in the second half. All regions contributed to growth, with a notable double digit rise in the Americas throughout the entire year.”
Sales in the Middle East were doing just fine until March and ended the quarter down 3% y/o/y.