A Big Waste of Time

These year-end forecasts have little value.
They all typically start with a standard +8% (or so) yearly forecasted return:
They are not worth the paper they are written on, imho.
Position: None
These year-end forecasts have little value.
They all typically start with a standard +8% (or so) yearly forecasted return:
They are not worth the paper they are written on, imho.
Position: None
Position: None
* Especially after the large increase (since 2020) of cumulative or “stacked inflation”…
Position: None
As I noted late yesterday, the S&P Short Range Oscillator, which was -5 to -6 about 10 days ago (a deep oversold) is now close to neutral at -0.66% (vs. -1.96% a day earlier).
Position: None
Just what I thought. The S&P Short Range Oscillator slipped to -0.66% — that’s virtually neutral after being -6% a week or so ago.
Position: None
Position: None
Closing Volume
– NYSE volume 24% below its one-month average
– NASDAQ volume 24% below its one-month average
– VIX index: up 2.49% to 15.21
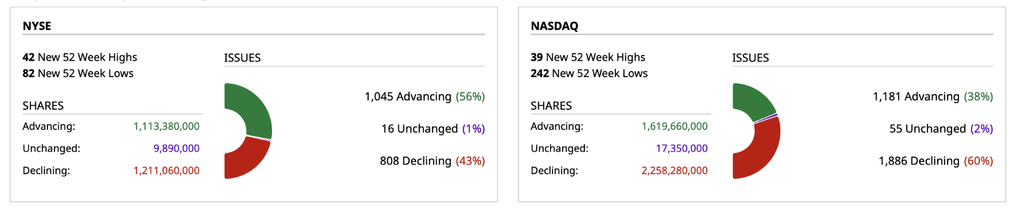
Breadth
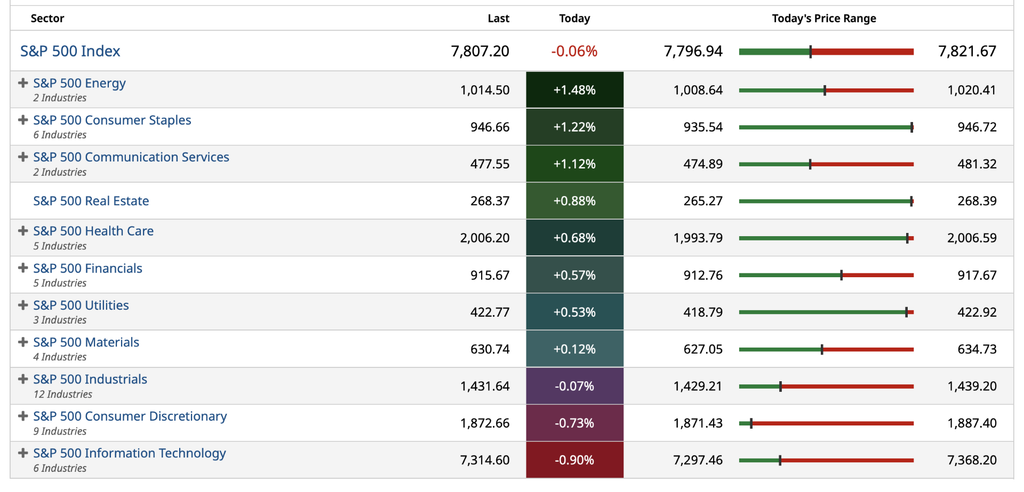
S&P 500 Sectors
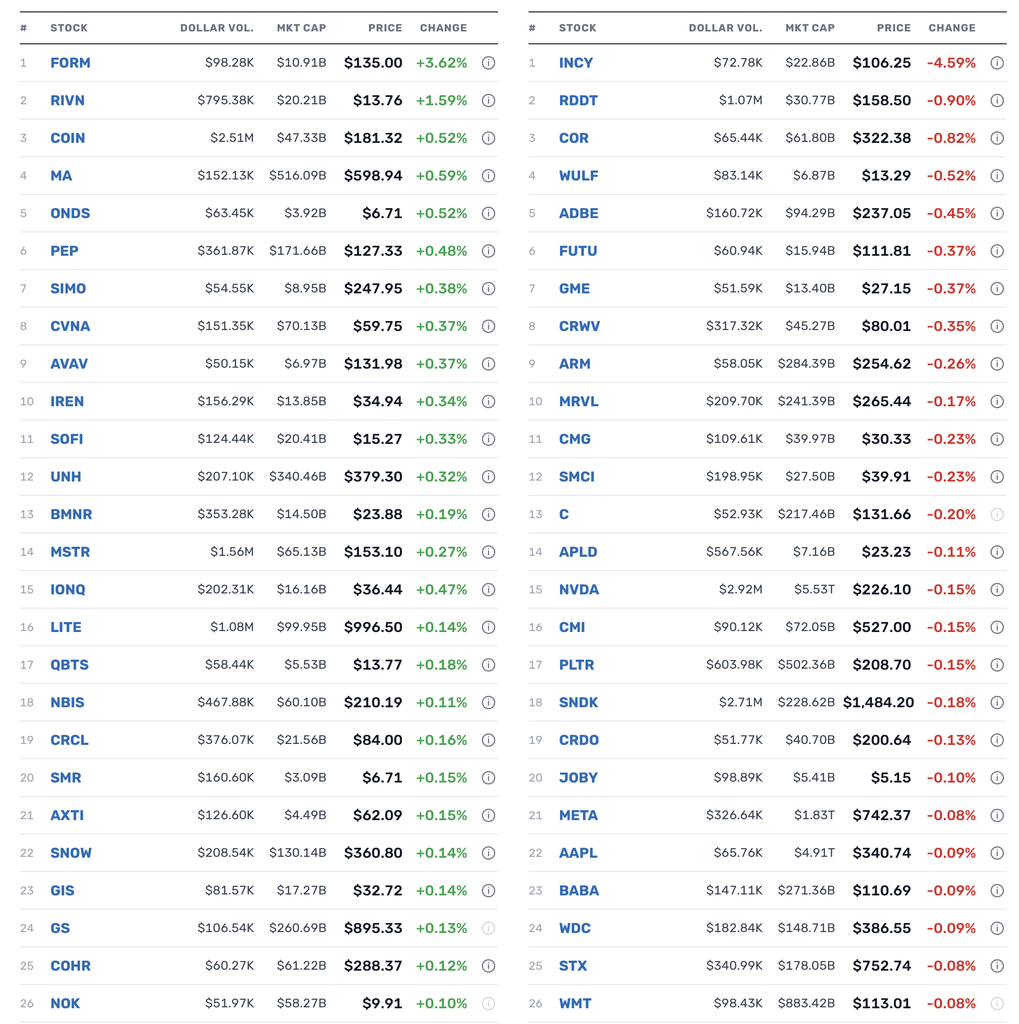
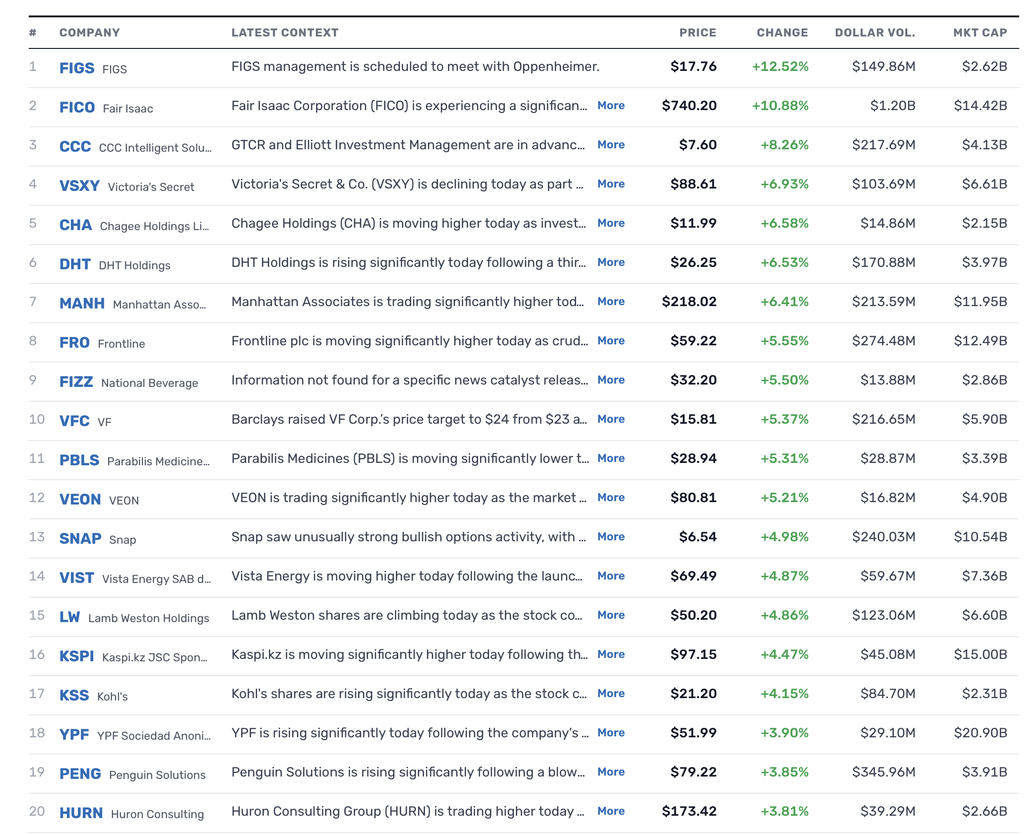
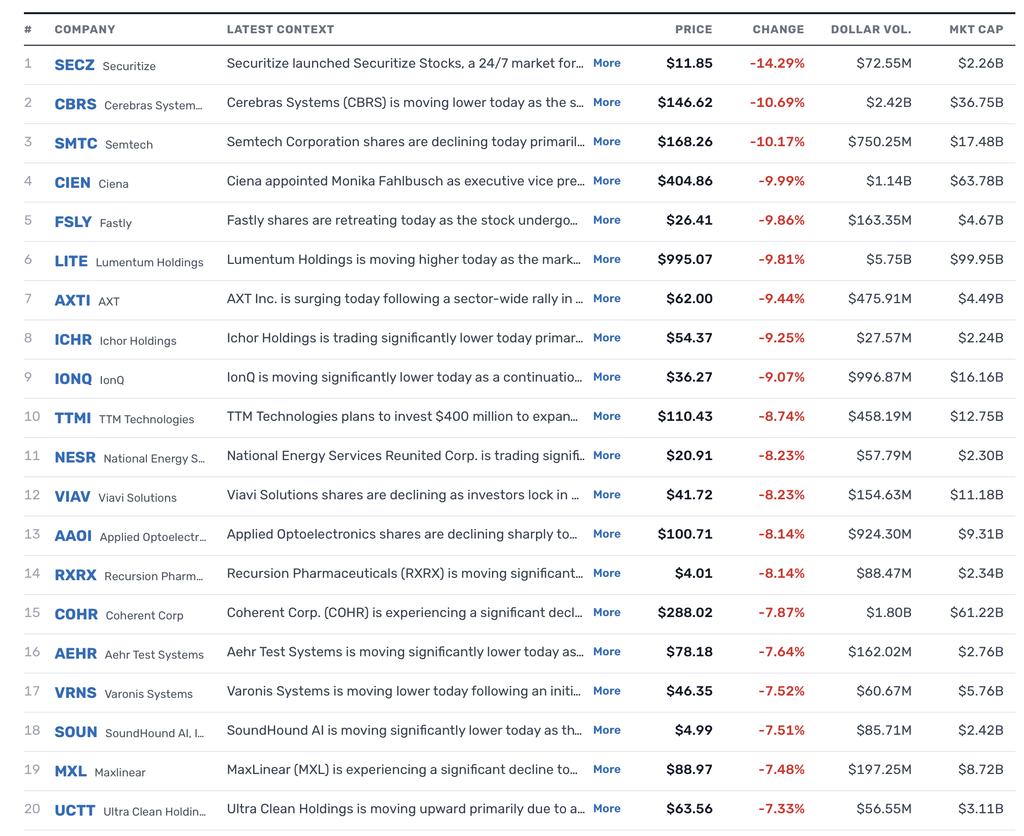
% Movers
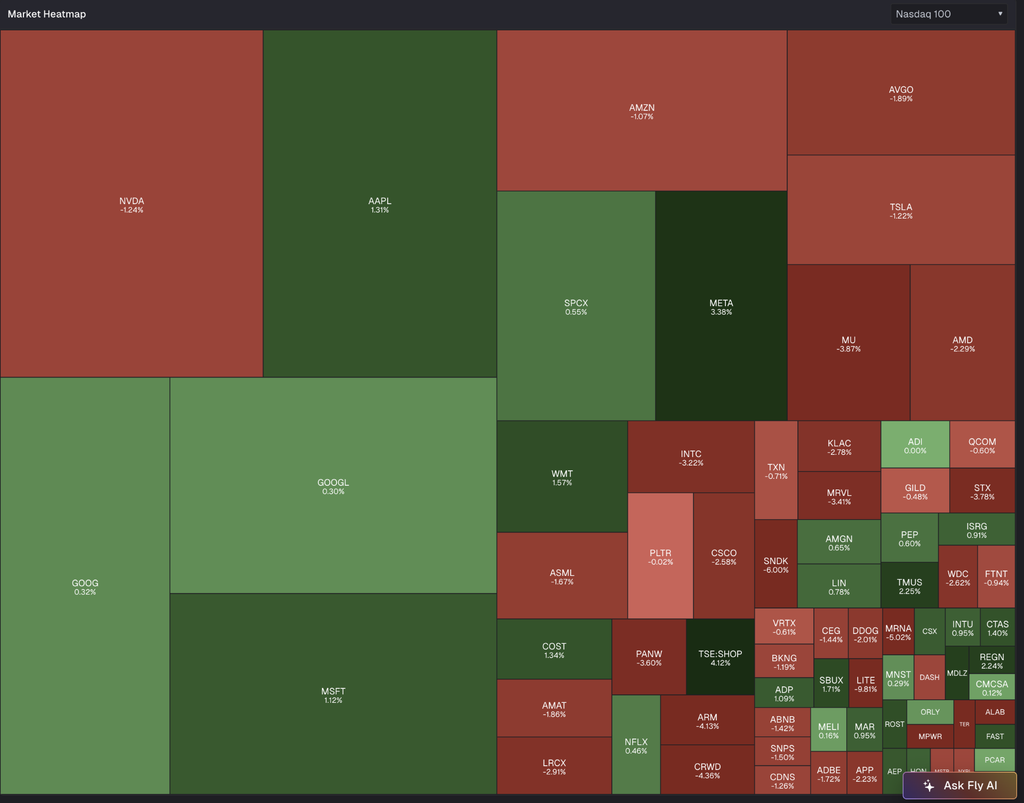
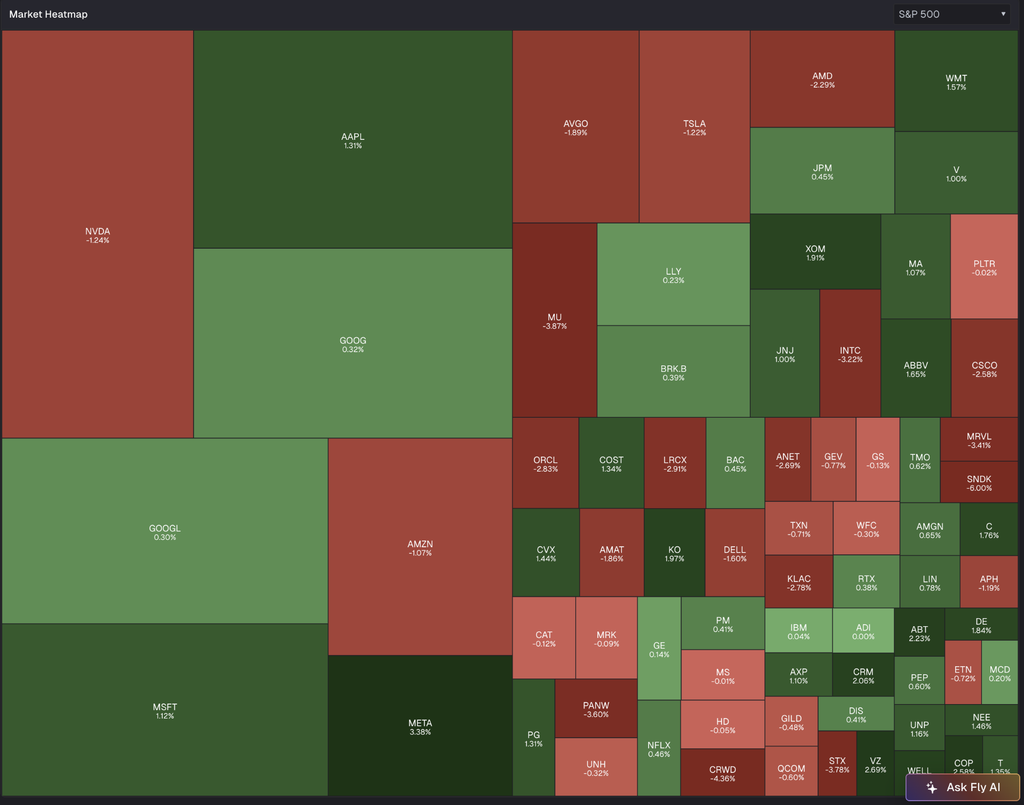
Heat Maps
Position: None
Wolf Street howls about what Intel ($INTC) and Broadcom ($AVGO) say about AI ROIC.
The CEO’s of Broadcom and Intel Say the Quiet Part out Loud about AI and ROI | Wolf Street
Position: None
A subscriber sent me this and I will try to answer it tomorrow morning:
Dougie,
Lots of talk about the extraordinary rate of EPS growth in the S&P 500 again.
Here is data I would love to see. Use last quarter reported EPS, since it is already in the books:
-Remove ALL 1x EPS benefits from the markups of holdings in Anthropic (and Open AI or anything else of that ilk). This is very reasonable to do. This does not get a multiple. At best, it should be valued at book value, and frankly a 20% discount to book value, which is the typical tax on illiquid investments not under the control of the stockholder.
-Then back out the EPS growth from just two companies, MU and NVDA. Just 2. What was S&P EPS growth net of backing those two companies out (cap weighted earnings growth the same way EPS growth is being reported), and how does it compare with the aggregate number for EPS growth that people were using?
-Then do the same thing, and back out the next 5 largest contributors as well. Tell me how S&P earnings growth looked without the benefit of the Anthropic stock markups being put into earnings, and what it was for the remaining 493 companies, and how that compares to the aggregate growth that was reported?
Would love to see how these things look side by side….
Stay tuned!
Position: None