Coming Soon

I will have a new market update on Wednesday morning.
Working on it now.
Position: None
I will have a new market update on Wednesday morning.
Working on it now.
Position: None
Position: None
Position: None
Position: None
I am adding to my index shorts:
* $SPY $758.63
* $QQQ $741.18
Position: Short SPY (L), QQQ (L)
– NYSE volume7% above its one-month average;
– NASDAQ volume 16% above its one-month average;
– VIX index: down 2.48% to 15.35
Volume
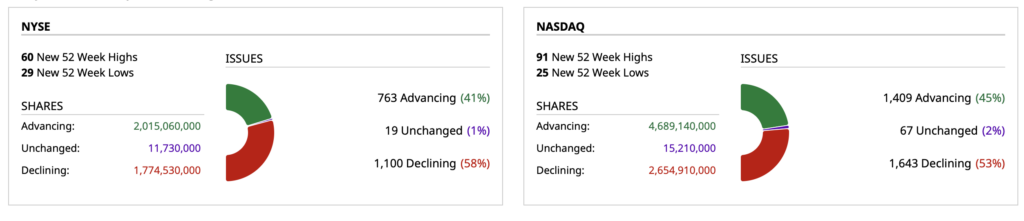
Breadth
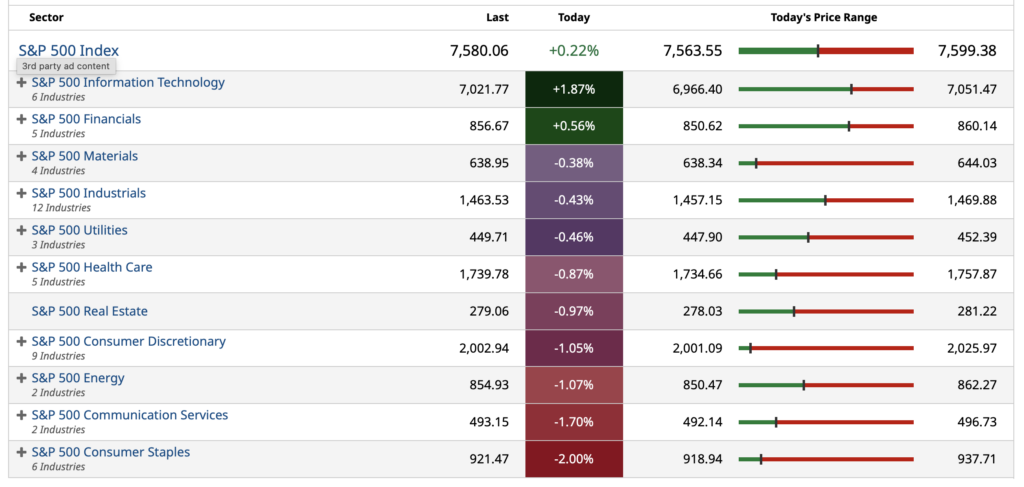
S&P 500 Sectors
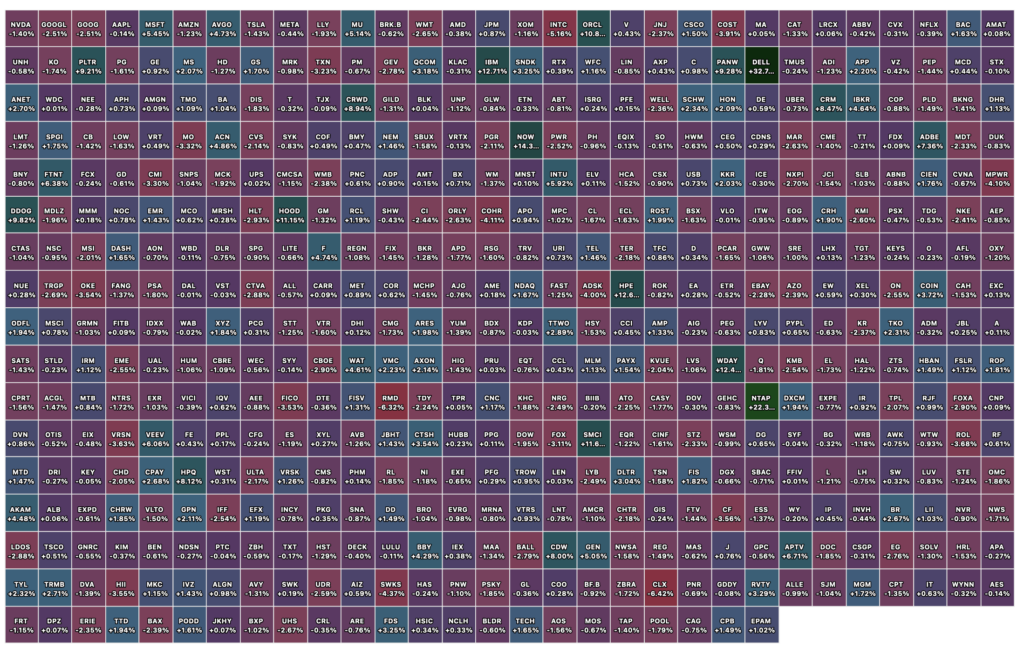
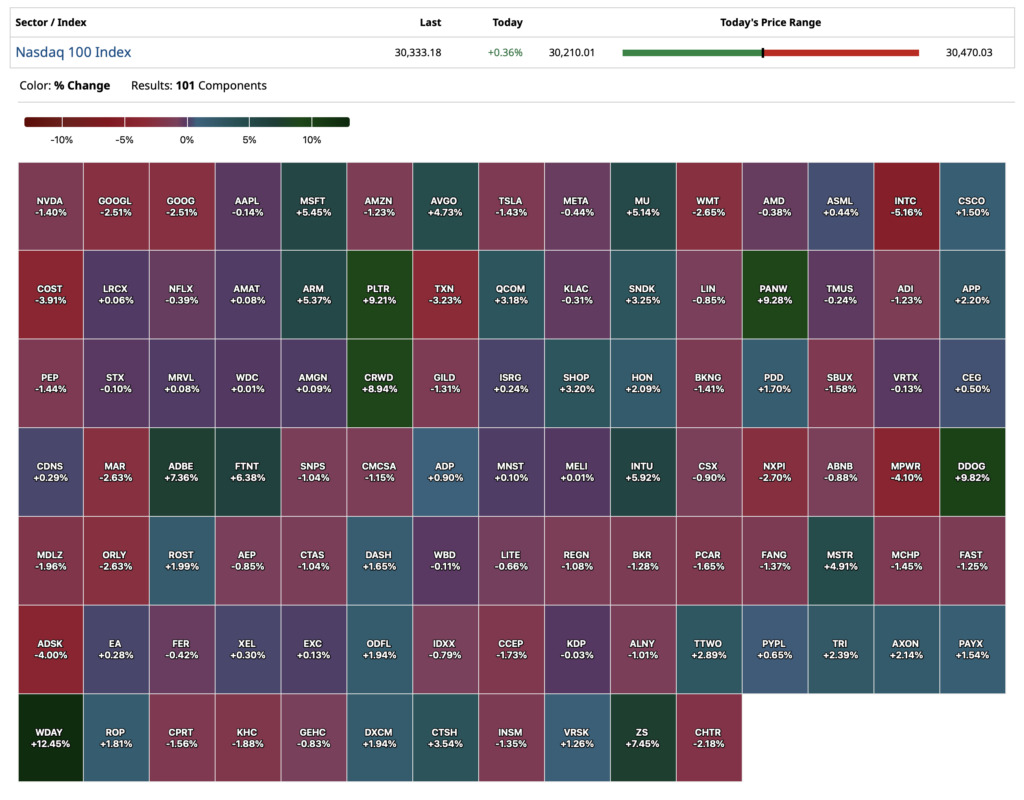
Nasdaq 100 Heat Map
From Peter Boockvar:
Positives,
1) The May Chicago manufacturing PMI jumped to 62.7 from 49.2. I believe though still front loading of shipments as “New orders jumped 18.2 pts to the highest level since January 2022.” This was interesting, “Although there was a notable rise in the proportion of respondents reporting more new orders relative to April, the panel noted that in some cases this only represented a slight increase.” Also, “Prices paid increased 3.5 pts to the highest since May 2022. Respondents continue to highlight oil prices and transport fuel surcharges pushing up costs.”
2) Maybe helped by the defense sector, the Richmond manufacturing regional index rose to 13 from 3.
3) The Apartment List May rental data saw new rents (as opposed to renewals) rise .5% m/o/m, up for a 4th straight month “as the market enters the busy summer moving season” but still down 1.5% y/o/y. Also of note, the vacancy rate is now ticking back down for the first time in “over four years”, to 7.2% after peaking at 7.3% in February which was the highest since at least 2017.
4) Home price growth in March (so somewhat dated and doesn’t reflect recent inflection up again in mortgage rates) rose .67% y/o/y, vs .75% in February. That’s the slowest pace since June 2023 and I think the moderation in price increases is a good thing. Not everyone agrees though, S&P Global said “More than half of the 20 major US housing markets recorded y/o/y price declines in March, reflecting a broadening and deepening housing slowdown.”
5) The April goods deficit was $82.4b, about $3.5b below the estimate with a 4% m/o/m lift to exports, most likely helped by shipments of petro products.
6) From Hormel: “Our top line results remained a clear area of strength as we achieved our 6th consecutive quarter of organic net sales growth…our protein centric portfolio positions us well to meet consumer and operator needs, and we continue to see that advantage translate into marketplace performance during the second quarter…While consumers are under pressure and sentiment is low, food has remained resilient in recent months, particularly with growth in protein, where our portfolio is well positioned. Consumers and operators are prioritizing products that deliver clear value.”
7) From Dollar Tree: “Customers are shopping thoughtfully and closer to need with a continued focus on affordability, convenience and trip efficiency. Customers value the ability to shop nearby and quickly to stretch their budgets through smaller and more affordable pack sizes and to still find a compelling assortment and discovery throughout the store…On the macro, sure, customers are under pressure from higher fuel prices, but that also makes them more value focused…In Q1, customers saw higher gas prices for sure, but they also saw higher tax returns.”
8) From Burlington Stores: Comps grew 6% and “our comp trends were broad based across businesses and geographies, with particular strength in ladies’ apparel, beauty and accessories. One particular callout was the strength of our warm weather categories.” They expect full year comps of 2-4% and remain positive on their business. “And when we look at our underlying customer data, the key indicators continue to look positive across demographics and income bands. By the way, we estimate that higher tax refunds in Q1 were worth about 1.5 to 2 points of comp. Even if you strip those out, our comp growth in Q1 was still mid single digit.”
9) From Best Buy: Comps were up 2%, “higher than our outlook, with positive comps across the majority of our major product categories…our sales growth increased as we progressed through the quarter, in part due to new product introductions and customers choosing to spend their higher tax refunds with us.” On the consumer, “we see a customer who is still spending, but is value focused and attracted to sales moments. Importantly, while customers continue to be thoughtful about big ticket purchases, they are willing to spend on high price point products when they need to or when there is technology innovation.”
10) From Costco: “In terms of merchandising highlights…gas prices had a major impact on the quarter, with our members allocating a greater proportion of their total spend to gas. At the same time, we saw very robust comp sales results excluding gas, as our combination of merchandising quality, value, and newness continued to resonate with members…Non-foods comp sales were up high single digits in Q3. Top performing departments were gold and jewelry, small electrics, tires, home furnishings, majors (bigger ticket items) , and health & beauty.”
11) From DICK’s Sporting Goods: Comps rose 6% “with growth in average ticket and transactions…We saw more athletes purchase from us with more frequent purchases, and they spent more each trip compared to the prior year. We continue to see a healthy consumer across income demographics, with no signs of trading down alongside particularly strong engagement from our younger athletes. Our consumer is really responding to newness and innovation, which is showing up throughout the DICK’s business with broad based growth across footwear, apparel, and hardlines.”
12) From Abercrombie & Fitch: “We’re seeing good progress against our company priorities so far in 2026, led by net sales growth across brands in the Americas and other key markets like the UK.”
13) From Ross Stores: Comps jumped by 17% and “While we attribute a portion of this growth to the increase in tax refunds versus last year, we are quite pleased that the underlying fundamentals of our growth were extremely healthy…The comp increase was primarily driven by a growth in transactions, and we saw healthy increases in customer count on a comp store basis across income levels, ethnicities, and all age groups, including the young customer.”
14) From Amex: “we’ve been pretty steady from a delinquency perspective. Same thing from a write-off perspective…The other thing I think that was concerning to some people in the first quarter was airline spending and what we were seeing there. And I could tell you, in April we had 9% airline growth. So people are on planes, they’re flying. We had record travel bookings in the first quarter. And so, we’re seeing a healthy consumer. We’re seeing a resilient consumer. And that’s been really consistent.”
15) From Richemont: “Jewelry Maisons posted a remarkable performance, illustrating the strength of their brand equity and overall value proposition. Sales rose by 14%, with double digit growth throughout the year, led by higher demand across all regions…In addition, the Specialist Watchmakers and Fashion & Accessories Maisons posted modest growth, both improving in the second half. All regions contributed to growth, with a notable double digit rise in the Americas throughout the entire year.”
16) From Dell: “Demand was stronger than we anticipated across all lines of businesses and geographies, with customers moving decisively to secure supply across a broad range of IT needs…Our Q1 results and AI, the opportunity remains exceptionally strong, underscored by durable, broad based demand…Demand continues to exceed supply with memory as the primary constraint, and we expect to exit the year with meaningful backlog.”
17) From HP: “In personal systems, revenue grew 13% y/o/y, with strong growth in both commercial and consumer. This includes continued momentum in AI PCs, which increased from more than 35% to 44% of our shipment mix in the quarter, as well as continued strength in advanced compute solutions and workforce solutions…In print, revenue was flat y/o/y in a competitive market, as expected.”
18) From Salesforce: Agentforce is their pushback against irrelevance in terms of their software business but it’s still modest in size. “I think we’re going to talk about how we processed 28.6 trillion tokens, up 152% q/o/q, no greater example of the tremendous adoption of these new agentic products by our customers and how we’ve converted those into 3.8 billion Agentic Work Units…Agentic AI, well, it’s the biggest growth opportunity for our customers, for us at Salesforce.”
19) Snowflake had quite a week.
20) From Marvel Technologies: “We are seeing strong demand and exceptional bookings across our entire data center portfolio.”
21) The May Tokyo CPI rose 1.4% y/o/y headline and 1.6% ex food and energy, both 2 tenths below expectations and again, subsidies are helping to tame the figures. Subsidies to cushion the blow of higher fuel, food and water prices and also for childcare.
22) Taiwan’s economy, thanks to its chip production, grew by 14.5% y/o/y in Q1, just above the forecast of up 13.7%.
23) In May, German unemployment unexpectedly fell by 12k people rather than rising by 10k as estimated. Their unemployment rate did fall by one tenth to 6.3%. While good to see, the Federal Employment Agency chief said “Despite a decline in unemployment, the spring upturn has not really got going this year.”
24) The May Eurozone Economic Confidence index which rose a touch to 93.5 from 93.2 which was the lowest since 2020. This was at 97.9 in February right before the Strait was closed. The internals were mixed m/o/m with a rise in services and consumer confidence, while manufacturing, retail and construction declined.
Negatives,
1) Headline PCE in April rose .4% headline and .2% core m/o/m, both one tenth below the estimate but due to rounding the 3.8% and 3.3% y/o/y gains were as forecasted and up from 3.5% and 3.2% respectively in the month before. As to be expected, energy prices rose 18.3% y/o/y and food prices were up 2.5%.
2) The savings rate fell to just 2.6% from 3.2% in March, 3.6% in February and 4.3% in January. That matches the lowest level since June 2022 when it got down to 2.2% that month. Go back to 2007 the previous time it was under 2.6%. Lower farm income due to the end of an assistance program weighed on income growth which was flat m/o/m. A falling savings rate also a result of higher stock prices but no question reflecting some consumer stress for those that don’t own stocks.
3) Spending rose .5% in April and .4% of that spending was inflation.
4) Q1 GDP was revised lower to a gain of 1.6% from the first print of 2% and vs expectations of no change. Tweaks down in personal consumption and gross private investment were the main reasons. Final sales to private domestic purchases was revised just a hair lower to 2.4% growth from 2.5% initially. For perspective, 150 bps of the GDP growth was from spending on ‘information processing’, ‘software’ and ‘R&D.’
5) Initial jobless claims ticked up by 5k w/o/w to 215k and that was 4k above the estimate. The 4 week average moved up to 209k from 203k as a print of 190k drops out from 5 weeks ago. Continuing claims rose to 1.786mm as expected from 1.771mm but remaining below 1.9mm.
6) Core durable goods orders in April fell 1.1% m/o/m vs the expected gain of .4%, partly offset by a 5 tenths upward revision to the blockbuster month seen in March when they rose 3.9%. Notwithstanding the orders pullback after the strong March, strength in anything touching the data center construction continues to be robust with an 18.8% y/o/y rise in computers/electronics, 5.8% increase in electrical equipment, 11.6% gain in machinery and you can’t build anything without metals as primary metals orders rose 13.6% y/o/y and fabricated metals were higher by 10%. Core shipments, which get plugged into GDP, were about as expected.
7) The further rise in the average 30 yr mortgage rate to 6.65%, up 20 bps over the past two weeks and to the highest since last August, had an immediate impact on refi’s which fell 18% w/o/w to the lowest since last August. Purchase applications though were little changed but after falling by 4.1% in the week before.
8) New home sales in April totaled 622k, 38k below expectations and March was revised down by 19k to 663k. Months’ supply is at 9.4.
9) The Conference Board consumer confidence index in May fell slightly to 93.1 from 93.8 and vs 92.2 in March and 91 in February. The internals were mixed as the Present Situation fell to a 3 month low but the Expectations component rose 1 pt m/o/m to a 5 month high. One year inflation expectations was at 6.2% for a 3rd month and that stays at a one year high. The Conference Board said what we’re well aware of in terms of the bottom line, “Consumer confidence edged downward in May as the inflationary impacts of the war in the Middle East intensified…Consumers’ write-in responses on factors affecting the economy continued to skew towards pessimism in May. References to prices and oil and gas increased in frequency for a second consecutive month, while mentions of war, geopolitics, and conflict remained elevated – likely signaling consumers’ underlying concerns about the inflationary impacts of the war in the Middle East on their wallets.”
10) The May Philly services index fell to -23.6 from -16.5.
11) The Dallas manufacturing index in May flat lined again at .4. Its services index was -7.7 vs -9.9 in April.
12) From Costco: “Our gas team performed exceptionally well to manage this unprecedented demand, which requires multiple daily gas deliveries to many locations. The high consumer price sensitivity, which fueled these record volumes, also drove many members to use our gas stations for the very first time in the third quarter.” On why the traffic picked up to their gasoline stations, outside of its cheaper price relative to competitors, “a lot members are increasing their frequency of visiting the gas station to top up in between what would have normally been a gap between getting the tank to empty because of the concern about what might the gas price be tomorrow.” Also, “Inflation increased slightly in non-foods, and we are anticipating further inflation in a number of non-food categories as higher resin costs start to flow into cost of goods.”
13) From BJ Wholesale: “Gas prices increased dramatically during the quarter, putting additional pressure on member wallets…To put this in further context, in April alone, our members spent $143 million more at our pumps than they did a year ago. That’s equivalent to approximately 3.5% in merchandise comp dollars. As consumers adjusted to the higher prices, we did see some modest shifts in behavior with average gallons per fill up slightly lower, reflecting the pressure higher prices put on household budgets as well as more members topping off their tanks more frequently.”
14) From The Gap: “Overall, at the company level, the quarter was in line with our expectations. However, results at the brand level were more varied, reflecting both the different stages of their transformation and some brand specific dynamics…From what we can see today, the consumer remains resilient. And while we continue to monitor their behavior, at this time our outlook does not assume any meaningful shift over the balance of the year. The promotional environment thus far has remained rational, yet we are keeping a close watch on the extent to which companies may reinvest this year’s tariff upside into pricing actions. Fuel costs are elevated and we continue to monitor geopolitical conditions and its potential implications across the broader operating environment.”
15) From Monro:: “We experienced a 5% decline in tire units during the quarter, which we believe aligns with broader industry trends. Our tire category was pressured as consumers continued to defer spending in higher ticket categories and gravitated toward lower cost alternatives. Further, fiscal February presented additional challenges when severe winter weather across our geographic footprint forced temporary store closures and significantly reduced customer traffic…And while our business rebounded in April, with comp stores sales that were up almost 1%, our May month-to-date comps are down approximately 3%. We believe the primary driver is that certain customers are feeling increased pocketbook pressure as a result of recent increases in gas prices, as well as other related costs.”
16) From Bath & Body Works: “Underlying business trends remain pressured and largely consistent with the past several quarters.”
17) From AutoZone: “With regards to inflation’s impact on DIY sales, we saw like-for-like same SKU inflation just north of plus 7% for the quarter, which contributed to our DIY average ticket being up plus 5.6%. The difference between the like-for-like inflation and ticket growth was attributable to product mix.” Traffic count for DIY was down 3.6%.” Commercial SKU inflation was up 7% too.
18) From PayPal: “From a vertical perspective, we have seen a slowdown in the travel space, especially in Europe. And also from a regional perspective, Europe is the region where we have seen a slowdown of overall activity. When we look at monthly evolution, May was stronger than April, but in line to the expectations that we were having.”
19) From Dell: “We’re repricing, it feels like, every day, and I’m sure our customers feel that pain. Unfortunately, I don’t see that changing, given the world that we’re living in today, where you have an inflationary environment, whether it’s fuel, whether it’s raw materials, whether that’s DRAM, whether that’s NAND, CPUs. We are living in an inflationary environment that is changing at a rate that obviously we’ve never seen before, and everything that we see suggests that continues. There’ll be a point where some customers, it’s enough, and they’ll wait it out, and we’re seeing that in some cases. In other cases, we’re seeing an acceleration, that notion that was called out earlier, where folks are trying to secure that supply now and over multiple years because it’s going to be more constrained.“
20) From HP: “Turning to the external environment, we continued to navigate a challenging supply and cost environment, while remaining focused on disciplined execution. In Q2, as anticipated, memory and storage costs increased sequentially. We expect this trend to continue in the second half of 2026, with costs increasing in fiscal Q3 and Q4…In addition, we also anticipate broader inflationary pressures beyond memory and storage, including oil prices and their downstream effects.”
21) France said its May CPI rose 2.8% y/o/y, up from 2.5% in April, though one tenth below the estimate. Spain’s CPI accelerated to 3.6% y/o/y from 3.5% as forecasted. Germany’s May CPI rose 2.7%, though one tenth below the estimate and down from 2.9% in April. Fuel subsidies helped to artificially keep a lid on it however.
22) Consumer confidence in France fell to the weakest since March 2023.
23) The Bank of Korea kept its 7 day repo rate unchanged at 2.5% as expected but signaled they are going to hike soon. The Governor said “I believe a convincing case could certainly have been made even for raising rates at this meeting.”
24) Australia’s April trimmed mean CPI rose .3% m/o/m and 3.4% y/o/y as expected but no upside surprise.
Position: None