Bob Lang on Breadth Divergence
From TheStreet Pro’s Bob Lang, talking about the massive breadth divergence…
There are different ways to analyze market breadth, but I have found 2-3 styles that tell me a great deal about how a trend is working and when there are differences with price. Let’s remember, the price action is the king of all indicators, no matter what other indicators might be telling you. Certainly we can throw up a yellow caution flag if there are divergences between, say price and breadth. Could this be a test? Maybe, but the market needs to prove that it is not significant.
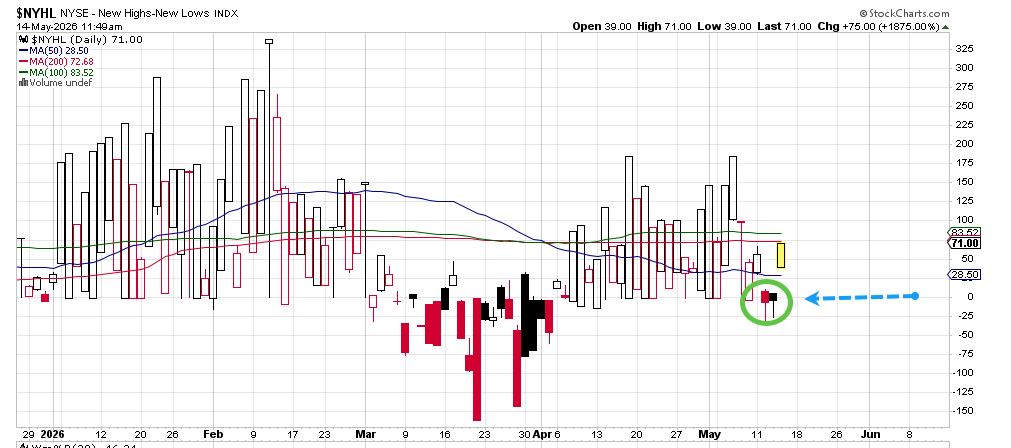
On that accord, we had a noticeable difference in new highs and new lows that is being talked about. On 5/12 and 5/13 you can see the new lows beat out new highs for the first time in weeks, a stark divergence. That explains the early weakness on Tuesday but not the strength on Wednesday. These divergences between new highs and lows are not common but when they do happen it throws a caution flag in the air. This is due to the lack of momentum in new highs, and the push by mega cap-weighted issues moving higher while smaller stocks are trailing. Overall market momentum is slowing down, even as the indices advance with new all-time highs.
The Hindenburg Omen requires this diverging characteristic among others. There is a long track record of weakness following the “Omen.” When it triggers there is an “ominous” moment of selling — usually — and markets move down helplessly. No indicator has a perfect record, though and we have had many Hindenburg Omens over the past several years that scared many investors/traders out of the markets but did not pan out. Divergences like this however are real and we should pay attention at all times.
Below is the criteria for a Hindenburg Omen to occur:
New Highs and Lows: The number of NYSE new 52-week highs and new 52-week lows must both exceed 2.2% (or 2.5%) of total NYSE issues.
Higher Highs/Lows Ratio: New highs cannot be more than twice the new lows.
Upward Trend: The NYSE index must be in an uptrend, defined as being above its 50-day (or 10-week) moving average.
Negative Sentiment: The McClellan Oscillator must be negative, indicating a decline in overall market momentum