Bad Breadth, But Oversold Enough for a Face Ripping Rally?

We are halfway through September, and the S&P has had exactly three green days. That’s it.
At the same time, we are halfway through September, and the SOX has had three red days. That’s it.
Yet they both sit at support. Is it possible the S&P is no longer being pushed around by the semis? I don’t know. I still think the semis tend to control the indexes, but this data says I might have to change my view on that.
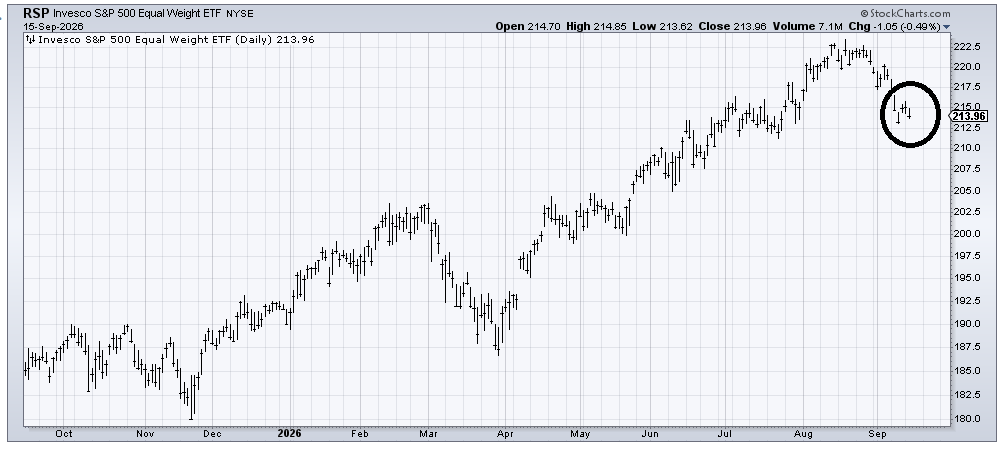
We’ve already discussed the fact that no one pushes the broadening out trade anymore, which I assume must be because the Russell 2000 is now down seven percent and the equal-weight S&P (RSP) is down around four percent, and under its 50-day moving average.
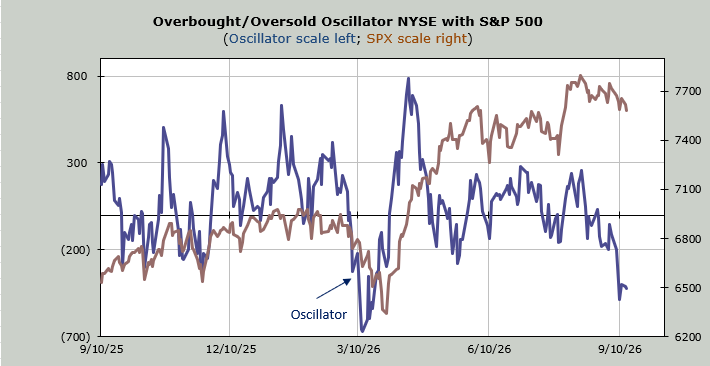
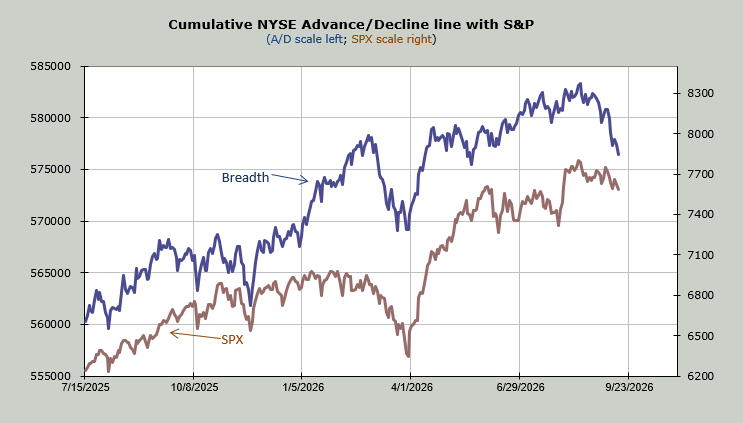
It could also be because breadth has been so poor. Breadth is now back to where it was in early May/June (blue line) while the S&P is still a few hundred points higher. That means there has been a great deal of selling under the hood.
But here’s something I noticed on Tuesday: the RSP did not make a lower low (vs last Thursday). I am going to have my eye on that as we head into the Fed meeting on Wednesday. I think it is too soon to fuss over it, but it has certainly caught my eye, especially now that no one seems to like it anymore.
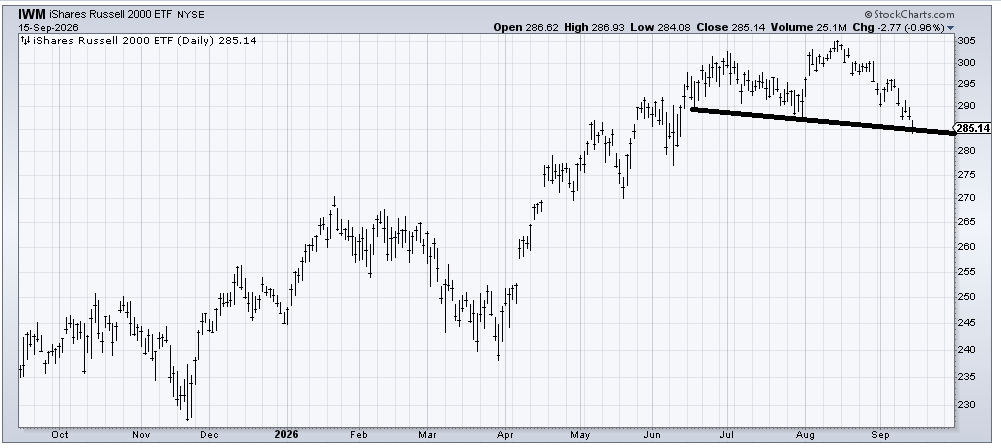
The other chart that I am going to watch with great interest is IWM, the ETF to be long the Russell 2000. It has made a lower low (even vs. July, not just last week) and is trading where it was in early May, thus it is hard to get excited over the small caps. But I have drawn in a downslanting support line. Will whatever the Fed decision is on Wednesday hold this or break this? It is certainly oversold enough to bounce.
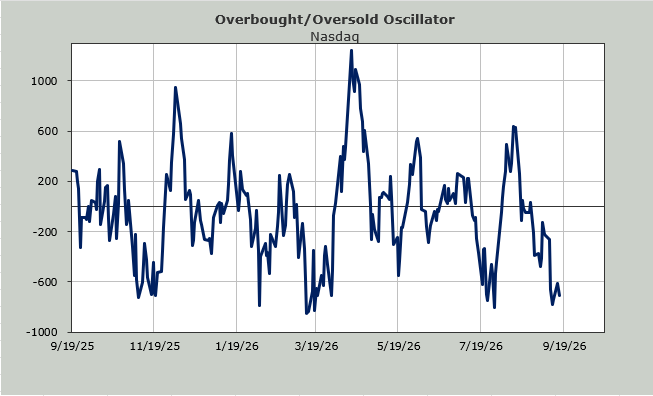
And yes, that remains the situation in the market: oversold enough to bounce. Yet sentiment is not yet concerned enough to fuss. The market just dribbles down with one green day in the last seven trading days. I see no fear, but rather I see folks saying no matter what the Fed does on Wednesday, we should expect the market to rally.
One Wall Street analyst is so revved up about a rally he says we could have a ‘face ripper’.
Since I have been updating you regularly on the NYSE Hi-Lo Indicator, I thought today we’d look at the Nasdaq Hi-Lo Indicator, since so many find it hard to believe there are that many stocks making new lows. Nasdaq doesn’t have the same issue as the NYSE; it is not laden with bond-like equities. Yet its Hi-Lo Indicator sits at .23. It would get oversold under .19. It has not been there since the spring lows.
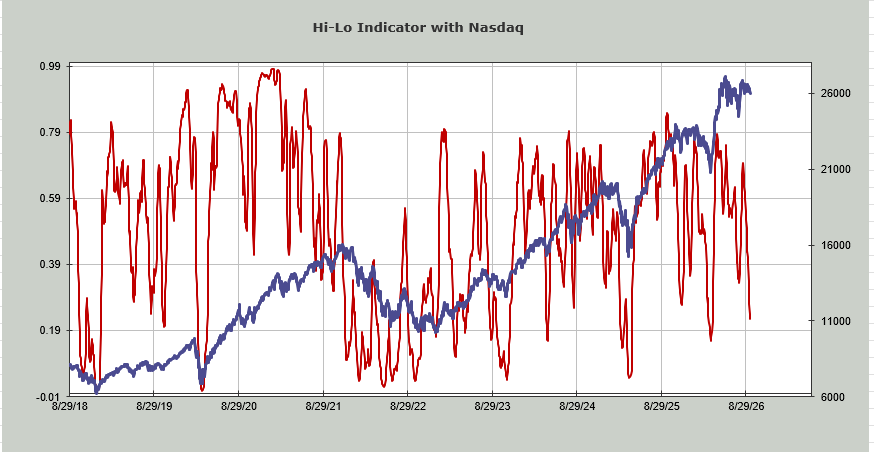
Perhaps the FOMC meeting will shake things up because right now, all we have is leakage, which gets us oversold but still relatively complacent.