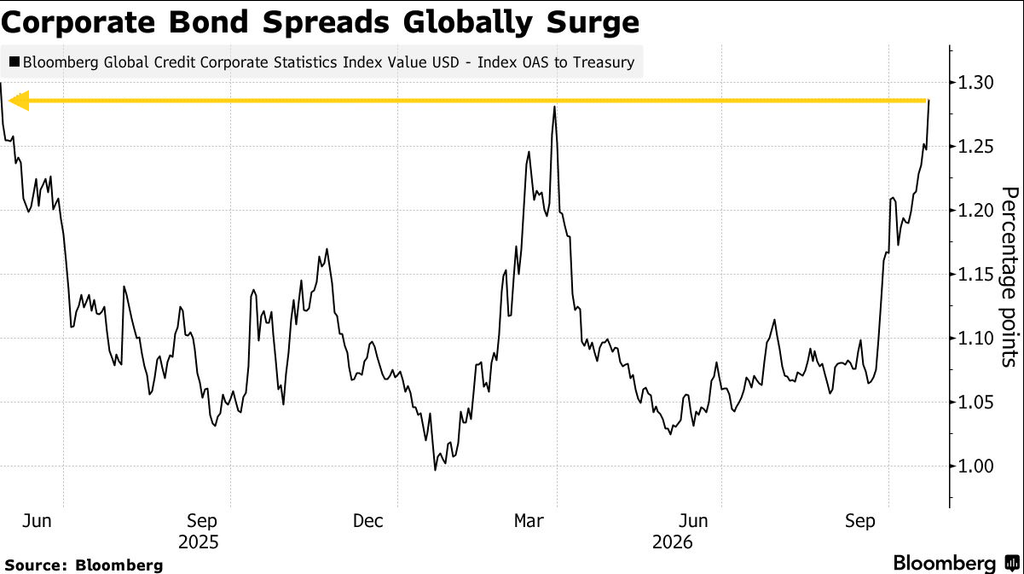
Bloomberg’s Global Corporate Credit Index (measure of aggregate bond spreads) have jumped to 129 basis points, the widest over the risk free rate since May 2025 (when they were recovering from the liberation day spike).
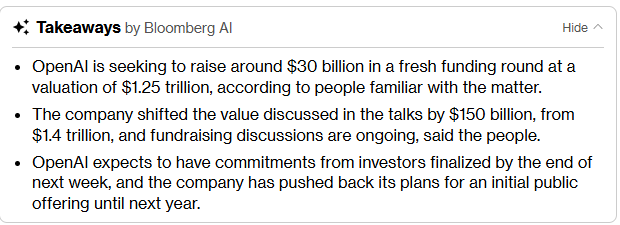
Perhaps not unrelated, Bloomberg is reporting that OpenAI’s valuation in its latest funding round is being trimmed to $1.25 trillion from $1.40 trillion.
Still that represents a nearly 50% increase from the $852 billion in its March funding round.
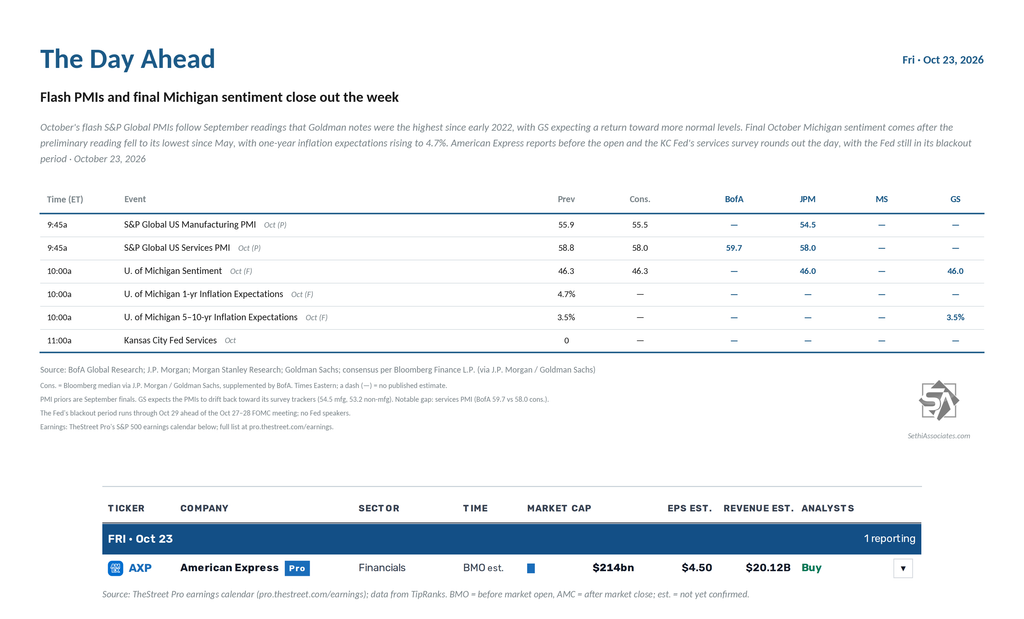
US economic data closes out the week with October’s flash S&P Global PMIs, final University of Michigan consumer sentiment and the Kansas City Fed’s services survey.
The Fed remains in its blackout period ahead of next week’s October 27–28 FOMC meeting.
No non-Bill (>1yr in maturity) US Treasury auctions.
Q3 earnings season continues with one S&P 500 component, American Express ($AXP).
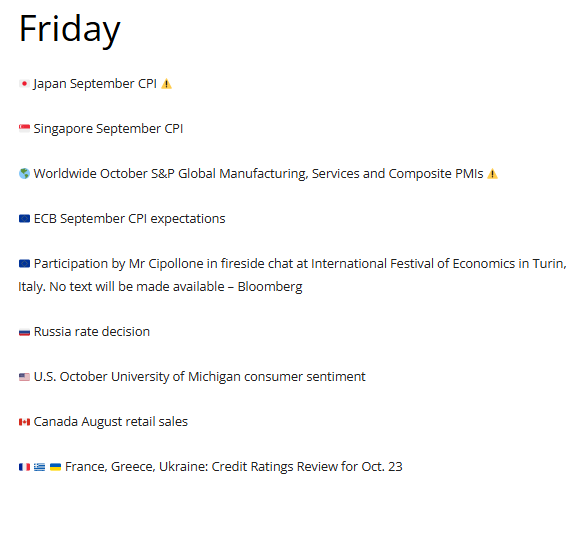
Ex-US highlights are global flash PMIs, ECB consumer expectations survey, UK October GfK consumer confidence, September retail sales, Japan September national CPI, and Canada August retail sales.
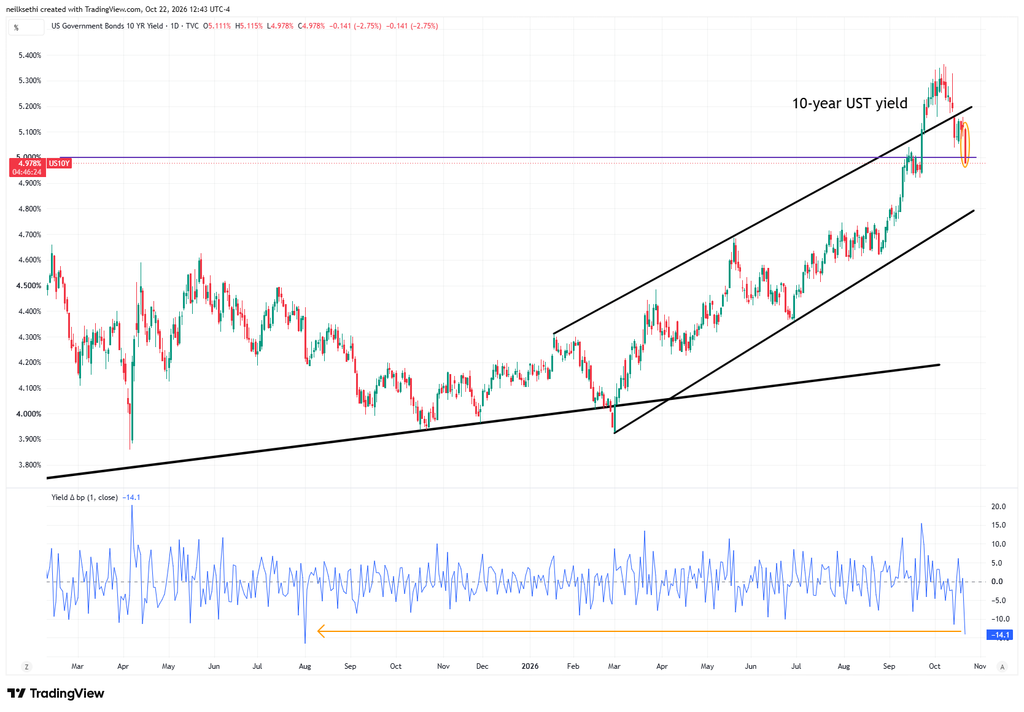
Worries about the sustainability of the AI trade surfaced once again, driving down a swath of related stocks, but other stocks rallied as Treasury yields dropped the most since August 2025, seeing equal-weight vs cap-weight the most extreme since 2024.
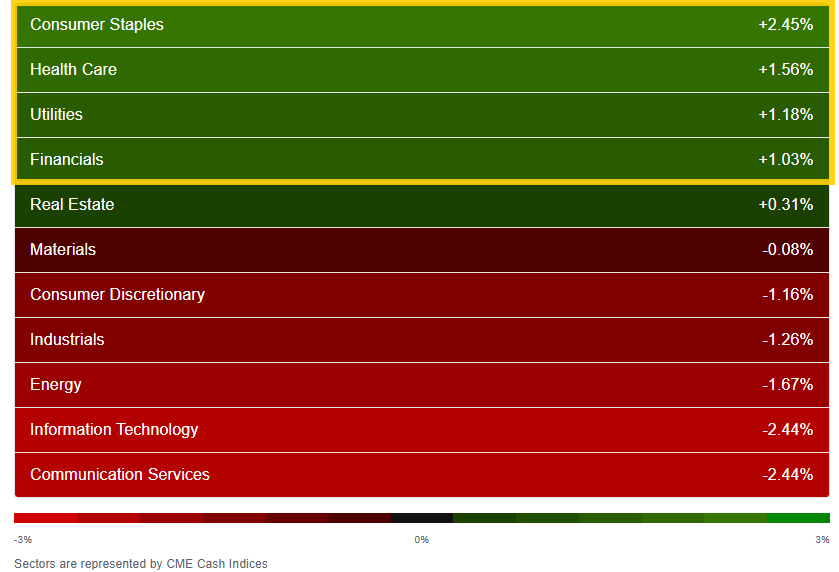
While AI-related sectors are down sharply, four sectors are up more than 1%.
Schwab
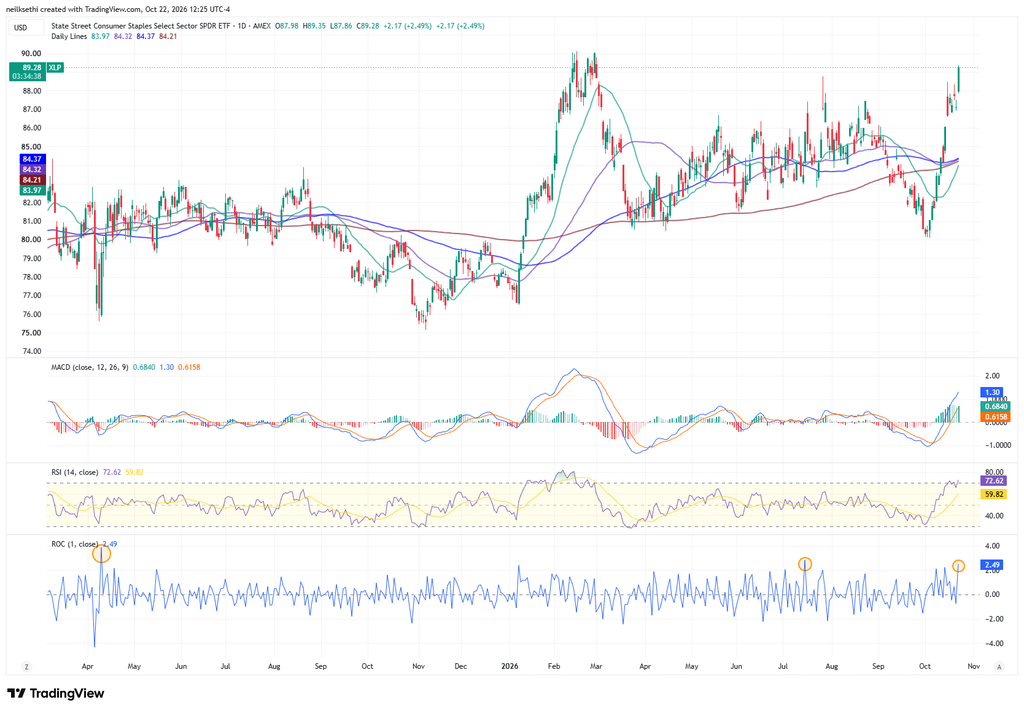
At the top of that list is Staples. The S&P 500 Staples Sector ETF ($XLP) is up 2.5%, its best day since July and before that April 2025 approaching its February all-time high.
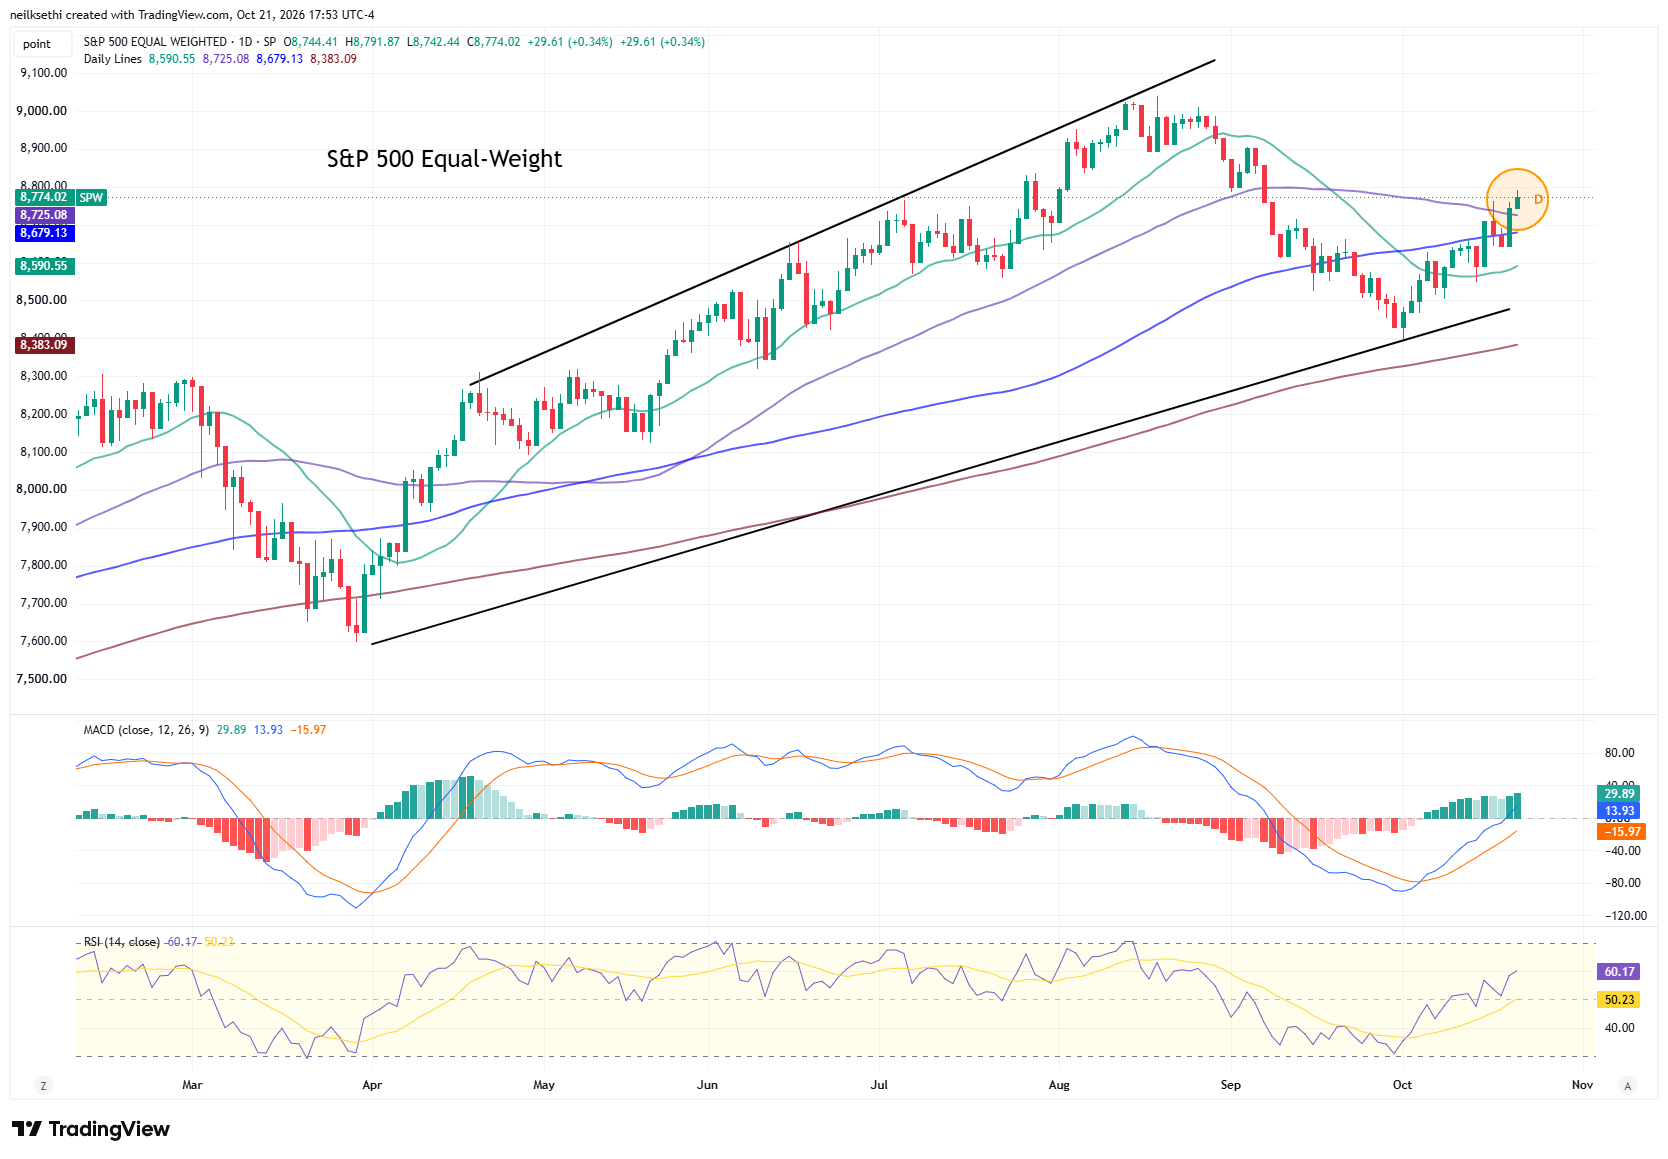
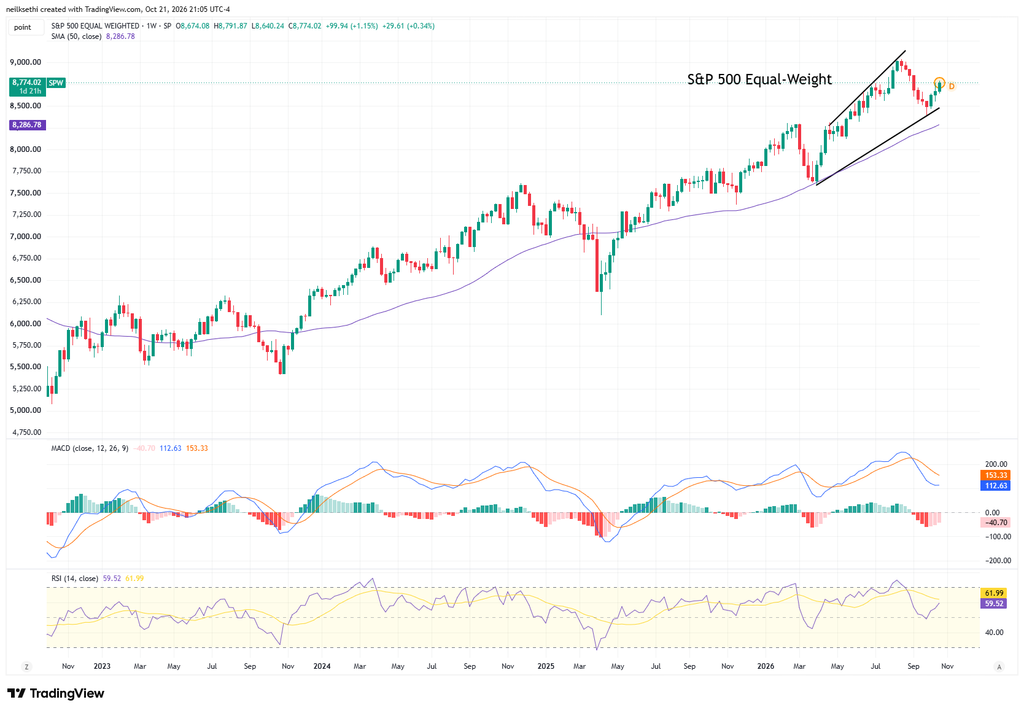
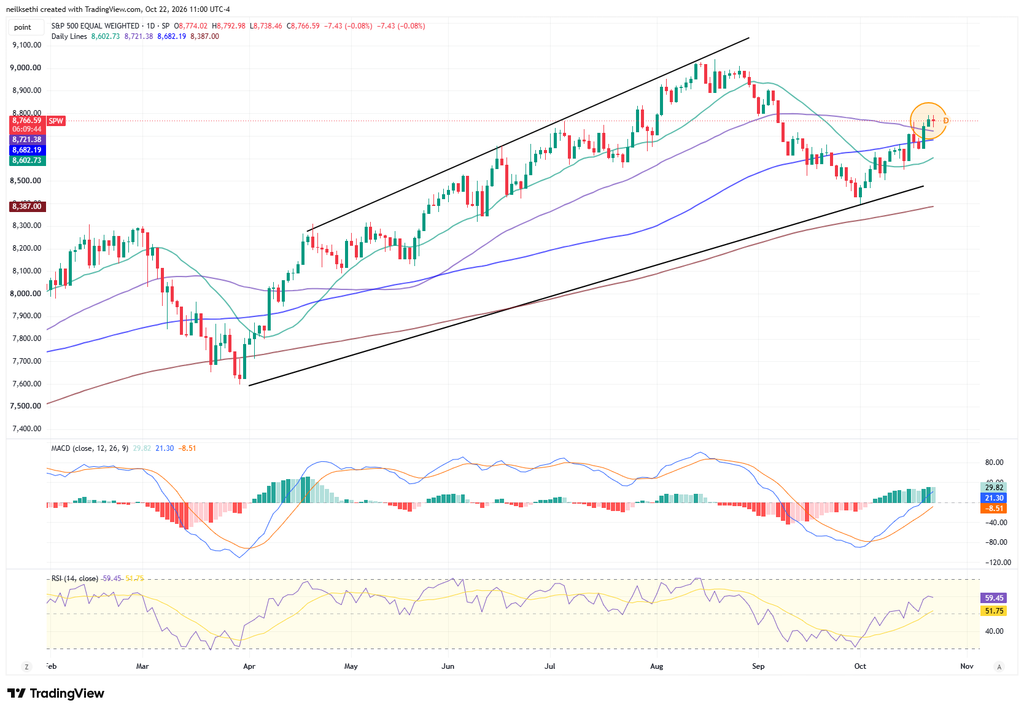
For those who read my nightly market updates, I have noted the past couple of weeks that the equal-weighted S&P 500 ($RSP) has “been able to hold up better” versus both the cap-weighted indices and the Russell 2000.
RSP took another step forward Wednesday confirming its Tuesday close above the 50-day moving average and extending its gain since the October 1 intraday low to over 4%. In addition, the daily MACD is strongly positive while the RSI is now over 60.
The weekly chart is solid, well above a rising 50-week moving average with the RSI also near 60. The weekly MACD is the one fly in the ointment not yet confirming the intermediate trend.
I initially took a small position at the daily MACD crossover two weeks ago with a stop at the October low, and then added a slug Wednesday on the extension over the 50-DMA, taking it to medium sized. I will hold that for now, going back to small sized on a break back below the 50-DMA. I will consider adding more depending on how things develop.
This was initially drafted premarket but it is continuing to hold up better this morning down just a touch versus the -1.3% decline in the S&P 500.
Meta’s spending warnings and share-class fine print, Tesla’s capex cut, and a ‘not good enough’ beat from Lam Research are dragging Tech lower adding to a broader risk-off tape.
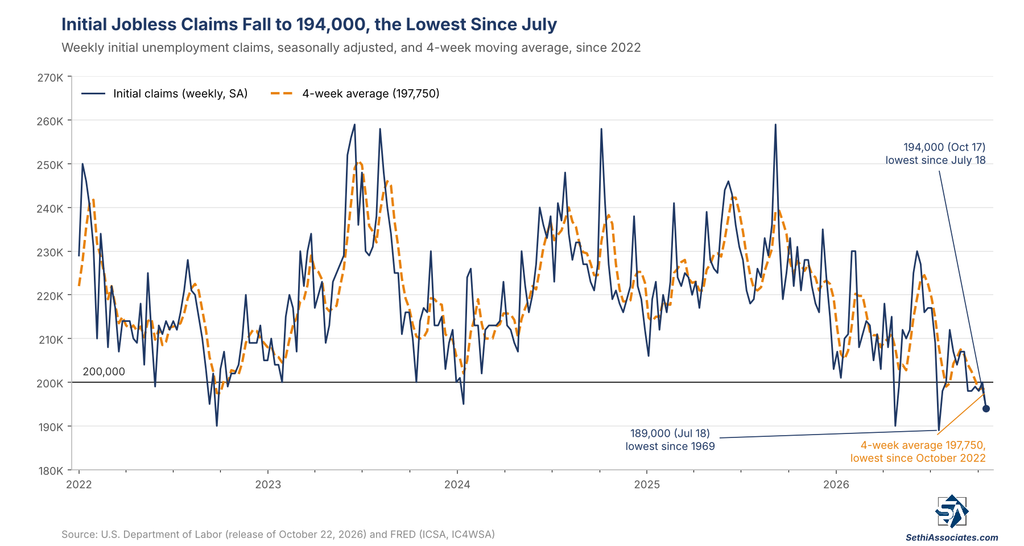
Initial jobless claims for the week ending October 17: 194,000 (estimate 200,000; previous 199,000; revised previous 200,000)
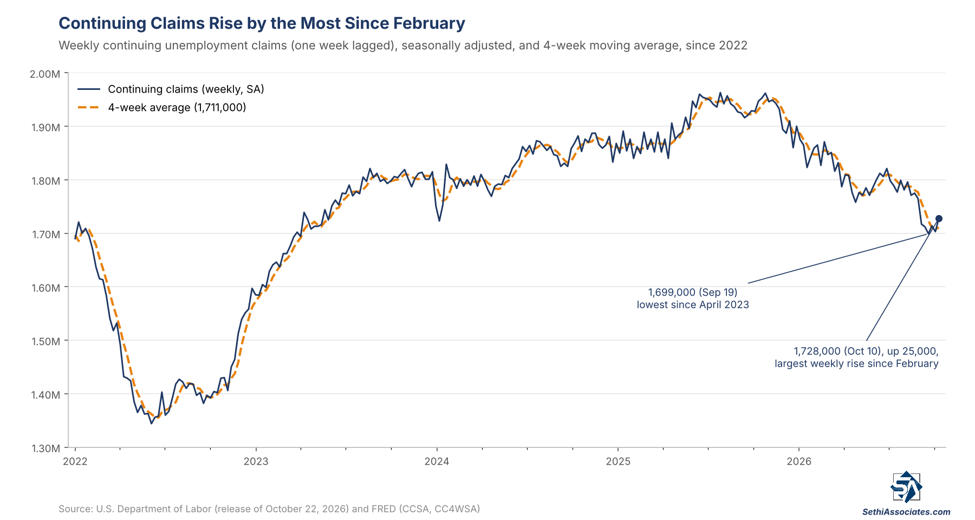
Continuing claims for the week ending October 10: 1,728,000 (previous 1,710,000; revised previous 1,703,000).
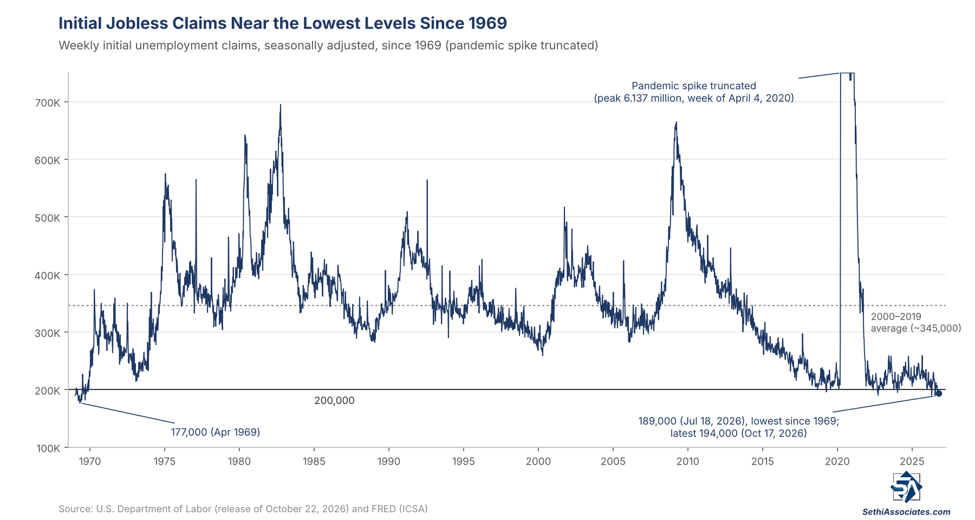
After bottoming at 189,000 in mid-July — the lowest reading since 1969 — initial jobless claims have barely budged, this week falling 6,000 in the week through October 17 to 194,000, the lowest since July 18 (from a revised 200,000 the prior week). That makes it only the 16th week below 200,000 since 1969, leaving claims near cycle lows at the bottom of the relatively narrow range that has held since November 2021. The upward revision to the prior week, to 200,000, ended the run below that mark at four straight weeks (September 12 through October 3), still the longest since 1969.
The four-week average fell 1,000 to 197,750, the lowest since October 2022 (roughly 30,000 lower year-over-year).
Continuing claims (seasonally adjusted) in the week through October 10th (one week lagged) though rose 25,000, the largest weekly increase since February, to 1,728,000 (after a 7,000 downward revision to the prior week), but remain near the least since April 2023 hit three weeks earlier and towards the bottom of the roughly 1.70 million to 2.0 million range that has held since mid-2023 — historically low, though not quite as low as initial claims.
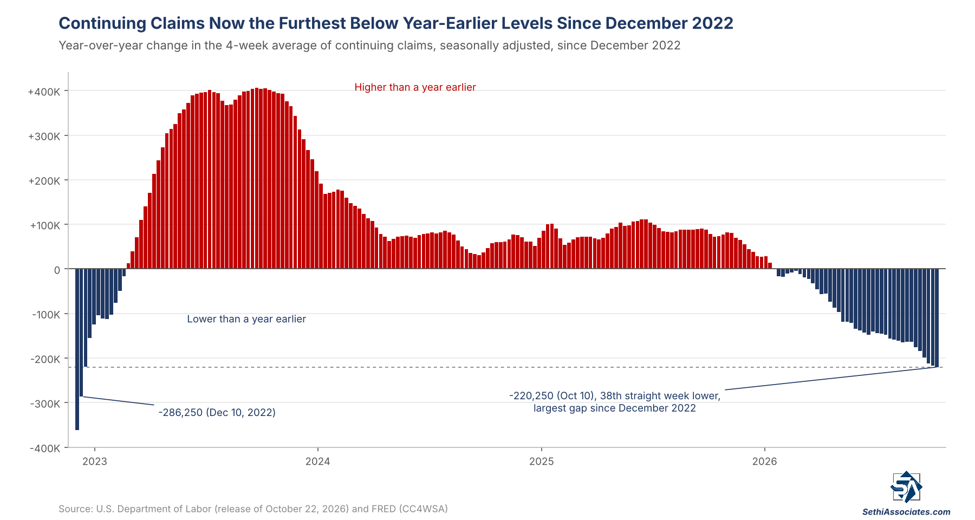
The four-week average of continuing claims rose 4,000 to 1,711,000 (after the prior week was revised down to 1,707,000, matching the lowest since April 2023), but remains lower year-over-year for a 38th straight week (down 220,250) — the largest such gap since December 2022.
The 20-year pre-pandemic average for initial claims is 345,000 and continuing claims roughly 2.9 million.
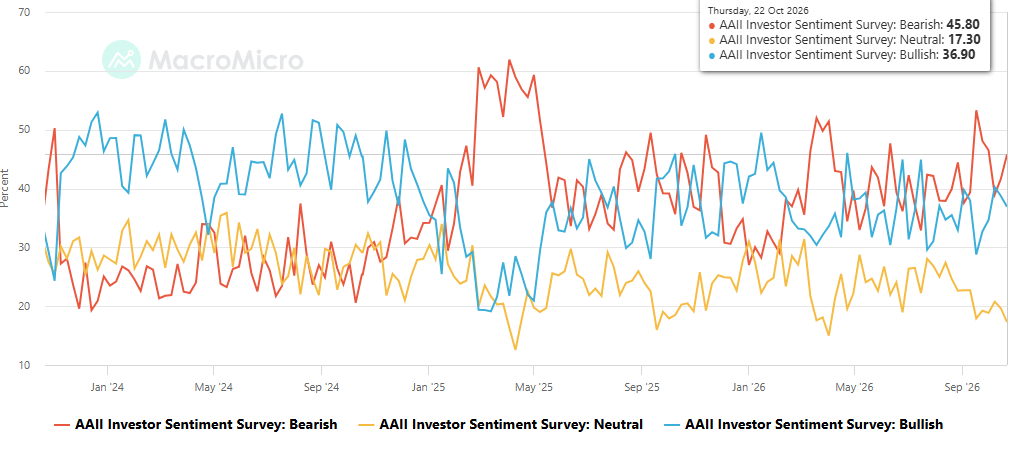
American Association of Individual Investors (AAII), a retail focused weekly investor survey,moves more bearish:
AAII Bulls (those who see higher stock prices in 6 mths, blue line) eased to 36.9% from 38.7% the prior week (still though above the 28.8% five weeks ago, which was the least since September 2025), and falling back below the long-term historic average of 37.5% after two weeks above.
Bulls also remained below the level of the Bears (who see lower stock prices in 6 mths, red line), as the Bears rose to 45.8% from 41.6% the prior week (still though below the 53.3% five weeks ago, the highest since May 2025). That leaves Bulls above Bears just twice in the last 14 weeks. Bears also remain above the long-term average of 31.0% for a 36th straight week (and they’ve only been below it 9 weeks since Dec 12, 2024).
The Neutral camp (yellow line) dropped to 17.3%, the least since early early April, from 19.7%. It remains under the long-run average of 31.5% and has been over that only twice since July 2024.
Here are a few more charts from Helene Meisler’s X feed
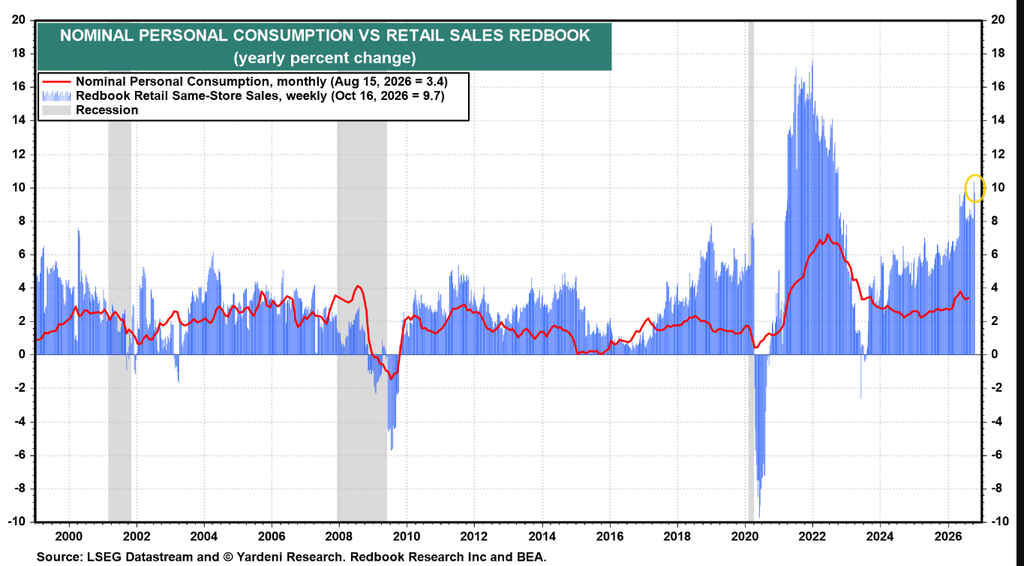
Redbook sales*in the week of October 16th decelerated but remained very healthy at +9.7% y/y growth, after hitting +10.4% the prior week, which was the best since 2022, well above the 2025 average of +5.8% y/y.
*Redbook sales are same-store sales across a panel of large general-merchandise retailers, such as department stores, discount chains, apparel retailers, drugstores, and warehouse clubs.