Are Stocks About to Repeat July 2024?

I promised I would use flashing lights and siren emojis when the Daily Sentiment Index (DSI) for the VIX got to single digits. So, I can’t yet use those flashing lights and emojis. I can, however, tell you that Thursday’s rally in the S&P brought us a reading of 10.
Typically, a reading that low is accompanied by a high reading in the S&P and/or Nasdaq. Yet those two still sit hovering at that 80 level with Thursday’s reading for the S&P at 79 and Nasdaq’s at 75. Recall Nasdaq reached 85 in mid-May.
Recall the discussion the other day about all that single stock volatility that never seems to show up in the S&P. That may still be the case (that we never see a volatile market again!), but I have rarely seen a DSI get to single digits (yes, I know it is not there yet, but the door is open and one foot is in there). I would not bet against this.
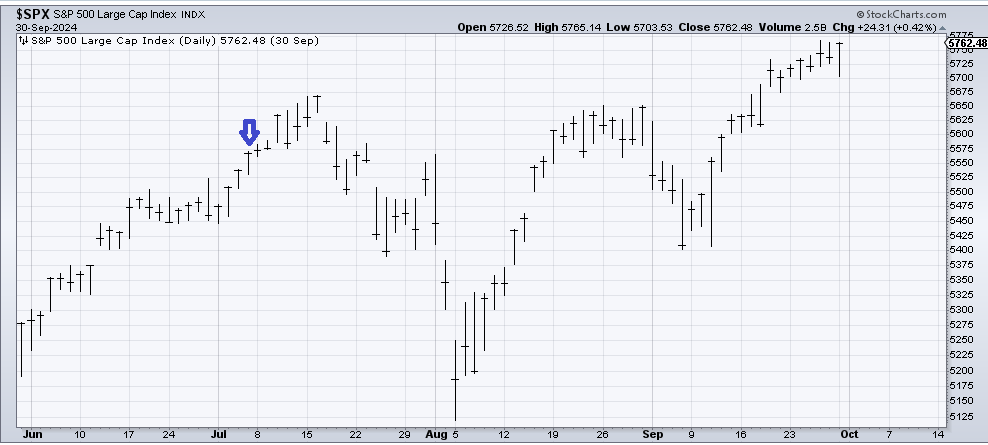
Just a reminder that while we all want instant gratification (we are all teenagers at heart), there are times that the DSI gets extreme, and it takes a few weeks for the market to care. I am reminded of the DSI for Nasdaq pushing just over 90 in early July 2024, and yet the market kept on going, onward and upward. For almost two more weeks! And then the market acted like Wylie E Coyote stepping off the cliff.
It’s not always that dramatic, but readings this low do not tend to come around very often, so be aware.
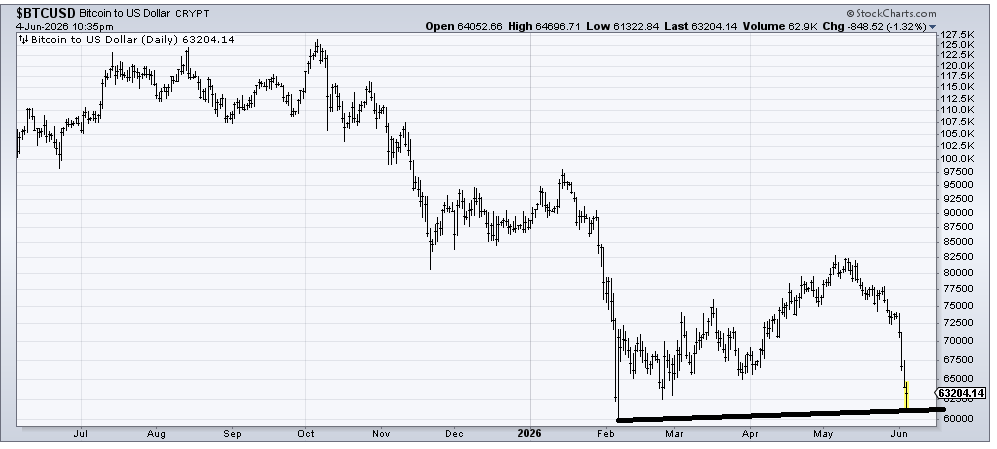
As long as we’re talking about low readings in the DSI, let me report that the DSI for Bitcoin is now 10. It has been that way for three days now (and still BTC went lower). Long-time readers know I am no fan of BTC as I see its only use case for criminal activities, but it is now at the February low, and I’m starting to hear calls for it to go to 50k or even 40k, so it probably is due a bounce.
As for Thursday’s rally, it was more either/or. If the semis/tech take a break, the others can rally. Some day that will change, but Thursday was not that day.
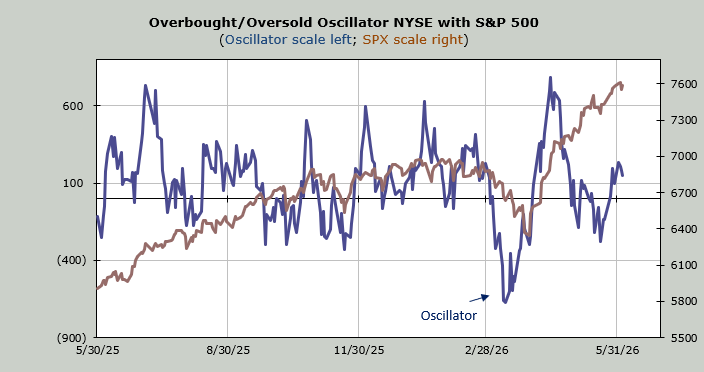
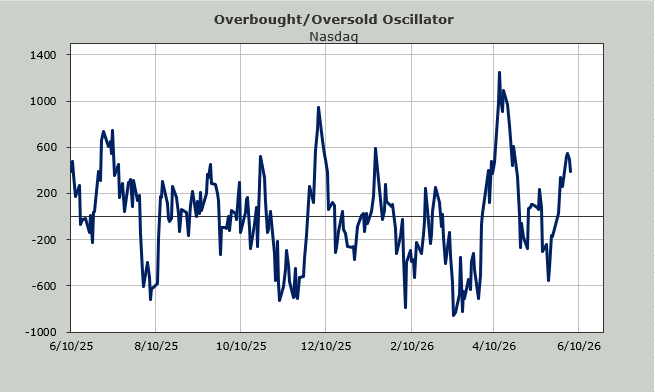
You may look at the Overbought/Oversold Oscillator and wonder, why did it tick down? Because the market is overbought. This indicator is based on breadth. Breadth on Wednesday was -1420. Breadth on Thursday was +1100. There was no addition, only subtraction.
Also, ten trading days ago (from Thursday), breadth was +1450, so we replaced +1450 with +1100. It’s just not enough momentum to turn this upward. That is the definition of overbought: a loss of upside momentum.
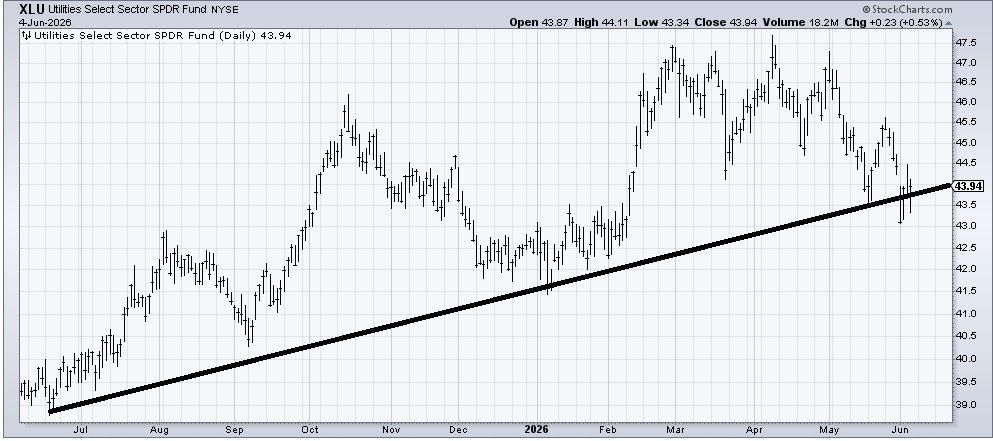
The best news I saw on Thursday was that the Utes are desperately trying to hold that support level, and after being down in the early going, managed to close green.