Are Options Traders Sounding a Warning Signal for Stocks?

I’d be happy to talk about the potential for a double top in the SOX, but it seems everyone sees it. I’d even be happy to note that the head and shoulders top I pointed out last week in the big cap indexes failed. Or did it?
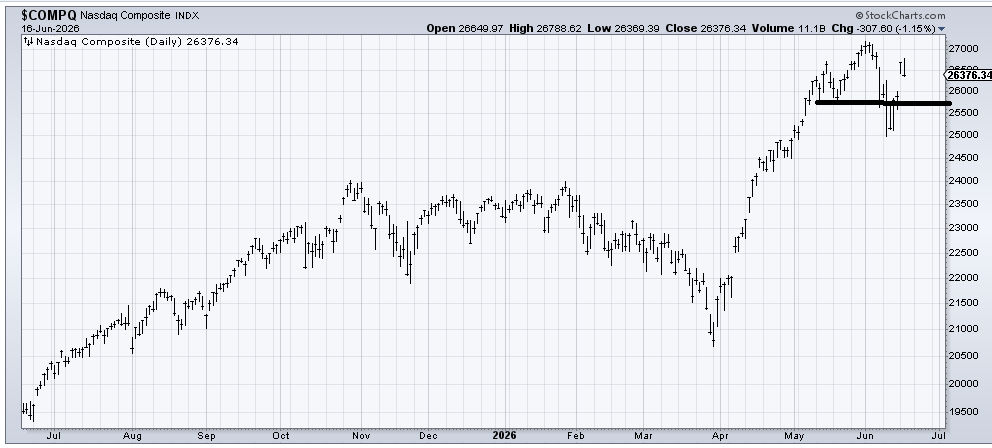
The major indexes had funky head and shoulders tops last week, and all stopped about one or two percent from completing their measured targets. And now we have a really funky potential head and shoulders top that I did not see anyone comment on. I mean if Nasdaq gaps down from this action of the last two days, it will leave these two days behind as an island and maybe even as the right shoulder of a head and shoulders top. Heck, it wouldn’t even need to gap down for the head and shoulders pattern.
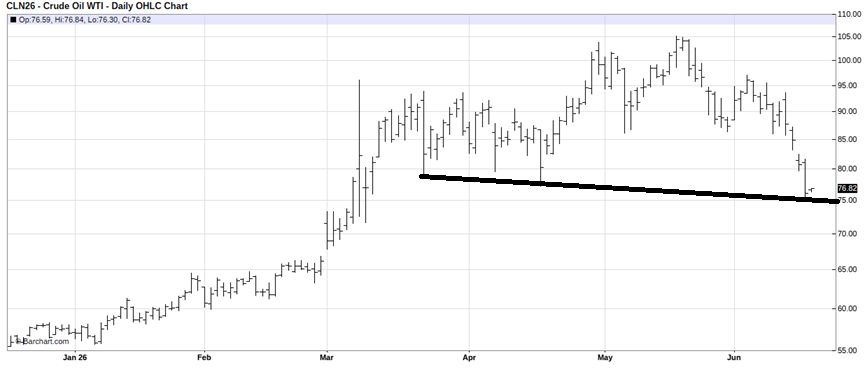
But the chart I really want to comment on is the Transports. Oil has had one heckuva tumble in the last few days. Since mid-May, it has fallen from 105 to 75. In the last two days, it is down ten bucks. It’s at support now. But gosh, it’s not a great chart, is it?
But now that everyone is convinced oil is going back down, I want to report that the Daily Sentiment Indicator (DSI) is at 25. It’s getting a bit late to be so bearish on oil.
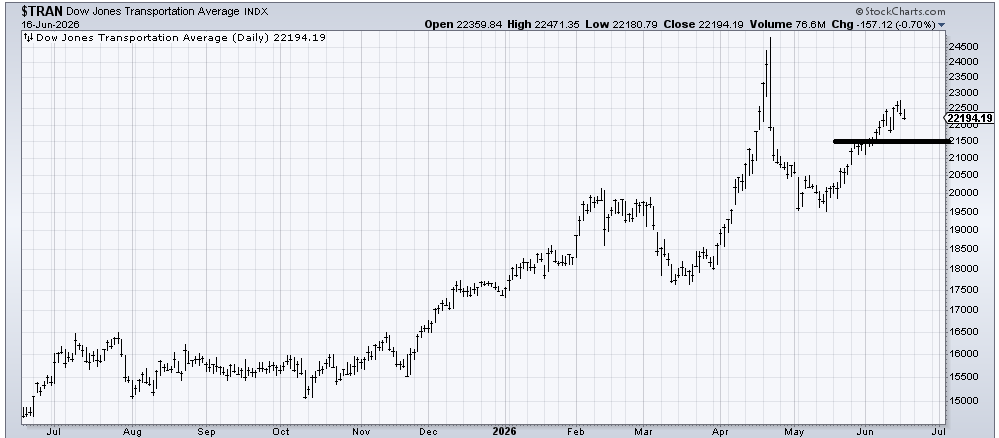
While oil has been falling for the last month, the Transports have been rising. Makes sense, doesn’t it? So why, over the last two days, when oil has come down ten bucks in a hurry, have the Transports come down too? I am terrible at narratives, but with the DSI getting low on oil and the Transports rolling over, I don’t think I would take my eyes off this.
But let’s get back to Nasdaq. The pattern is there. It is a possibility. My view has been that a pullback should lead to another rally as we then head back to an overbought condition. I am only pointing out that possible head and shoulders pattern in case I am wrong about my indicators.
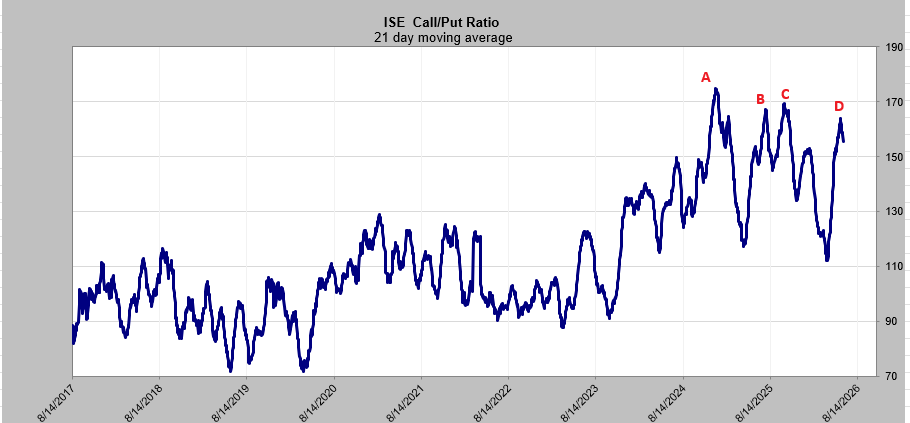
There was a change in sentiment on Tuesday. Oh, sure, the beloved semis were down, but that was reflected in the ISE equity call/put ratio. It chimed in at 1.83. That is now the second reading under 2.0 we’ve seen in a week.
For a one-day reading, I take it as bullish (for the market), but when it gets persistent, it is no longer bullish; it got persistent in February. And then there is the 21-day moving average of this indicator. You can see four peaks on the chart since 2025.
Point A was early 2025, and we know that ended up with the Tariff Tantrum. Point B was late July 2025. We had a two-day whack in the market before resuming the uptrend. Point C was in late January this year, about a month before we had the Iran War swoon.
Point D came along the first week of June. We had the swoon, but thus far, the jury is still out if there will be more to come.
I still think we see the market try and rally again, but remember the intermediate-term indicators and sentiment are not in the same place they were in late March, so I will not get comfortable with the market.